

CBR-050219(2)_watermark
.pdfvk.com/id446425943
Central Bank of Russia
Wait-and-see mode
Update
Economic Research
5 February 2019
Economics
Russia
Oleg Kouzmin
+7 (495) 258-7770 x 4506 OKouzmin@rencap.com
On Friday (8 February), we expect the Central Bank of Russia (CBR) to keep the key interest rate at 7.75%. We expect no more rate hikes if inflation peaks at <6% in March-April and geopolitical risks do not increase in 1Q19.
We expect the CBR to keep the rate at 7.75% on Friday
The policy statement is due to be published at 1:30pm Moscow time (10:30am London time) on 8 February. We believe the CBR will keep the key rate unchanged, in line with Bloomberg consensus. After the previous meeting on 14 December, the CBR noted that it will assess the need for future policy tightening depending on inflation and economic developments, and external risks. We believe the CBR will maintain rates at the upcoming meeting just to see how inflation dynamics and its forecasts are affected by the recent VAT increase. We see a rise in inflation expectations – which we believe is expected by the CBR and the market (Figure 2).
Figure 1: CPI and its components, % YoY
|
CPI |
|
|
Food |
|
|
Non-food |
|
Services |
||
24 |
|
|
|
|
|
21 |
|
|
|
|
|
18 |
|
|
|
|
|
15 |
|
|
|
|
|
12 |
|
|
|
|
|
9 |
|
|
|
|
|
6 |
|
|
|
|
|
3 |
|
|
|
|
|
0 |
|
|
|
|
|
2008 |
2010 |
2012 |
2014 |
2016 |
2018 |
Source: Rosstat, Renaissance Capital
No more hikes needed if CPI peaks at <6%
We believe future rate hikes could be avoided if headline inflation does not approach 6% in March-April (our forecast: it peaks at 5.6-5.7%). This could be a sign that inflation will only accelerate due to direct supply-side effects, while indirect effects (such as an acceleration of inflation due to worsening inflation expectations) remain muted meaning that future inflation trends remain under control (especially under cooling consumer demand growth).
Potential sanctions are a major unknown
If we are wrong about the inflation forecast, and then the CBR makes another 25-bpt rate hike in March, it will definitely mark the end of the rate-hiking cycle, in our view…unless new sanctions arrive. Possible sanctions remain a major unknown, especially after newly elected members join the US Congress in 1Q19 and ahead of the Ukrainian presidential elections due on 31 March 2019. As our scenario analysis shows (Figures 3 and 8), if sanctions hurt Russia and the oil price remains close to current levels ($65/bl), then the rate might range from 9.25% to 11.5% at end-2019.
Russian 2018 GDP growth surprised positively (2.3%)
On 4 February, Rosstat reported that in 2018 Russian GDP expanded at the fastest pace in six years (2.3%). From the demand-side, the print was supported by a further acceleration of exports (6.3%) and stronger net domestic consumption (excluding imports). The sector breakdown shows that Russian growth primarily benefited from revised data of construction activity (5%), as well as the mining sector (4%), higher commodity prices supporting the financial sector (6%) and the World Cup, with hotels/restaurants up by 6%. We forecast that this year’s growth should be softer
(1.2%), while 2020 growth accelerates to 2.4%. In contrast with some media reports, we would not question the quality of the 2018 print. First, while late and significant data revisions are inconvenient, we do not think that a 2.3% GDP print is unachievable considering the dynamics of the second-tier economic indicators. Second, we note that although a preliminary estimate of c. 1.5% growth in 9M18 looked at odds and weaker than other indicators suggested, this disparity to the weaker side did not raise an issue of data credibility among the public.
Figure 2: Inflation expectations (direct)
Observed inflation, % YoY
Inflation expected in the next 12 months, % YoY
28 |
|
|
|
|
|
|
|
|
26 |
|
|
|
|
|
|
|
|
24 |
|
|
|
|
|
|
|
|
22 |
|
|
|
|
|
|
|
|
20 |
|
|
|
|
|
|
|
|
18 |
|
|
|
|
|
|
|
|
16 |
|
|
|
|
|
|
|
|
14 |
|
|
|
|
|
|
|
|
12 |
|
|
|
|
|
|
|
|
10 |
|
|
|
|
|
|
|
|
8 |
|
|
|
|
|
|
|
|
6 |
|
|
|
|
|
|
|
|
Apr-10 |
Apr-11 |
Apr-12 |
Apr-13 |
Apr-14 |
Apr-15 |
Apr-16 |
Apr-17 |
Apr-18 |
Source: CBR, FOM
Figure 3: Scenarios for contagion effects of potential sanctions on Russian state debt
Brent oil, $/bl |
|
65 |
|
‘Soft’ |
‘Hard’ |
Real GDP growth |
0.5% |
-0.8% |
RUB/$, annual avg |
70.8 |
75.7 |
Inflation, annual avg |
6.3% |
8.2% |
Policy rate by year-end |
9.25% |
11.5% |
Brent oil, $/bl |
50 |
80 |
||
|
‘Soft’ |
‘Hard’ |
‘Soft’ |
‘Hard’ |
Real GDP growth |
0.1% |
-1.3% |
0.8% |
-0.4% |
RUB/$, annual avg |
76.6 |
84.0 |
66.4 |
70.2 |
Inflation, annual avg |
8.2% |
11.0% |
5.5% |
6.2% |
Policy rate by year-end |
11.5% 14.0% |
8.25% 9.0% |
||
Source: Renaissance Capital estimates
© 2019 Renaissance Securities (Cyprus) Limited. All rights reserved. Regulated by the Cyprus Securities and Exchange Commission (Licence No: KEPEY 053/04). Hyperlinks to important information accessible at www.rencap.com: Disclosures and Privacy Policy, Terms & Conditions, Disclaimer.
vk.com/id446425943
Renaissance Capital
5 February 2019
Central Bank of Russia
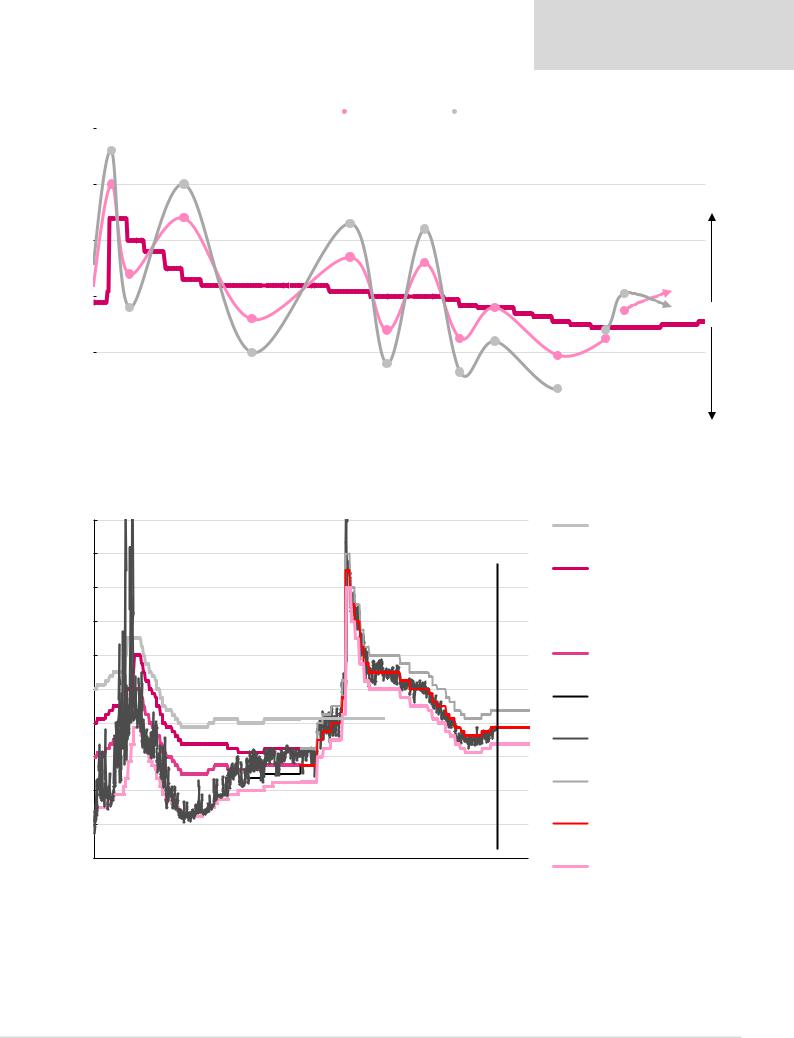
Figure 4: Cycles in the CBR’s policy stance (‘CBR mood’ in the chart, which we think tends to be exaggerated by market economists/analysts)
25 |
|
|
The CBR key rate |
|
|
'CBR mood' |
|
|
|
'Consensus interpretation' |
|
|
|
|
|
|
|
|
|
|
|
|
|||||
|
|
|
|
|
|
|
|
|
|
|
|
|
|
Dec 14: 'No rate |
|
|
|
|
|
|
|
|
|
|
|||
|
|
|
|
|
|
|
|
|
|
|
|||
|
cuts until June!' |
|
|
|
|
|
|
|
|
|
|
||
|
Mid-15: 'The CBR are cutting |
|
|
|
|
|
|
|
|
|
|
||
20 |
slowly - not many cuts this year!' |
Mid-16: 'Rate cuts would be |
Start-17: 'Budget rule puts |
|
|
||||||||
|
|
|
|
|
|
||||||||
|
|
|
|
limited - no budget |
pressures on the rouble |
|
|
|
|||||
|
|
|
|
consolidation strategy!' |
and reduces the scope for |
|
2H18: |
||||||
|
|
|
|
|
|
|
|
the rate cuts!' |
|
|
|||
15 |
|
|
|
|
|
|
|
|
|
another |
|||
|
|
|
|
|
|
|
|
|
|
|
|
||
|
|
|
|
|
|
|
|
|
|
|
Jun 18: |
sanctions |
|
|
|
|
|
|
|
|
|
|
|
|
|
||
|
|
|
|
|
|
|
|
|
|
Mid-17: inflation 'spikes' |
& two front |
||
|
|
|
|
|
|
|
|
|
|
announcement |
|||
|
|
|
|
|
|
|
|
|
|
to 4.4% due to delayed |
of VAT |
loaded |
|
|
|
|
|
|
|
|
|
|
|
harvest supplies |
rate hikes |
||
10 |
|
|
|
|
|
|
|
|
|
increase |
|||
|
|
|
|
|
|
|
|
|
|
|
|
||
|
|
|
|
|
|
|
|
|
|
|
|
|
|
|
Jan 15: 'This is too early to |
|
|
|
|
|
|
|
|
|
|
||
|
cut rates - the CBR gives up |
|
|
|
|
|
|
|
|
Apr 18: new |
|
||
5 |
inflation targeting!' |
|
|
End-16: 'Rate cuts |
|
Apr 17: 'The rouble |
|
sanctions |
|
||||
|
|
|
|
|
|
|
|
||||||
|
End-15: 'Inflation would be crushed very |
|
is strong and |
4Q17-1Q18: front- |
|
||||||||
|
will happen soon as |
inflation is nearly at |
|
||||||||||
|
soon, and we'll see a 400 bps rate cuts as |
loaded rate cuts with |
|
||||||||||
|
the CBR lifts an oil |
|
4% - more cuts |
|
|||||||||
|
the CBR targets a 3% real policy rate!' |
|
CPI at 2-3% |
|
|||||||||
|
price outlook!' |
|
happeing soon!' |
|
|||||||||
0 |
|
|
|
|
|
|
|
|
|
||||
|
|
|
|
|
|
|
|
|
|
|
|
|
|
Nov-14 Feb-15 May-15 Aug-15 Nov-15 Feb-16 May-16 |
|
Aug-16 Nov-16 Feb-17 |
May-17 Aug-17 Nov-17 Feb-18 |
May-18 Aug-18 |
Nov-18 |
||||||||
Too hawkish
Too dovish
Note: Consensus interpretation could be exaggerated in this chart; LHS shows CBR key rate in %; RHS is not a numerical axis.
Source: CBR, Renaissance Capital
Figure 5: CBR interest rate corridor and RUONIA rate, %
20 |
|
|
|
|
|
|
|
|
|
|
|
18 |
|
|
|
|
|
|
|
|
|
|
|
16 |
|
|
|
|
|
|
|
|
|
|
|
14 |
|
|
|
|
|
|
|
|
|
|
|
12 |
|
|
|
|
|
|
|
|
|
|
|
10 |
|
|
|
|
|
|
|
|
|
|
|
8 |
|
|
|
|
|
|
|
|
|
|
|
6 |
|
|
|
|
|
|
|
|
|
|
|
4 |
|
|
|
|
|
|
|
|
|
|
|
2 |
|
|
|
|
|
|
|
|
|
|
|
0 |
|
|
|
|
|
|
|
|
|
|
|
2008 |
2009 |
2010 |
2011 |
2012 |
2013 |
2014 |
2015 |
2016 |
2017 |
2018 |
2019 |
The CBR refinancing rate
The CBR stand-by REPO rate
 The CBR stand-by deposit rate
The CBR minimum REPO rate
The CBR maximum deposit auction rate
Interbank market O/N rate (RUONIA / MIACR)
The unified rate on o/n stand-by refinancing operations
The CBR key rate
The CBR stand-by deposit rate
Source: CBR, Renaissance Capital
2
vk.com/id446425943
Renaissance Capital
5 February 2019
Central Bank of Russia
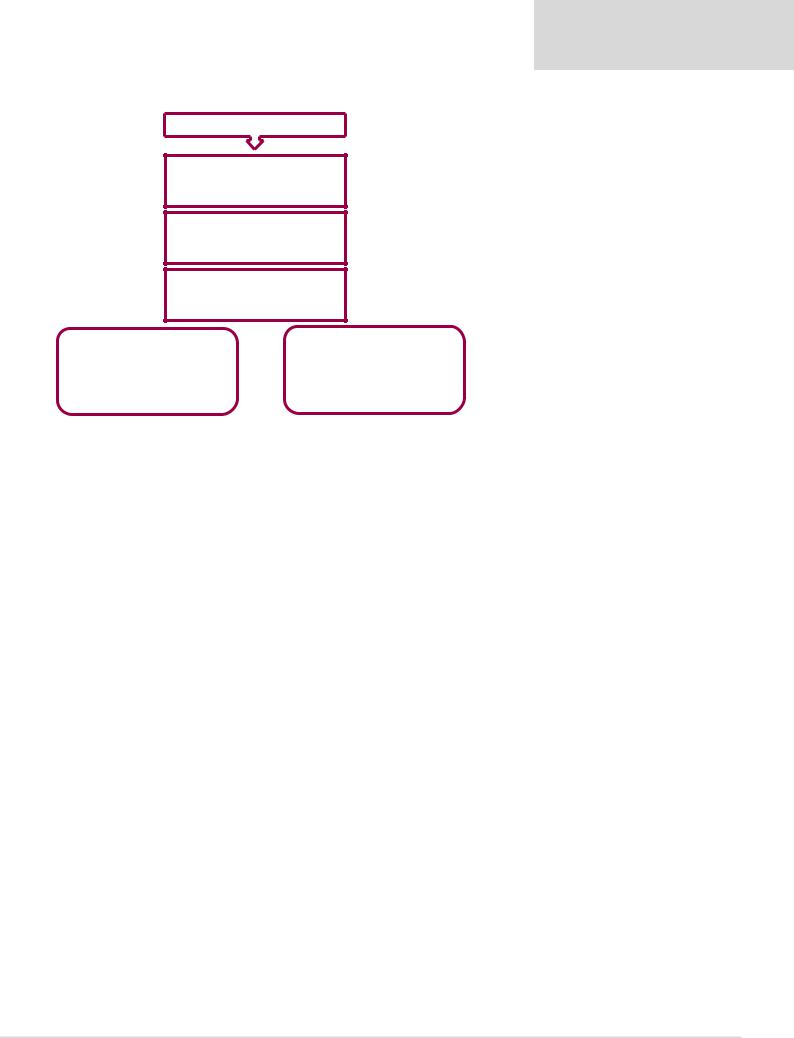
Figure 6: Approaches to calculate a neutral policy rate
Real ‘neutral’ rate
Equilibrium foreign policy rate (average between US & eurozone)
0.5-1.0%
Russian risk premium (CDS / Eurobond spreads)
1.0-1.5%
RUB REER depreciation
0-0.5%
1.5-3.0% (real rate) |
|
|
|
|
|
|
|
1.5-3.0% (real rate) |
|
|
|
|
|
||||||||
+ |
|
|
|
|
|
|
|
|
|
|
|
+ |
|
|
|
|
|
|
|
|
|
4% inflation |
|
|
|
|
|
|
|
4%-plus inflation expectations |
|
|
|
|
|
||||||||
= |
|
|
|
|
|
|
|
|
|
|
|
= |
|
|
|
|
|
|
|
|
|
5.5-7.0% nominal rate |
|
|
|
|
|
5.5-7.0%-plus nominal rate |
|
|
|
|
|
||||||||||
|
|
|
|
|
|
|
|
|
|
|
|
|
|
|
|
|
Source: Renaissance Capital |
||||
Figure 7: Oil scenarios for Russia |
|
|
|
|
|
|
|
|
|
|
|
|
|
|
|
|
|
||||
Year |
|
2018E |
|
|
|
|
|
|
|
2019E |
|
|
|
|
|
|
|
|
2020E |
||
Brent oil, $/bl |
|
|
72 |
|
90 |
80 |
70 |
65 |
|
60 |
|
55 |
50 |
|
40 |
|
30 |
|
60 |
||
|
|
|
Base case |
|
|
|
|
||||||||||||||
|
|
|
|
|
|
|
|
|
|
|
|
|
|
|
|
|
|
|
|
||
Real GDP growth |
|
|
2.3% |
|
1.8% |
|
1.5% |
1.3% |
1.2% |
|
1.1% |
0.9% |
0.6% |
|
0.3% |
|
-1.4% |
2.4% |
|||
RUB/$, annual avg |
|
|
62.8 |
|
60.8 |
63.9 |
65.6 |
66.3 |
|
67.4 |
69.8 |
71.1 |
|
73.2 |
|
81.0 |
68.5 |
||||
Inflation, annual avg |
|
|
2.9% |
|
5.0% |
|
5.1% |
5.3% |
5.4% |
|
5.5% |
5.8% |
6.1% |
|
6.7% |
|
8.4% |
3.8% |
|||
Policy rate by year-end |
|
|
7.75% |
|
7.5% |
7.5% |
7.5% |
7.75% |
|
7.75% |
8.0% |
8.5% |
|
11.0% 13.0% |
7.25% |
||||||
|
|
|
|
|
|
|
|
|
|
|
|
|
|
|
|
|
|
|
|
|
|
Current account, % of GDP |
|
|
6.7% |
|
7.3% |
6.6% |
5.7% |
5.4% |
|
4.9% |
4.8% |
3.9% |
|
2.4% |
|
3.0% |
4.1% |
||||
Budget balance, % of GDP |
|
|
2.0% |
|
4.1% |
|
3.4% |
2.5% |
2.0% |
|
1.5% |
0.8% |
0.5% |
|
-0.6% |
-2.0% |
0.8% |
||||
GDP, $bn |
|
|
1,629 |
1,845 |
1,723 |
1,641 |
1,618 |
|
1,574 |
1,365 |
1,456 |
|
1,364 |
|
1,172 |
1,643 |
|||||
|
|
|
|
|
|
|
|
|
|
|
|
|
|
|
Source: Renaissance Capital estimates |
||||||
Figure 8: Potential impact of new sanctions on Russian macro |
|
|
|
|
|
|
|
|
|
|
|
||||||||||
Year |
|
|
|
|
|
|
|
|
|
2019E |
|
|
|
|
|
|
|
|
|
||
Brent oil, $/bl |
|
|
80 |
|
|
|
|
65 |
|
|
|
|
|
|
50 |
|
|
|
|
||
|
Base |
‘Soft’ |
|
‘Hard’ |
Base |
‘Soft’ |
|
‘Hard’ |
|
Base |
‘Soft’ |
‘Hard’ |
|||||||||
|
case Sanctions sanctions |
case Sanctions sanctions |
case |
Sanctions sanctions |
|||||||||||||||||
Real GDP growth |
1.5% |
0.8% |
|
-0.4% |
1.2% |
0.5% |
|
-0.8% |
|
0.6% |
|
0.1% |
|
-1.3% |
|||||||
RUB/$, annual avg |
63.9 |
66.4 |
|
|
|
70.2 |
66.3 |
70.8 |
|
75.7 |
|
71.1 |
|
76.6 |
|
84.0 |
|||||
Inflation, annual avg |
5.1% |
5.5% |
|
6.2% |
5.4% |
6.3% |
|
8.2% |
|
6.1% |
|
8.2% |
|
11.0% |
|||||||
Policy rate by year-end |
7.5% |
8.25% |
9.0% |
7.75% |
9.25% |
|
11.5% |
|
8.5% |
|
11.5% |
|
14.0% |
||||||||
|
|
|
|
|
|
|
|
|
|
|
|
|
|
|
|
|
|
|
|
||
Current account, $bn |
113 |
138 |
|
|
|
158 |
87 |
109 |
|
128 |
|
|
57 |
|
77 |
|
|
|
100 |
||
% of GDP |
6.6% |
10.1% |
|
8.3% |
5.4% |
7.1% |
|
8.9% |
|
3.9% |
|
5.6% |
|
7.9% |
|||||||
|
|
|
|
|
|
|
|
|
|
|
|
|
|
|
|
|
|
||||
External debt, $bn |
459 |
454 |
|
|
|
447 |
453 |
445 |
|
438 |
|
444 |
|
436 |
|
|
427 |
||||
% of GDP |
27% |
27% |
|
|
|
28% |
28% |
29% |
|
30% |
|
30% |
|
32% |
|
33% |
|||||
FX reserves, $bn |
572 |
564 |
|
|
|
550 |
544 |
531 |
|
522 |
|
514 |
|
507 |
|
|
502 |
||||
Months of imports cover |
25 |
26 |
|
|
|
26 |
26 |
27 |
|
27 |
|
|
27 |
|
28 |
|
|
|
30 |
||
|
|
|
|
|
|
|
|
|
|
|
|
|
|
|
|||||||
Budget balance, % of GDP |
3.4% |
3.7% |
4.2% |
2.0% |
2.4% |
|
3.0% |
|
0.5% |
|
1.0% |
|
1.6% |
||||||||
|
|
|
|
|
|
|
|
|
|
|
|
|
|
|
|||||||
GDP, RUBtrn |
110.1 |
110.1 |
110.3 |
107.3 |
108.1 |
|
109.2 |
|
103.5 |
|
105.3 |
|
107.1 |
||||||||
GDP, $bn |
1,723 |
1,659 |
|
1,572 |
1,618 |
1,526 |
|
1,443 |
|
1,456 |
|
1,375 |
|
1,274 |
|||||||
Source: Renaissance Capital estimates
3

vk.com/id446425943
Renaissance Capital
5 February 2019
Central Bank of Russia
Figure 9: Russia – key economic indicators
Ratings (M/S&P/F): Ba1/BBB-/BBB- |
EODB Rank: 31 (35) – Strong |
Corruption Rank: 135 (131) – Weak |
RenCap Legal score: 50 (56) – Middle |
|
|||||||||||||
|
2006 |
2007 |
2008 |
2009 |
2010 |
2011 |
2012 |
2013 |
2014 |
2015 |
2016 |
2017 |
2018E |
2019E |
2020E |
||
Activity |
|
|
|
|
|
|
|
|
|
|
|
|
|
|
|
|
|
Real GDP (% YoY) |
8.2 |
8.5 |
5.2 |
-7.8 |
4.5 |
4.3 |
3.5 |
1.3 |
0.7 |
-2.5 |
0.3 |
1.6 |
2.3 |
1.2 |
2.4 |
||
Private consumption (% YoY) |
|
12.2 |
14.3 |
10.6 |
-5.1 |
5.1 |
6.8 |
7.9 |
5.2 |
2.0 |
-9.4 |
-1.9 |
3.2 |
2.2 |
1.7 |
3.5 |
|
Government consumption (% YoY) |
2.3 |
2.7 |
3.4 |
-0.6 |
-1.5 |
1.4 |
2.6 |
0.9 |
-2.1 |
-3.1 |
1.4 |
2.5 |
0.9 |
0.4 |
0.4 |
||
Investment (% YoY) |
|
16.7 |
21.0 |
10.6 |
-14.4 |
5.9 |
9.1 |
5.0 |
1.3 |
-1.8 |
-11.2 |
0.7 |
5.5 |
2.3 |
1.5 |
3.6 |
|
Industrial production (% YoY) |
6.3 |
6.8 |
0.8 |
-9.2 |
8.3 |
4.8 |
2.5 |
0.3 |
1.7 |
-3.4 |
1.3 |
2.1 |
3.0 |
1.6 |
2.3 |
||
Unemployment rate (% YoY) |
|
7.2 |
6.1 |
6.3 |
8.4 |
7.5 |
6.6 |
5.5 |
5.6 |
5.3 |
5.9 |
5.3 |
5.1 |
4.9 |
4.8 |
4.9 |
|
Nominal GDP (RUBbn) |
26,917 |
33,248 |
41,277 |
38,807 |
46,309 60,283 68,164 73,134 79,200 |
83,101 |
86,010 |
92,089 102,245 107,303 112,552 |
|||||||||
Nominal GDP ($bn) |
|
990 |
1,299 |
1,658 |
1,224 |
1,523 |
2,050 |
2,199 |
2,293 |
2,052 |
1,353 |
1,285 |
1,579 |
1,628 |
1,618 |
1,643 |
|
Population (mn) |
142.8 |
142.8 |
142.7 |
142.9 |
142.9 |
143.0 |
143.3 |
143.3 |
143.7 |
146.8 |
147.1 |
147.4 |
147.7 |
147.9 |
148.1 |
||
GDP per capita ($) |
|
6,930 |
9,095 |
11,617 |
8,567 |
10,660 |
14,339 |
15,344 |
15,999 |
14,278 |
9,220 |
8,733 |
10,711 |
11,020 |
10,943 |
11,094 |
|
Gross domestic saving (% of GDP) |
29.0 |
29.3 |
28.8 |
19.4 |
24.4 |
29.2 |
27.8 |
24.6 |
25.0 |
26.8 |
25.9 |
26.5 |
27.3 |
27.8 |
27.3 |
||
Stock of bank credit to corp/ |
|
8,183 |
12,506 |
16,527 |
16,116 |
18,148 |
23,266 |
27,709 |
32,456 |
40,866 |
43,985 |
40,939 |
42,366 |
47,275 |
51,057 |
57,184 |
|
households (RUBbn) |
|
||||||||||||||||
|
|
|
|
|
|
|
|
|
|
|
|
|
|
|
|
||
Stock of bank credit to corp/ |
30.4 |
37.6 |
40.0 |
41.5 |
39.2 |
38.6 |
40.6 |
44.4 |
51.6 |
52.9 |
47.6 |
46.0 |
46.2 |
47.6 |
50.8 |
||
households (% of GDP) |
|||||||||||||||||
|
|
|
|
|
|
|
|
|
|
|
|
|
|
|
|
||
Deposits (RUBbn) |
|
8,340 |
11,890 |
14,749 |
17,131 |
21,081 |
26,082 |
30,120 |
34,931 |
43,814 |
51,907 |
50,003 |
53,703 |
60,147 |
65,561 |
72,117 |
|
Loan-to-deposit ratio |
98.1 |
105.2 |
112.1 |
94.1 |
86.1 |
89.2 |
92.0 |
92.9 |
93.3 |
84.7 |
81.9 |
78.9 |
78.6 |
77.9 |
79.3 |
||
|
|
|
|
|
|
|
|
|
|
|
|
|
|
|
|
|
|
Prices |
|
|
|
|
|
|
|
|
|
|
|
|
|
|
|
|
|
CPI (average % YoY) |
|
9.7 |
9.0 |
14.1 |
11.7 |
6.9 |
8.4 |
5.1 |
6.8 |
7.8 |
15.6 |
7.1 |
3.7 |
2.9 |
5.4 |
3.8 |
|
CPI (end-year % YoY) |
9.0 |
11.9 |
13.3 |
8.8 |
8.8 |
6.1 |
6.6 |
6.5 |
11.4 |
12.9 |
5.4 |
2.5 |
4.3 |
4.7 |
3.8 |
||
Nominal wages (monthly), RUB |
|
10,634 |
13,593 |
17,290 |
18,639 |
20,952 |
23,369 |
26,629 |
29,792 |
32,495 |
34,030 |
36,709 |
39,167 |
43,162 |
46,615 |
50,344 |
|
Wage rates (% YoY, nominal) |
24.3 |
27.8 |
27.2 |
7.8 |
12.4 |
11.5 |
14.0 |
11.9 |
9.1 |
4.7 |
7.9 |
6.7 |
10.2 |
8.0 |
8.0 |
||
|
|
|
|
|
|
|
|
|
|
|
|
|
|
|
|
|
|
Fiscal balance
Consolidated government balance (% of GDP)
Total public debt (% of GDP)
|
|
|
|
|
|
|
|
|
|
|
|
|
|
|
7.4 |
5.4 |
4.1 |
-5.9 |
-3.5 |
1.6 |
0.0 |
-0.8 |
-0.5 |
-2.6 |
-3.4 |
-1.4 |
2.0 |
2.0 |
0.8 |
|
|
|
|
|
|
|
|
|
|
|
|
|
|
|
11.1 |
9.1 |
7.8 |
11.1 |
11.7 |
11.0 |
9.9 |
13.0 |
14.8 |
15.7 |
16.5 |
15.5 |
14.2 |
15.2 |
16.1 |
|
|
|
|
|
|
|
|
|
|
|
|
|
|
|
|
|
|
|
|
|
|
|
|
|
|
|
|
|
|
|
|
External balance |
|
|
|
|
|
|
|
|
|
|
|
|
|
|
|
|
Exports ($bn) |
304.0 |
354.0 |
472.0 |
303.0 |
401.0 |
522.0 |
528.0 |
523.3 |
493.6 |
341.5 |
282.0 |
353.7 |
434.1 |
406.8 |
389.7 |
|
Imports ($bn) |
164.0 |
223.0 |
292.0 |
192.0 |
249.0 |
324.0 |
335.7 |
341.3 |
308.0 |
193.0 |
192.0 |
237.9 |
253.4 |
253.7 |
257.9 |
|
Trade balance ($bn) |
140.0 |
131.0 |
180.0 |
111.0 |
152.0 |
198.0 |
192.3 |
182.0 |
185.6 |
148.5 |
90.0 |
115.8 |
180.7 |
153.1 |
131.8 |
|
Trade balance (% of GDP) |
14.1 |
10.1 |
10.9 |
9.1 |
10.0 |
9.7 |
8.7 |
7.9 |
9.0 |
11.0 |
7.0 |
7.3 |
11.1 |
9.5 |
8.0 |
|
Current account balance ($bn) |
94.7 |
77.8 |
103.5 |
48.6 |
67.5 |
97.3 |
71.3 |
33.4 |
57.5 |
67.8 |
24.5 |
33.3 |
109.0 |
87.2 |
67.0 |
|
Current account balance (% of GDP) |
9.6 |
6.0 |
6.2 |
4.0 |
4.4 |
4.7 |
3.2 |
1.5 |
2.8 |
5.0 |
1.9 |
2.1 |
6.7 |
5.4 |
4.1 |
|
Gross FDI ($bn) |
37.6 |
55.9 |
74.8 |
36.6 |
43.2 |
55.1 |
50.6 |
69.2 |
22.0 |
6.9 |
32.5 |
28.6 |
15.0 |
12.0 |
12.0 |
|
Gross FDI (% of GDP) |
3.8 |
4.3 |
4.5 |
3.0 |
2.8 |
2.7 |
2.3 |
3.0 |
1.1 |
0.5 |
2.5 |
1.8 |
0.9 |
0.7 |
0.7 |
|
Current account balance plus FDI (% of |
13.4 |
10.3 |
10.8 |
7.0 |
7.3 |
7.4 |
5.5 |
4.5 |
3.9 |
5.5 |
4.4 |
3.9 |
7.6 |
6.1 |
4.8 |
|
GDP) |
||||||||||||||||
|
|
|
|
|
|
|
|
|
|
|
|
|
|
|
||
Exports (% YoY, value) |
24.6 |
16.4 |
33.3 |
-35.8 |
32.3 |
30.2 |
1.1 |
-0.9 |
-5.7 |
-30.8 |
-17.4 |
25.4 |
22.7 |
-6.3 |
-4.2 |
|
Imports (% YoY, value) |
31.2 |
36.0 |
30.9 |
-34.2 |
29.7 |
30.1 |
3.6 |
1.7 |
-9.8 |
-37.3 |
-0.5 |
23.9 |
6.5 |
0.1 |
1.7 |
|
Foreign exchange reserves ($bn) |
304 |
479 |
427 |
439 |
479 |
499 |
538 |
430 |
385 |
368 |
378 |
433 |
467 |
544 |
587 |
|
Import cover (months of merchandise imports) |
22.2 |
25.8 |
17.5 |
27.4 |
23.1 |
18.5 |
19.2 |
15.1 |
15.0 |
22.9 |
23.6 |
21.8 |
22.1 |
25.7 |
27.3 |
|
|
|
|
|
|
|
|
|
|
|
|
|
|
|
|
|
|
Debt indicators |
|
|
|
|
|
|
|
|
|
|
|
|
|
|
|
|
Gross external debt year-end ($bn) |
313 |
464 |
480 |
466 |
489 |
539 |
636 |
716 |
600 |
518 |
512 |
518 |
456 |
453 |
438 |
|
Gross external debt (% of GDP) |
32 |
36 |
29 |
38 |
32 |
26 |
29 |
31 |
29 |
38 |
40 |
33 |
28 |
28 |
27 |
|
Gross external debt (% of exports) |
103 |
131 |
102 |
154 |
122 |
103 |
121 |
137 |
122 |
152 |
181 |
146 |
105 |
111 |
112 |
|
Total debt service ($bn) |
109.1 |
171 |
167 |
154.4 |
158 |
177 |
205 |
230 |
179 |
128 |
134 |
137 |
140 |
135 |
131 |
|
Total debt service (% of GDP) |
11 |
13 |
10 |
13 |
10 |
9 |
9 |
10 |
9 |
9 |
10 |
9 |
9 |
8 |
8 |
|
Total debt service (% of exports) |
36 |
48 |
35 |
51 |
39 |
34 |
39 |
44 |
36 |
37 |
47 |
39 |
32 |
33 |
34 |
|
|
|
|
|
|
|
|
|
|
|
|
|
|
|
|
|
|
Interest & exchange rates |
|
|
|
|
|
|
|
|
|
|
|
|
|
|
|
|
Broad money supply (% YoY) |
48.7 |
43.5 |
0.8 |
17.7 |
31.1 |
22.3 |
11.9 |
14.6 |
2.2 |
11.4 |
9.2 |
9.5 |
10.5 |
8.5 |
11.0 |
|
Refinancing rate year-end (%) |
11.0 |
10.0 |
13.0 |
8.75 |
7.75 |
8.00 |
8.25 |
8.25 |
8.25 |
8.25 |
10.0 |
7.75 |
7.75 |
7.75 |
7.25 |
|
REPO rate year-end (%) |
6.5 |
6.5 |
9.5 |
6.0 |
5.0 |
5.25 |
5.50 |
5.50 |
17.0 |
11.0 |
10.0 |
7.75 |
7.75 |
7.75 |
7.25 |
|
Deposit rate year-end (%) |
2.3 |
2.8 |
7.25 |
4.0 |
3.0 |
4.00 |
4.25 |
4.50 |
16.0 |
10.0 |
9.0 |
6.75 |
6.75 |
6.75 |
6.25 |
|
3-month interest rate (MosPrime avg %) |
5.1 |
5.9 |
9.8 |
13.7 |
4.3 |
5.1 |
7.1 |
7.00 |
10.5 |
13.8 |
11.2 |
9.3 |
7.6 |
7.8 |
7.5 |
|
3-month rates minus $-LIBOR |
-0.1 |
0.6 |
6.8 |
13.0 |
4.0 |
4.8 |
6.7 |
6.8 |
10.3 |
13.5 |
10.4 |
8.0 |
5.3 |
4.8 |
4.4 |
|
Exchange rate (RUB/$) year-end |
26.3 |
24.5 |
29.4 |
30.2 |
30.5 |
32.1 |
30.5 |
32.7 |
56.2 |
72.9 |
61.5 |
57.7 |
69.4 |
68.0 |
70.0 |
|
Exchange rate (RUB/$) annual average |
27.2 |
25.6 |
24.9 |
31.7 |
30.4 |
29.4 |
31.0 |
31.9 |
38.6 |
61.4 |
67.0 |
58.3 |
62.8 |
66.3 |
68.5 |
|
Exchange rate (RUB/EUR) year-end |
34.7 |
35.9 |
42.7 |
43.3 |
40.8 |
41.7 |
40.3 |
44.9 |
68.4 |
79.6 |
64.7 |
69.3 |
79.5 |
81.6 |
86.8 |
|
Exchange rate (RUB/EUR) annual average |
34.1 |
35.0 |
36.5 |
44.1 |
40.3 |
40.9 |
39.9 |
42.4 |
50.9 |
68.1 |
74.1 |
65.9 |
74.0 |
78.2 |
83.6 |
Source: Rosstat, CBR, Finance Ministry, Federal Treasury, Bloomberg, IMF, World Bank, Renaissance Capital estimates
4