

9 11 2018 Consumer Update Smart Expansion
.pdfvk.com/id446425943 |
|
|
|
|
|
|
|
|
|
21 |
||||||
|
EQUITY RESEARCH |
CONSUMER AND RETAIL |
|
|
|
|
|
|
|
|
|
|
|
|
||
|
Figure 62: OKEY at a glance |
|
|
|
|
|
|
|
|
|
|
|
|
|
|
|
|
|
|
|
|
|
|
|
|
|
|
|
|
|
|
|
|
|
|
|
2015 |
|
2016 |
|
2017 |
|
|
2018E |
|
2019E |
|
|
2020E |
|
|
|
|
|
|
|
|
|
|
|
|
|
|
|
|
|
|
|
Revenue |
|
162 510 |
|
175 471 |
|
177 455 |
|
|
167 947 |
|
175 546 |
|
|
185 470 |
|
|
Gross profit |
38 367 |
|
40 209 |
40 444 |
|
38 628 |
40 375 |
|
42 658 |
|
|||||
|
|
|
|
|
|
|||||||||||
|
Operating profit (EBIT) |
|
5 848 |
|
3 394 |
|
7 590 |
|
|
3 284 |
|
3 817 |
|
|
4 562 |
|
|
EBITDA |
10 109 |
|
9 253 |
9 335 |
|
7 819 |
8 908 |
|
10 497 |
|
|||||
|
|
|
|
|
|
|||||||||||
|
EBITDA margin |
|
6,2% |
|
5,3% |
|
5,3% |
|
|
4.7% |
|
5.1% |
|
|
5.7% |
|
|
EBITDAR |
14 837 |
|
14 597 |
15 093 |
|
11 760 |
13 262 |
|
15 105 |
|
|||||
|
|
|
|
|
|
|||||||||||
|
Profit before income tax |
|
1 901 |
|
272 |
|
3 795 |
|
|
225 |
|
1 247 |
|
|
2 288 |
|
|
Profit for the period |
1 918 |
|
-138 |
3 167 |
|
171 |
948 |
|
1 739 |
|
|||||
|
|
|
|
|
|
|||||||||||
|
BALANCE SHEET, RUBmn |
|
2015 |
|
2016 |
|
2017 |
|
|
2018E |
|
2019E |
|
|
2020E |
|
|
Property, plant and equipment |
49 783 |
|
51 728 |
48 277 |
|
50 797 |
53 254 |
|
55 294 |
|
|||||
|
|
|
|
|
|
|||||||||||
|
Total non-current assets |
|
59 230 |
|
61 052 |
|
58 486 |
|
|
61 006 |
|
63 463 |
|
|
65 503 |
|
|
Inventories |
12 628 |
|
13 707 |
13 524 |
|
12 836 |
13 491 |
|
14 332 |
|
|||||
|
|
|
|
|
|
|||||||||||
|
Total current assets |
|
30 850 |
|
32 041 |
|
32 971 |
|
|
26 634 |
|
25 414 |
|
|
25 612 |
|
|
Total assets |
90 079 |
|
93 093 |
91 457 |
|
87 640 |
88 877 |
|
91 115 |
|
|||||
|
|
|
|
|
|
|
|
|
|
|
|
|||||
|
Total equity |
|
24 491 |
|
22 655 |
|
24 251 |
|
|
22 522 |
|
23 127 |
|
|
24 155 |
|
|
Long-term borrowings and loans |
23 558 |
|
31 673 |
24 679 |
|
20 977 |
18 880 |
|
16 992 |
|
|||||
|
|
|
|
|
|
|||||||||||
|
Total non-current liabilities |
|
24 484 |
|
32 504 |
|
25 690 |
|
|
21 938 |
|
19 879 |
|
|
18 040 |
|
|
Total current liabilities |
41 104 |
|
37 933 |
41 516 |
|
43 179 |
45 871 |
|
48 920 |
|
|||||
|
|
|
|
|
|
|
|
|
|
|
|
|||||
|
Total equity and liabilities |
|
90 079 |
|
93 093 |
|
91 457 |
|
|
87 640 |
|
88 877 |
|
|
91 115 |
|
|
Key data |
|
2015 |
|
2016 |
|
2017 |
|
|
2018E |
|
2019E |
|
|
2020E |
|
|
ROE |
7,9% |
|
-1,6% |
12,6% |
|
0.8% |
4.1% |
|
7.2% |
|
|||||
|
|
|
|
|
|
|
|
|
|
|
|
|||||
|
ROA |
|
2,2% |
|
-0,4% |
|
3,3% |
|
|
0.2% |
|
1.1% |
|
|
1.9% |
|
|
ROIC |
10,1% |
|
5,0% |
11,6% |
|
5.6% |
6.6% |
|
7.8% |
|
|||||
Source: Company data, ATON Research
Figure 63: O’KEY new vs old forecasts comparison vs consensus estimates
|
|
2018E |
|
|
2019E |
|
|
New |
Old |
% |
New |
Old |
% |
Revenue |
167 947 |
179 446 |
-6,4% |
175 546 |
181 170 |
-3,1% |
EBITDA |
7 819 |
10 578 |
-26,0% |
8 908 |
10 659 |
-16,4% |
|
|
|
|
|
|
|
Net Income |
171 |
666 |
n/a |
948 |
1 158 |
-18,1% |
|
ATON |
Cons |
% |
ATON |
Cons |
% |
Revenue |
167 947 |
178 362 |
-5,8% |
175 546 |
191 355 |
-8,3% |
EBITDA |
7 819 |
10 159 |
-23,0% |
8 908 |
10 159 |
-12,3% |
|
|
|
|
|
|
|
Net Income |
171 |
1 470 |
n/a |
948 |
2 090 |
n/a |
|
|
|
|
|
|
|
Source: ATON Research
© 2018 ATON LLC. All rights reserved
vk.com/id446425943 |
22 |
|
EQUITY RESEARCH |
CONSUMER AND RETAIL |
|
Target Price |
|
Target price per GDR (DCF),$ |
1,4 |
|
|
Target price per GDR (multiples),$ |
1,4 |
Average Target Price per GDR,$ |
1,4 |
|
|
Potential upside |
-10% |
|
|
Source: Company data, ATON Research
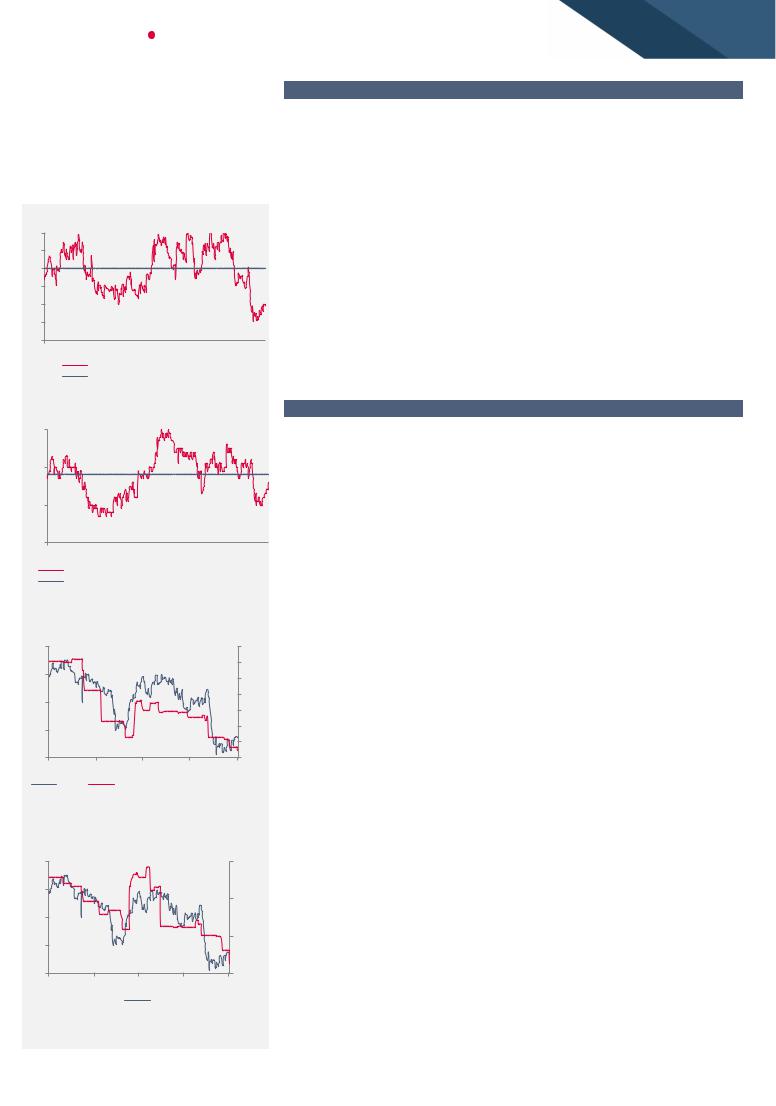
Figure 64: Fwd P/E OKEY LI
22
20
18
16
14
12
10 


 Oct-16 Mar-17 Aug-17 Jan-18 Jun-18
OKEY LI Equity Multiple (BF P/E) Multiple Average (2 Years)
Source: Bloomberg, ATON Research
Figure 65: Fwd EV/EBITDA OKEY LI
7
6
5
4 


 Oct-16 Mar-17 Aug-17 Jan-18 Jun-18
OKEY LI Equity Multiple (BF EV/EBITDA) Multiple Average (2 Years)
Source: Bloomberg, ATON Research
Figure 66: OKEY FY19E EPS estimates decreased 27% over 1 Yr
170 |
11 |
|
|
10,5 |
|
150 |
10 |
|
|
||
130 |
9,5 |
|
9 |
||
|
||
110 |
8,5 |
|
|
||
|
8 |
|
90 |
7,5 |
|
Nov-17 Feb-18 |
May-18 Aug-18 Nov-18 |
|
Price |
BEst Standard Revenue 2019 A |
Source: Company reports, ATON Research
Figure 67: OKEY FY19E EBITDA estimates were down 18% in 1 Yr
Valuation
12M target price. To evaluate OKEY we used a combination of DCF and multiples methods. Our combined valuation yields a 12-months target price of $1.4 price per GDR, which implies 10% downside to the CMP. Therefore, we reiterate our SELL rating for the stock.
Multiples valuation. When considering our multiples valuation, we used 12M forward EV/ EBITDA ratio of the global peers operating on emerging markets (12,9x) and used 55% discount to the target multiple. The market based valuation resulted in a target price of $1.4 per GDR, implying 11% downside to CMP.
O’KEY’s cost of capital was calculated using: 1) Russian corporate tax rate for retailers of 24%, 2) RFR offered on 10 years OFZ, 3) we assume debt premium of 5% and EMRP of 5%. Using the debt – to – equity ratio estimated in 2018 we derive the weighted average cost of company’s capital of 13,8%.
DCF. In order to calculate terminal value, we assume that after 2026 future cash flows will grow at a constant rate of 2,5%. Given our DCF model we came up with the target price of $1.4 per GDR which implies 10% downside.
Risks
Downside risks
Deceleration of economic growth in Russia: If the economic recovery takes longer than expected, all major retailers will be negatively affected.
Growing competition and more aggressive pricing and promotions.
Concentration only on the development of the discounter chain may result in insufficient attention being paid to the core hypermarket segment.
Execution risk. The new strategy announced maps out O’KEY’s turnaround over the course of several years. On our estimates, however, the pace and efficiency of the changes will depend a lot on excellent execution.
Upside risks
Discounters’ expansion: the compact format of hard discounters, well-known in Europe but new to the Russian market, has become more popular in recent years. The faster roll-out of DA! chain may support the Group’s financials.
Dividends. If the Group is indeed committed to paying dividends despite the share buyback, it may support the stock
170 |
13500 |
150 |
12500 |
|
|
130 |
|
110 |
11500 |
|
|
90 |
10500 |
Nov-17 |
Feb-18 May-18 Aug-18 Nov-18 |
Price
Source: Bloomberg, Company, ATON Research
© 2018 ATON LLC. All rights reserved

vk.com/id446425943 |
|
||
|
EQUITY RESEARCH |
CONSUMER AND RETAIL |
|
|
|
|
|
|
Multiples Valuation |
|
EV/EBITDA |
|
GEM peers, x |
|
12,9 |
|
Assumed premium/(discount) |
|
-55% |
|
OKEY's target multiples, x |
|
5,8 |
|
OKEY's 2018E-2019E EBITDA, RUBmn |
8 363 |
|
|
OKEY's implied EV, RUBmn |
|
48 549 |
|
OKEY's 2018E net debt, RUBmn |
|
24 235 |
|
OKEY's implied equity value, RUBmn |
24 314 |
|
|
Price per GDR, US$ |
|
1.4 |
|
Current Price |
|
1.6 |
|
Potential upside/ downside |
|
-11% |
Source: Bloomberg, Company data, ATON Research
23
WACC calculation |
|
|
|
Tax rate |
24,0% |
||
|
|||
Asset Beta |
|
1,0 |
|
Debt/Equity |
1,2 |
||
|
|||
Geared Beta |
|
1,9 |
|
Risk free rate |
8,5% |
||
|
|||
Debt premium |
|
5,0% |
|
Equity risk premium |
5,0% |
||
|
|||
Cost of equity |
|
17,9% |
|
Cost of debt (after tax) |
10,3% |
||
|
|||
WACC |
|
13,8% |
|
|
|
|
|
Source: Bloomberg, Company data, ATON Research
DCF valuation |
2018E |
2019E |
2020E |
2021E |
2022E |
2023E |
2024E |
2025E |
2026E |
EBIT |
3,284 |
3,817 |
4,562 |
4,930 |
5,786 |
5,427 |
6,234 |
6,189 |
5,887 |
Less taxation |
-54 |
-299 |
-549 |
-701 |
-963 |
-911 |
-1,136 |
-1,154 |
-1,108 |
|
|
|
|
|
|
|
|
|
|
Tax adjusted EBIT |
3,230 |
3,518 |
4,012 |
4,229 |
4,824 |
4,516 |
5,098 |
5,035 |
4,779 |
Depreciation and amortisation |
4,367 |
4,915 |
5,750 |
5,953 |
6,158 |
6,373 |
6,581 |
6,774 |
6,885 |
|
|
|
|
|
|
|
|
|
|
Less CAPEX |
-6,886 |
-7,373 |
-7,790 |
-8,065 |
-8,342 |
-8,635 |
-8,916 |
-9,178 |
-9,328 |
Change in working capital |
8,604 |
1,488 |
2,250 |
2,926 |
3,288 |
3,639 |
4,113 |
4,656 |
5,497 |
|
|
|
|
|
|
|
|
|
|
Unlevered free cash flow |
9,315 |
2,548 |
4,222 |
5,043 |
5,927 |
5,893 |
6,876 |
7,287 |
7,833 |
WACC |
13,8% |
|
|
|
|
|
|
|
|
|
|
|
|
|
|
|
|
|
|
Discounted free cash flow |
9,139 |
2,197 |
3,199 |
3,358 |
3,467 |
3,030 |
3,106 |
2,893 |
2,732 |
Future cash flow growth rate |
2.5% |
|
|
|
|
|
|
|
|
|
|
|
|
|
|
|
|
|
|
Terminal value |
71,053 |
|
|
|
|
|
|
|
|
Discounted terminal value |
24,784 |
|
|
|
|
|
|
|
|
|
|
|
|
|
|
|
|
|
|
PV of 2026E enterprise value |
48,765 |
|
|
|
|
|
|
|
|
Net debt |
24,235 |
|
|
|
|
|
|
|
|
|
|
|
|
|
|
|
|
|
|
Fair equity value |
24,530 |
|
|
|
|
|
|
|
|
Number of GDRs, mn |
269 |
|
|
|
|
|
|
|
|
|
|
|
|
|
|
|
|
|
|
Price target, $ per GDR |
1.4 |
|
|
|
|
|
|
|
|
Potential upside |
-10% |
|
|
|
|
|
|
|
|
© 2018 ATON LLC. All rights reserved

vk.com/id446425943
Disclosures Appendix
This investment research has been prepared by ATON LLC, regulated by the Central Bank of the Russian Federation. The investment research is not for distribution to the public or a large number of persons, and it is not an advertisement to an unlimited group of persons, of securities, or related financial instruments, but it is personal to named recipients. All recipients are persons who have professional experience in matters relating to investments or high net worth entities, and other persons to whom it may otherwise lawfully be communicated (all such persons together being referred to as “named recipients”). This investment research must not be acted on or relied on by persons who are not named recipients. Any investment or investment activity to which this research relates is only available to named recipients and might be engaged in only with named recipients.
The securities described in the investment research may not be eligible for sale in all jurisdictions or to certain categories of investors. Options, derivative products and futures are not suitable for all investors and trading in these instruments is considered risky. Past performance is not necessarily indicative of future results. The value of investments may fall as well as rise and the investor may not get back the amount initially invested. Some investments may not be readily realisable because the market in the securities is illiquid or there is no secondary market for the investor’s interest and therefore valuing the investment and identifying the risk to which the investor is exposed may be difficult to quantify. Investments in illiquid securities involve a high degree of risk and are suitable only for sophisticated investors who can tolerate such risk and do not require an investment easily and quickly converted into cash. Foreign-currency denominated securities are subject to fluctuations in exchange rates that could have an adverse effect on the value or the price of, or income derived from, the investment. Other risk factors affecting the price, value or income of an investment include but are not necessarily limited to political risks, economic risks, credit risks, and market risks. Investing in emerging markets such as Russia, other CIS and other emerging markets involves a high degree of risk and investors should perform their own due diligence before investing.
This document has been prepared in accordance with legal requirements designed to promote the independence of investment research. This investment research is not subject to any prohibition on dealing ahead of the dissemination of investment research. It has been prepared with all reasonable care and is not knowingly misleading in whole or in part.
The information in this investment research does not constitute an offer, solicitation or recommendation for the purchase or sale of any securities or other financial instruments nor does it constitute advice, a personal recommendation or otherwise, or an expression of our view as to whether a particular security or financial instrument is suitable or appropriate for you and meets your financial or any other objectives. This information is not based on the particular circumstances of any named recipient.
The information herein was obtained from various publicly available news sources which we consider to be reliable but its accuracy and completeness cannot be guaranteed. It is not intended to be a comprehensive summary of newsworthy financial or business events and it may not be relied upon as such. The information and views given herein are subject to change without notice to the recipients.
All the materials are not intended for access by retail investors and private clients outside of the Russian Federation. Any investment or investment activity to which this material relates is not available to retail and private clients and will be engaged in only with persons other than retail and private clients.
The publication and distribution of the information about securities in some jurisdictions may be restricted by law. Unless otherwise stated, this material is intended only for persons who are eligible recipients of the material in the jurisdiction, in which the recipient of the material is located or belongs to. Disregarding these restrictions may be regarded as a law violation within corresponding jurisdictions of securities. None of these materials are intended for access and distribution in Australia, Canada or Japan.
Russian Federation: Distributed in the Russian Federation by ATON LLC, regulated by the Central Bank of the Russian Federation. EU: Distributed in the EU by Atonline Limited regulated by the Cyprus Securities and Exchange Commission (Licence No: 104/09).
The application of tax regulations depends on an investor’s individual circumstances and, accordingly, each investor should apply for independent professional advice on taxation implications before making any investment decision.
Analyst certification
This investment research (“the research”) has been prepared by the analyst(s) of ATON LLC, whose name(s) appear(s) on the front page of the research. Each analyst certifies that with respect to the company and such securities and markets, all of the views expressed in the research accurately reflect his or her personal views about the company and any and all of such securities and markets. Each analyst and/or persons connected with any analyst may have interacted with sales and trading personnel, or similar, for the purpose of gathering, synthesising and interpreting market information.
Any ratings, forecasts, estimates, opinions or views in the research constitute a judgment as at the date of the research. If the date of the research is not current, the views and contents may not reflect the analysts’ current thinking. The research has been produced independently of the company and any ratings, forecasts, estimates and opinions reflect only the analysts’ personal views. While all reasonable care has been taken to ensure that the facts stated therein are accurate and that the forecasts, estimates, opinions and views contained therein are fair and reasonable, neither the analysts, the company, nor any of its directors, officers or employees, have verified the contents thereof unless disclosed otherwise below. Accordingly, neither the analysts, the company, nor any of its directors, officers or employees, shall be in any way responsible for the contents thereof, and no reliance should be placed on the accuracy, fairness or completeness of the information contained in the research.
Neither the analysts, the company, nor any of its directors, officers or employees, accept any liability whatsoever for any loss howsoever arising from any use of the research or its contents or otherwise arising in connection therewith. Each analyst and/or persons connected with any of them may have acted upon or used the information herein contained, or the data or analysis on which it is based, before its publication. This research may not be relied upon by any of its recipients or any other person in making investment decisions with respect to the company’s securities. The research does not constitute a valuation of the company’s business, assets or securities for the purposes of the legislation on valuation activities for the company’s country. No part of his or her compensation was, or will be, directly or indirectly related to the specific ratings, forecasts, estimates, opinions or views in the research. Analysts’ compensation is determined based upon activities and services intended to benefit investor clients. Like all of ATON LLC employees, analysts receive compensation that is impacted by overall ATON LLC profitability, which includes revenues from other business units within ATON LLC.
Each analyst or his or her affiliated company or other persons is or may be a member of an underwriting group in respect of a proposed offering of the securities of the company. Each analyst may in the future participate in an offering of the company’s securities.
Investment ratings
Investment ratings are a function of ATON LLC expectations of total return on equity (forecast price appreciation and dividend yield within the next 12 months, unless stated otherwise in the research).
The investment ratings may be determined by the following standard ranges: Buy (expected total return of 15% or more);
Hold (expected total return of 0-15%); Sell (expected negative total return).
Standard ranges do not always apply to emerging market securities and ratings may be assigned on the basis of the analyst’s knowledge of the securities. Investment ratings are determined at the time of initiation of coverage of a company of equity securities, or a change in target price of any of the company’s equity securities. At other times, the expected total returns may fall outside of the range used at the time of setting a rating because of price movement and/or volatility. Such interim deviations will be permitted but will be subject to review by Research Department Management. It may be necessary to temporarily place the investment rating “Under Review” during which period the previously stated investment rating may no longer reflect the analysts’ current thinking.
For companies where ATON LLC has not expressed a commitment to provide continuous coverage, to keep you informed, analysts may prepare research covering significant events or background information without an investment rating. Your decision to buy or sell a security should be based upon your personal investment objectives and should be made only after evaluating the security’s expected performance and risk.
Disclaimer
© 2018 All rights reserved
ATON LLC, regulated by the Central Bank of the Russian Federation
ATONLINE LIMITED, regulated by the Cyprus Securities and Exchange Commission (Licence No: CIF 104/09)