

Amundi_AM_Cross_Asset_Invt_Strategy
.pdfvk.com/id446425943
CROSS ASSET |
November 2018 |
#11 |
|
||
|
|
|
INVESTMENT STRATEGY |
2019 Outlook Special Issue |
2 - EPS: revisions and momentum
Profit cycle paves the way for risky assets to lift. As we do not expect multiples (i.e. price/earnings ratio) to expand as was the case during the asset reflation regime (2012H2 - 2018H1), we believe the equity markets will eventually have to move on fundamentals. We can also expect higher volatility related to trade tensions and technical factors (i.e. systematic trading, unwinding of risk positions) that could exacerbate asset price movements. We expect negative revisions and some slowdown in EPS momentum to occur concurrently with a late financial cycle regime. At the time of writing, EPS revisions had already turned negative everywhere except the US due to trade and currency tensions. We will continue to monitor EPS revisions and top line guidance to capture how the corporate sector prices in higher tariffs and likely higher unit labour costs (another variable worth monitoring).
This will be particularly relevant for the US. Having said that, while we see a slowdown in global EPS growth in line with a late cycle, we maintain a constructive expectation at almost a 10% global EPS forecast for 2019. We are conscious that risks are on the downside as trade and currency conflicts raise material costs, which will likely crimp profit margins. In the remainder of this year, we might observe a temporary rebound in Europe (where the issues remain primarily political) and possibly in the EM, if trade tensions fade away. However, the convergence of profits is unlikely to lead to marked geographical recommendations in 2019.
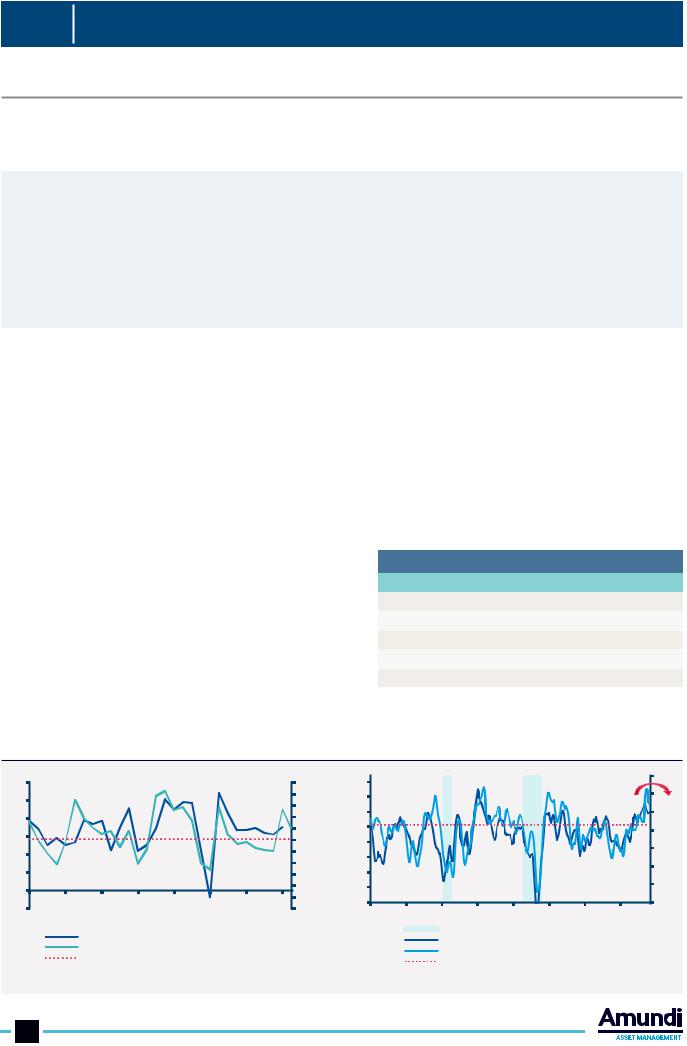
3 - Risk-adjusted valuations
Focus on earnings yield/Moody’s spread BAA – AAA indicator. Credit spreads are a function of leverage and maturity or funding mismatch. As such, a spread widening is symptomatic of financial vulnerabilities building up. Within this framework, we believe the Moody’s spread BAA – AAA is a good anticipator of a risky asset downturn. In this regard we have not yet reached a tipping point, but since March we have been progressively moving towards its alert threshold (=100). At the same time, we compare the Moody’s spread (or its proxy for regions other than the USA) to the earnings yields. This valuation gap is risk-adjusted to discount the equity market, implicitly considering corporate leverage (high), implied volatilities (on the rise) and default rates (historically low).
To sum up, our sentinels have not reached the tipping point yet, but we are not far from it. In our view, the best strategy is to stick to a modest overweight to equities, but start rotating portfolios towards a more granular allocation on both defensive sectors and quality stocks, to increase portfolios resilience. In the second half of the 2019, when we expect the US profit cycle to slow, we could also expect further adjustments, to reduce the overall risk of portfolios.
1/ Trade-weighted US dollar index vs S&P500 |
|
2/ Earnings yield/ Moody’s spread vs S&P500 |
|
|||||||||||||||||||||
|
60% |
|
|
|
|
|
|
|
|
-15% |
|
3500 |
|
|
|
|
|
|
|
|
|
12 |
|
|
|
40% |
|
|
|
|
|
|
|
|
-10% |
|
3000 |
|
|
|
|
|
|
|
|
|
10 |
|
|
|
|
|
|
|
|
|
|
|
|
|
|
|
|
|
|
|
|
|
|
|
|
|
||
changeYoYS&P |
20% |
|
|
|
|
|
put |
|
|
-5% |
changeTW$ |
S&P |
2500 |
|
|
|
|
|
|
|
|
|
8 |
AAA)-EY/(BAA |
|
|
|
|
|
|
|
|
1000 |
|
|
|
|
|
|
|
|
|
|||||||
|
|
|
|
|
|
|
|
|
|
|
|
|
|
|
|
|
|
|
|
|
|
|
||
|
0% |
|
|
|
|
|
|
|
|
0% |
|
|
2000 |
|
|
|
|
|
|
|
|
|
|
|
|
|
HT bubble |
|
|
|
|
|
5% |
|
|
|
|
|
|
|
|
|
|
|
|
6 |
|
||
|
|
|
|
|
|
|
|
|
|
1500 |
|
|
|
|
|
|
|
|
|
|
||||
|
|
|
& Enron |
|
|
|
|
|
|
|
|
|
|
|
|
|
|
|
|
|
|
|||
|
-20% |
|
|
|
|
|
|
|
|
|
|
|
|
|
|
|
|
|
|
|
|
|||
|
|
|
|
|
|
FED |
|
|
10% |
|
|
|
|
|
|
|
|
|
|
|
|
4 |
|
|
|
|
|
|
|
|
|
|
|
|
|
|
|
|
|
|
|
|
|
|
|
|
|||
|
|
|
|
|
|
|
|
|
|
|
|
|
|
|
|
|
|
|
|
|
|
|
|
|
|
-40% |
|
|
|
|
|
|
|
|
15% |
|
|
500 |
|
|
|
|
|
|
|
|
|
2 |
|
|
|
|
|
|
|
|
|
Q2 reporting |
|
|
|
|
|
|
|
|
|
|
|
|
||||
|
|
|
|
|
|
|
|
|
|
|
|
|
|
|
|
|
|
|
|
|
||||
|
|
|
|
|
|
|
|
|
|
|
|
|
|
|
|
|
|
|
|
|
|
|||
|
-60% |
|
|
|
|
|
|
season |
20% |
|
|
|
|
|
|
|
|
|
|
|
|
|
|
|
|
1999 |
2001 |
2003 |
2005 |
2007 |
2009 |
2011 |
2013 |
2015 |
2017 |
|
|
0 |
|
|
|
|
|
|
|
|
|
0 |
|
|
|
|
1998 |
2000 |
2002 |
2004 |
2006 |
2008 |
2010 |
2012 |
2014 |
2016 |
2018 |
|
||||||||||
TW$ Broad (rhs rev. Order) |
S&P500 YoY (lhs) |
S&P500 |
Earning Yield/spread BAA-AAA |
Threshold |
Source: Amundi Research, Bloomberg. Data as of 15 October 2018
Document for the exclusive attention of professional clients, investment services providers and any other professional of the financial industry 11

vk.com/id446425943
#11 |
November 2018 |
CROSS ASSET |
|
|
|||
|
|
|
|
|
2019 Outlook Special Issue |
INVESTMENT STRATEGY |
|
MULTI-ASSET
Markets at a crossroads! Be cautious and focus on quality
The essential
With the cycle ageing further in 2019, markets will become more volatile and remain vulnerable to tightening financial conditions. Investors will have to reassess their performance expectations, as risk-adjusted returns should be lower. On one hand, investors will have to look to grasp opportunities that markets, especially on the equity side, offer in this phase, while at the same time being prepared for possible signs of deterioration in the market environment, especially in the second part of the year.
The economic and financial markets landscape will change in 2019 and the late phase of the cycle will pose multiple challenges. At the macroeconomic level, the global expansion is due to continue, but it will be challenged by higher uncertainty compared with months ago as downside risks have increased. Economic growth should decelerate, but remain above potential in 2019. Inflation dynamics remain skewed to the upside due to higher energy prices and the increasing pressure on wages and compensations. The gobal profit cycle is reaching the peak in some regions such as Japan and the US, as normally happens in a mature phase of the financial cycle, and the inflection point should materialise in H1 19. Profits expectations are more vulnerable as tighter economic and financial conditions could worsen the EPS growth outlook, which though already decelerating remains benign (US EPS growth forecast at +10% in 2019). Key variables for the next reporting seasons will be more in the financial camp: interest rates, credit spreads and dollar dynamics, confirming that financial more than economic conditions will be under watch in 2019. All in all, current indicators, both economic and fundamental, are now more in line with the historical last cycle reference values.
2019: expect lower risk-adjusted returns in a world of stretched valuations and higher volatility
This transition to the next phase of the mature financial cycle will provide an even more challenging environment compared with 2018 in terms of portfolio diversification and risk-adjusted returns. Low carry and low rates in Europe depress the returns potential for conservative Euro based allocations, while current price levels in risky assets already incorporate most profit and economic growth expectations, limiting the possible upside. In general, we expect volatility to remain moderately high and subject to possible episodes of volatility spikes, in line with the trend initiated in 2018. Historically, the mature phase of a financial cycle indicates a turning point regime that is vulnerable to financial conditions, and it usually ends with a bifurcation in two opposite potential outcomes: market correction or market revamp. This time the risk is markedly skewed to the downside, with unprecedented issues, high debt and liquidity and geopolitical tensions. In addition, in absolute terms, valuations on fixed income and equity are stretched, on average. Actual levels, despite the recent correction in equities and higher interest rates, do not provide much value.
Interest rates are expected to move slightly higher while credit spreads should widen; on the other side EPS growth expectations are already partially priced in to the actual levels, meaning a further multiples derating is
1/ Expect a lower efficient frontier
Expected Return
16% |
|
|
|
|
|
|
|
The chart compares two efficient frontiers and |
|
|
|
|
|
|
|
||
|
|
|
|
|
|
|
|
|
14% |
|
|
|
|
|
|
|
plots the risk and total return profiles of 200 |
12% |
|
|
|
|
|
|
|
efficient cross asset portfolios (with different |
|
|
|
|
|
|
|
allocations optimised by volatility levels) for each |
|
|
|
|
|
|
|
|
|
|
10% |
|
|
|
|
|
|
|
frontier. The Standard Late Cycle frontier is |
8% |
|
|
|
|
|
|
|
calculated on historical average yearly returns |
|
|
|
|
|
|
|
and a covariance matrix during the Late Cycle |
|
6% |
|
|
|
|
|
|
|
regime. The Current Late Cycle frontier is |
|
|
|
|
|
|
|
calculated taking into account current bond and |
|
4% |
|
|
|
|
|
|
|
|
|
|
|
|
|
|
|
dividend yields. Asset class universe (local |
|
2% |
|
|
|
|
|
|
|
currency): US equities total return (S&P 500), US |
|
|
|
|
|
|
|
and Euro govies (JPM), US and Euro IG (ML), US |
|
|
|
|
|
|
|
|
|
|
0% |
|
|
|
|
|
|
|
and Euro HY (ML), GEM bond (JPM), US IL all |
|
|
|
|
|
|
|
||
2% |
4% |
6% |
8% |
10% |
12% |
14% |
maturities (Barclays). |
|
|
|
|
|
||
|
Expected Volatility |
Source: Amundi Research, Bloomberg. |
|||
Standard Late Cycle |
Current Late Cycle |
||||
Data as of 15 October 2018. |
|||||
12 Document for the exclusive attention of professional clients, investment services providers and any other professional of the financial industry

vk.com/id446425943
CROSS ASSET |
November 2018 |
#11 |
|
||
|
|
|
INVESTMENT STRATEGY |
2019 Outlook Special Issue |
likely. From a cross asset perspective, US long-term interest rates above 3% imply the best valuations in relative terms for governments bonds since 2009, which is starting to shift the pendulum marginally from equities to government bonds. Credit is overall less appealing compared with other asset classes, as valuations are tight in IG and HY credit, with some evidence of a outlook deterioration due to tighter financial conditions. Yet in Eurobased assets, carry is still in favour of high quality credit vs govies, thought at a lesser extent than the past six years of asset reflation. Moving on, assessing the liquidity of each asset class will become increasingly relevant, as markets become vulnerable to changes in market sentiment. In this respect, investor positioning and flows will be the key tactical factors to watch. The recent correction cleared some areas of market excess in risky assets and positioning is now less heavy than months ago.
Seeking opportunities in five main investment themes
No matter the shift or turning point that will materialise, the main themes that investors could exploit in 2019 will be:
In a late cycle, equities should remain favourite versus credit. With low return
1Enjoy the last race of risk potential ahead, be careful not to exit from the equity market too early. Focus assets, but check the exit on selection and tactical oppportunities and be ready to readjust risks. US still
|
|
preferred. |
|
2 |
Play central banks’ |
Seek relative value opportunities across curves and movements in currencies to |
|
benefit from the different speeds of central banks’ actions. Add duration (in the |
|||
recalibrations in bonds |
|||
|
|
US) in the fixed income component. |
|
3 |
Be aware of the inflation |
Upward inflation pressure remains a theme on the radar that cross asset |
|
investors could play, detecting tactical opportunities in inflation linked bonds, |
|||
|
conundrum |
commodities and equities. |
|
|
|
||
|
Take advantage of EM |
While EM are, on average, less vulnerable than in the past, specific dynamics |
|
4 |
and market structures are key to detecting the most valuable stories. As for the |
||
|
dynamics |
overall GEM market, we still see some challenges and we believe investors should |
|
|
|
play relative value stories (i.e. China). |
|
5 |
Focus on debt dynamics to |
Debt dynamics will be, in our view, the major catalyst for possible financial |
|
select investment ideas |
condition deterioration. Playing sustainable debt stories will be key in all asset |
||
|
|
classes. |
Recalibrate risk allocation as the cycle ages and focus on debt dynamics
A cautious approach to risk allocation will be vital in 2019. Investors on one side will have to seek to grasp opportunities that markets, especially equities, could offer, while at the same time being prepared for possible signs of deterioration in the market environment, especially in the second part of the year. Despite this challenging world with many dilemmas about inflation, trade wars, interest rates, currencies, etc., we believe that a cross asset strategy focused on avoiding areas of excessive debt (public, private and corporate) is a win-win position at this juncture no matter the outcome of the bifurcation; the high bad quality debt asset class will suffer and will be challenged dramatically going forward.
As a consequence, the areas of focus of the cross asset allocation for 2019 will be:
•Keep a diversified risk exposure and a structural hedge against tail risks;
•Look dynamically at potential triggers for a shift to a slowdown phase calling for a defensive allocation;
•A special focus on debt quality at cross asset level, combining low beta/defensive allocation and debt considerations, because it is not necessarily the case that the historically defensive asset classes are the least risky in terms of debt quality this time.
Document for the exclusive attention of professional clients, investment services providers and any other professional of the financial industry 13
vk.com/id446425943
#11 |
November 2018 |
CROSS ASSET |
|
|
|||
|
|
|
|
|
2019 Outlook Special Issue |
INVESTMENT STRATEGY |
|
EQUITY DEVELOPED MARKETS
Sustainability of earnings under watch in a tactical year
The essential
Economic growth has hit its peak and the abundance of liquidity is now set to diminish. This environment will lead to a slowdown in profit growth, although it will remain on the positive side, and put pressure on price to earnings ratios (P/E), beyond likely rebounds. Caution is the watchword in this type of landscape, lending support to a gradual rotation towards more defensive sectors. At the regional level, profit convergence still does not lead us to take strong views; the US market remains favoured, although some temporary rebounds can be expected in other markets. The selection of stocks able to deliver sustainable earnings per share growth and meet market expectations will be key, as in a late cycle markets tend to be tilted more towards punishing weak performances rather than rewarding strong ones.
The cycle has reached its climax. How long will this transition phase last?
In 2017, growth was robust and synchronised (positive for equities). In 2018, it was robust and unsynchronised (higher volatility). In 2019, it will still be strong, but is poised to slow from the peak (cautiousness required). A global growth above 3% should be sufficiently high to warrant, for example, positive profit growth in Europe (see below chart). The combination of monetary policy tightening around the world and the economic deceleration, however, could be an headwind for equities, buoyed for the last 10 years by plentiful liquidity, especially considering the Fed is not very far from its neutral rate after a series of eight rate hikes. This makes the markets sensitive to risks. Many of these risks were highlighted in 2018 (protectionism, some vulnerability in emerging markets, Italian fiscal policy, Brexit, Iran) and have been partially priced in. Though it pays to be cautious, it is also important to remember that a temporary respite from these risks could trigger sharp rebounds on the equity markets. A global diversified approach with the ability to tactically recalibrate regional, sector and style allocations will be key to benefiting from these moves.
Low returns for equities on the horizon
Limited returns are on the cards for 2019. Excluding dividends, the return on an equity investment depends on two factors: profit growth and change in P/E ratios, both of which are looking shaky for 2019. Profit growth should return to normal in the wake of two years of sharp gains (+17% and +16% for the MSCI ACWI, according to the IBES consensus on 2017 and 2018, respectively). Margins have already rebounded across all regions of the globe. They are currently close to their cyclical peak amid rises in wage costs and oil prices, as well as the risk of breaks in the supply chain with protectionism on the rise. With economic growth having already peaked, profit revisions
IBES consensus forecasts on 2019 EPS growth
World |
+9.8% |
US |
+10.6% |
Eurozone |
+9.9% |
UK |
+7.7% |
Japan |
+4.4% |
Pacific excl. Japan |
+5.4% |
Data as of 15 October 2018 on MSCI indices.
1/ Global GDP and European profits (annual %) 2/ ISM and profit revisions in the US
6 |
|
|
|
|
|
|
50 |
73 |
|
|
|
|
|
|
55 |
|
|
|
|
|
|
|
|
|
|
|
|
|
|
||||
5 |
|
|
|
|
|
|
40 |
68 |
|
|
|
|
|
|
|
|
|
|
|
|
|
|
30 |
63 |
|
|
|
|
|
|
15 |
||
|
|
|
|
|
|
|
|
|
|
|
|
|
||||
4 |
|
|
|
|
|
|
20 |
|
|
|
|
|
|
|||
|
|
|
|
|
|
58 |
|
|
|
|
|
|
|
|||
3 |
|
|
|
|
|
|
10 |
|
|
|
|
|
|
-5 |
||
|
|
|
|
|
|
0 |
53 |
|
|
|
|
|
|
-25 |
||
2 |
|
|
|
|
|
|
-10 |
48 |
|
|
|
|
|
|
||
|
|
|
|
|
|
|
|
|
|
|
|
-45 |
||||
1 |
|
|
|
|
|
|
-20 |
43 |
|
|
|
|
|
|
||
|
|
|
|
|
|
-30 |
|
|
|
|
|
|
-65 |
|||
0 |
|
|
|
|
|
|
-40 |
38 |
|
|
|
|
|
|
||
|
|
|
|
|
|
-50 |
33 |
|
|
|
|
|
|
-85 |
||
|
|
|
|
|
|
|
|
|
|
|
|
|
||||
-1 |
|
|
|
|
|
|
-60 |
|
|
|
|
|
|
|||
|
|
|
|
|
|
1995 |
1998 |
2001 |
2004 |
2007 |
2010 |
2013 |
2016 |
|||
1990 |
1994 |
1998 |
2002 |
2006 |
2010 |
2014 |
2018 |
|||||||||
|
|
Recession |
|
|
|
|
||||||||||
|
|
World Real GDP (YoY, %) |
|
|
|
|
|
|
|
|
||||||
|
|
|
|
|
|
ISM Manufacturing New Order ( LH) |
||||||||||
|
|
MSCI Europe EPS growth YoY (RH Scale) |
|
|
S&P500: EPS Net Up (3M MAV) (RH) |
|||||||||||
|
|
EPS breakeven (RH) |
|
|
|
|
|
Net up breakeven (RH) |
|
|
||||||
Source: Datastream, Amundi Research |
Source: Datastream, Amundi Research |
Data as of 19/10/2018 |
Data as of 19/10/2018 |
14 Document for the exclusive attention of professional clients, investment services providers and any other professional of the financial industry

vk.com/id446425943
CROSS ASSET |
November 2018 |
#11 |
|
||
|
|
|
INVESTMENT STRATEGY |
2019 Outlook Special Issue |
are likely to slide (see the right hand chart) from current IBES consensus forecasts for 2019 (see table). EPS growth should nevertheless stay positive and somewhat higher in the US than elsewhere. Meanwhile, US P/E ratios have probably already hit their cyclical peak in 2018. Historically speaking, P/E ratios tend to decline towards the end of a monetary tightening cycle. A rebound is possible if risks ease up, but is unlikely to last as central banks further tighten their monetary policies, starting with the Fed. US investors should become more selective if multiples were nevertheless to increase further as sometimes happens at the end of the cycle, as this could eventually lead to bubbles. Otherwise, temporary P/E rebounds may be more pronounced outside the US, depending on how risk perception evolves.
Gradually more defensive rotation
Signals are still scrambled, but we think that the right move to make throughout the year is to gradually increase the proportion of defensive assets to pro-cyclical assets, potentially taking advantage of these counter-trend rebounds to gradually implement this view. The alarm was raised in 2018, with volatility making a comeback two years after the first Fed rate hike, margins hitting a ceiling in the US and credit spreads bottoming out.
There are two additional factors that traditionally point to a more defensive rotation:
•The “interest rate” factor. Mainly influenced by the US, it is still neutral to pro-cyclical at this point. Usually rising interest rates are more in favour of cyclicals, while defensives are often negatively impacted due to higher dividend yields and/or indebtedness. In light of the current fiscal boost in the US, the Fed is unlikely to stop hiking its rates before the end of H1 2019.
•The “industrial commodities” factor. Significantly influenced by China since the 2000s, this factor switched into cautious mode in summer 2018. It primarily reflects the negative impact of rising protectionism on global trade. We admit that if China’s economic stimulus — particularly in terms of infrastructure — becomes visible, this risk will temporarily recede, further supporting the argument of a merely gradual rotation towards more defensive assets.
At regional level, the convergence of profit growth between regions argues for keeping a well-diversified approach against making major regional bets. Cyclical conditions call for a cautious approach and play in favour of the US market, where further deployment of capex by corporations could also support the positive trend (but in the short term, the consolidation of growth stocks bears watching). We should also expect some short-term counter-trends in favour of the cheapest regional markets (Eurozone, Japan and EM), potentially triggered by some relief in risk sentiment, and these movements may also be strong. All in all, we think that a focus on quality names that are not excessively priced will be key to navigating the more volatile market environment.
|
|
|
|
|
|
|
|
|
|
|
|
REGIONS: TRENDS VS COUNTER-TRENDS |
|
|
|
|
|
|
|
|
|
|
||||||||||||||||||
US |
|
|
|
|
|
|
|
EMU |
|
|
|
|
|
|
|
UK |
|
|
|
|
|
|
|
JAPAN |
|
|
|
Pacific ex JP |
|
|
||||||||||
The US market is the |
The |
Eurozone |
|
is |
a |
The UK market is a |
The |
political situation |
Australia makes up 57% |
|||||||||||||||||||||||||||||||
big winner of the cycle |
candidate |
to |
benefit |
proxy |
|
for |
the |
energy |
in Japan is clearer than |
of the region and Hong |
||||||||||||||||||||||||||||||
that |
started |
in |
2009. |
from |
|
a |
growth/value |
sector |
relative |
to |
the |
in |
Europe. |
Corporate |
Kong |
29%. |
Hence, |
it |
||||||||||||||||||||||
The divergence in terms |
correction. |
|
Otherwise, |
industrial sector. |
|
|
governance |
|
|
has |
is highly |
affected |
by |
|||||||||||||||||||||||||||
of |
performance |
with |
profits |
|
are |
sensitive |
As a result, it was able |
improved a lot, but the |
China’s |
policy |
and |
its |
||||||||||||||||||||||||||||
other markets, however, |
to |
|
EM |
|
currency |
to hold its own in 2018 |
profit cycle is one of |
impact |
on |
industrial |
||||||||||||||||||||||||||||||
ended |
up |
triggering |
fluctuations, |
so |
|
the |
while the looming Brexit |
the |
most mature, |
and |
commodity |
|
prices |
|||||||||||||||||||||||||||
a consolidation |
of |
the |
region |
would |
benefit |
deadline kept the GBP |
not |
counting the |
Yen |
and trade. A pro- |
||||||||||||||||||||||||||||||
leading |
stocks |
|
in |
this |
from a drop in this risk |
under some pressure. |
dynamics, |
the |
profit |
infrastructure stimulus |
||||||||||||||||||||||||||||||
cycle |
(growth |
|
stocks), |
(one-third of revenues |
Another feature of this |
trend |
should now be |
in China |
would |
help |
||||||||||||||||||||||||||||||
without |
undermining |
generated |
|
in |
|
EM |
one of the weakest in |
this |
regional |
market |
||||||||||||||||||||||||||||||
their trend at this point. |
countries). |
|
|
|
|
|
market is that it offers |
2019. In the end, this |
to |
bounce |
|
back, |
||||||||||||||||||||||||||||
Profit |
growth |
will |
also |
This |
|
|
would |
|
|
be |
one |
of |
the |
highest |
market |
is |
still |
highly |
but |
the |
timing |
and |
||||||||||||||||||
normalise, although the |
especially true if it did |
dividend |
yields |
in |
the |
dependent on the JPY’s |
sustainability |
|
|
|
of |
|||||||||||||||||||||||||||||
world |
|
(4.7% |
vs. 2.5% |
|
|
|
||||||||||||||||||||||||||||||||||
US market will maintain |
not |
prevent |
the |
yield |
|
impact on profits. This |
this |
movement |
are |
|||||||||||||||||||||||||||||||
for the |
MSCI |
World), |
||||||||||||||||||||||||||||||||||||||
an |
advantage |
on |
this |
curve |
from |
tightening |
is clearly a |
case |
of a |
uncertain. |
|
|
|
|
|
|||||||||||||||||||||||||
meaning |
that |
investors |
|
|
|
|
|
|||||||||||||||||||||||||||||||||
point |
given |
the |
weight |
somewhat, |
giving |
the |
risk-on/risk-off play. |
|
|
|
|
|
|
|
|
|||||||||||||||||||||||||
will make their way back |
|
|
|
|
|
|
|
|
||||||||||||||||||||||||||||||||
of disruptive names. |
|
banking |
sector |
some |
|
|
|
|
|
|
|
|
|
|
|
|
|
|
||||||||||||||||||||||
|
once |
|
long |
rates have |
|
|
|
|
|
|
|
|
|
|
|
|
|
|
||||||||||||||||||||||
|
|
|
|
|
|
|
|
|
|
|
|
|
|
|
|
|
|
|
|
|
|
|
|
|||||||||||||||||
Our |
bias |
will |
thus |
relief. In |
other |
words, |
peaked. |
|
|
|
|
|
|
|
|
|
|
|
|
|
|
|
|
|
|
|
||||||||||||||
remain |
fairly |
positive |
the Eurozone would get |
In the |
meantime, |
with |
|
|
|
|
|
|
|
|
|
|
|
|
|
|
||||||||||||||||||||
relative |
to |
the |
rest |
a boost |
from |
a |
relief |
|
|
|
|
|
|
|
|
|
|
|
|
|
|
|||||||||||||||||||
of |
the |
world, |
|
with |
a |
rally. |
|
|
|
|
|
|
|
|
Brexit |
just |
around |
the |
|
|
|
|
|
|
|
|
|
|
|
|
|
|
||||||||
|
|
|
|
|
|
|
|
|
corner, now is not the |
|
|
|
|
|
|
|
|
|
|
|
|
|
|
|||||||||||||||||
cautious |
approach |
in |
There |
|
are |
|
several |
|
|
|
|
|
|
|
|
|
|
|
|
|
|
|||||||||||||||||||
|
|
time to |
take |
risk on a |
|
|
|
|
|
|
|
|
|
|
|
|
|
|
||||||||||||||||||||||
the short term. |
|
|
|
|
political |
|
challenges |
market |
that |
will |
not |
|
|
|
|
|
|
|
|
|
|
|
|
|
|
|||||||||||||||
We |
are |
also |
|
mindful |
(starting |
|
with |
|
the |
outperform if a risk-on |
|
|
|
|
|
|
|
|
|
|
|
|
|
|
||||||||||||||||
that |
this area |
could |
European |
|
elections), |
rally |
gets |
under |
way, |
|
|
|
|
|
|
|
|
|
|
|
|
|
|
|||||||||||||||||
underperform |
in |
case |
however, |
that |
|
could |
and |
which |
|
could |
be |
|
|
|
|
|
|
|
|
|
|
|
|
|
|
|||||||||||||||
of the return of risk-on |
dampen |
|
|
investor |
hurt by a soft Brexit |
|
|
|
|
|
|
|
|
|
|
|
|
|
|
|||||||||||||||||||||
sentiment, which could |
appetite |
with |
global |
(our favourite scenario) |
|
|
|
|
|
|
|
|
|
|
|
|
|
|
||||||||||||||||||||||
support a relief rally in |
growth on the path to |
because of the possible |
|
|
|
|
|
|
|
|
|
|
|
|
|
|
||||||||||||||||||||||||
other markets. |
|
|
|
|
a gradual slowdown. |
appreciation of the GBP. |
|
|
|
|
|
|
|
|
|
|
|
|
|
|
||||||||||||||||||||
|
|
|
|
|
|
|
|
|
|
|
|
|
|
|
|
|
|
|
|
|
|
|
|
|
|
|
|
|
|
|
|
|||||||||
|
|
|
|
|
|
|
|
|
|
|
|
|
|
|
|
|
|
|
|
|
|
|
|
|
|
|
|
|
|
|
|
|
|
|
|
|
|
|
|
|
Document for the exclusive attention of professional clients, investment services providers and any other professional of the financial industry 15

vk.com/id446425943
#11 |
November 2018 |
CROSS ASSET |
|
|
|||
|
|
|
|
|
2019 Outlook Special Issue |
INVESTMENT STRATEGY |
|
FACTOR INVESTING
Combining quality and value: the winning solution
The essential
The quality factor, our main play in 2018, has paid off this year and is still a valid option. It involves investing in companies with little debt that are offering sustainable profit growth. But the more the cycle advances, the more careful investors have to be not to overpay for these stocks. Therefore, the high dividends and minimum volatility factors should also gradually make a valuable contribution.
What is the most important factor at this point of the cycle?
This year was a year of robust global growth that has now reached its peak. The major global economies are growing faster than their potential and central banks are tightening their monetary policies, led by the Fed. This trend is poised to continue in 2019, and the debate will eventually focus on the level of the “neutral rate” in the US, which is always tricky to predict. The investment cycle is mature; it is still in phase ii1 of our road map (left chart), but some indicators, and especially risk indicators (volatility, IG spreads, corporate margins, industrial commodity prices, emerging markets) suggest that the cycle is already slightly more mature than this. As far as factors go, this phase still favours quality, according to our roadmap. But we can also start looking at styles that will benefit from the next phase, namely high dividends and minimum volatility. Both styles, which are more defensive, are nevertheless negatively sensitive to interest rates and will become more relevant once long rates have peaked.
Let’s now take a snapshot of the current reality
The vertical axis of the other map (right chart) shows market momentum; if the factor is positioned high, it outperforms the MSCI World (in US dollars) and vice versa if it is positioned low. The horizontal axis depicts earnings momentum. The size of the circle refers to its relative valuation (the bigger it is, the more expensive it is). As the markets anticipate earnings dynamics, the natural direction is clockwise. The colour code highlights three types of factors: value-growth, large-mid-small, and other styles.
Conclusion
The growth/value ratio, which has been excessively high in 2018, has begun to ease but without completely reversing the trend for now. Small caps, which shone for a large part of 2018, have also ended up losing their grip. They had benefited greatly from domestic dominance in the US thanks in large part to the fiscal stimulus and, in relative terms, the trade war. In Europe, small caps served as growth stocks. The spike in volatility and likely peak in margins just ahead (wage hike) are now working against them. They are only at neutral on our map (in the centre). However, both these parameters are supportive for the quality factor (sustainable growth without leverage), which took the high ground in 2018. This is still a good compromise for 2019, provided investors do not overpay for it. The quality-value combination steers clear of the value traps laid by the value-only style as defined, for example, by MSCI. The next two styles investors should look at are high dividends (high and sustainable) and minimum volatility. They have already benefited from the October selloff and proved their merit in a portfolio (relative downtrend halted, particularly for high dividends in the Eurozone and minimum volatility in the US). We believe these factors will gain appeal once long rates have peaked.
1 See “Investment Cycle and Asset Allocation”, Eric Mijot, Economica, 2018.
1/ Our road map:
stylised behaviour of styles
|
|
Quality |
|
|
High Dividend |
||
Momentum |
|
|
Minimum |
||||
|
|
|
|
|
|
volatility |
|
GDP |
|
Phase ii |
Phase iii |
|
|||
trend |
|
Phase i |
Phase iv |
||||
GDP |
|
|
|
|
Small |
||
|
|
|
|
|
|
||
|
|
|
|
& |
|
||
|
|
|
|
|
|
Mid |
|
|
|
|
Increase |
|
|
Decline |
|
|
|
|
|
||||
|
|
|
in Central Bank rates |
|
|
in Central Bank rates |
|
|
|
|
|
|
|
|
|
2/ MSCI World style indices / MSCI World
(in USD)
MSCI WORLD Styles
|
|
|
|
2 |
|
|
|
|
Trend |
|
|
Momentum |
|
|
|
|
|
World) |
|
Quality |
1 |
Small |
Growth |
|
|
|
Market |
|
|
0 |
|
|
|
||
|
|
|
|
|
Large |
|
|
|
|
|
|
High Div |
|
|
|
|
|
Relative |
(vs |
-2 Min Vol |
|
0 |
1 |
2 |
||
|
Value |
-1 |
|
|
|
|
||
|
|
|
|
|
|
|
||
|
|
|
Mid |
|
|
|
|
|
|
|
|
|
|
|
|
|
|
-2
Relative EPS Momentum (vs World)
Source: Amundi Research
16 Document for the exclusive attention of professional clients, investment services providers and any other professional of the financial industry

vk.com/id446425943
CROSS ASSET |
November 2018 |
#11 |
|
||
|
|
|
INVESTMENT STRATEGY |
2019 Outlook Special Issue |
FIXED INCOME DEVELOPED MARKETS
Global liquidity, US outlook, and politics are the key drivers
The essential
The US economic outlook, the global liquidity cycle, and politics will be the main drivers of fixed income markets in 2019. In the US, we expect the strong growth to moderate over the next few quarters, determining the end of the Fed’s tightening cycle and limiting the rise in US bond yields. Geopolitical risks could weigh on both global growth and overall risk aversion in the market. This could push core bond markets’ yield downwards. The safe-haven status of the US treasuries/USD and Bund markets may be noted. The combination of an increase in the US debt supply and reduced central bank liquidity injections will play a role in determining technical factors, both for sovereign and corporate bond markets. In this environment, investors should increase duration, especially in the US, as a defensive strategy, and reduce the overall risks in their portfolios. We remain cautious on Eurozone peripheral issuers, and very selective on credit, where valuations are tight, especially in lower-rated US HY.
Contrary forces at play on core bond yields: watch the US outlook, the Fed and global liquidity
•The expected deceleration in US growth in H2 2019 and contained inflation pressure should limit the rise in long-term rates in DM. In the US, we expect the Fed to deliver another hike in December 2018, two hikes in H1 2019, and then to stop its monetary tightening cycle. On their side, Federal Open Market Committee members are showing increased uncertainty only around 2020-2021 economic prospects. A scenario with higher long-term rates would require that: (1) the US economic expansion could be sustained for a longer period, with no strong pressure on inflation; or (2) an inflation spike. We see limited probability that either of these two conditions will materialise, and think any further upside on US bond yields, induced by some pressure on wages, could be shortlived and limited. In Europe, long-term rates are set to bottom out, with the end of the ECB’s quantitative easing and the first interest rate increase (though not before September 2019). We also expect the uptrend in long-term rates to be limited, as the ECB will remain very gradual in the removal of its accommodative measures.
•Less and less favourable technical factors should push for higher rates and wider spreads, but also have a negative impact on global growth. In 2019, the net liquidity injected by CBs in DM will turn negative. At the same time, US debt supply will jump to fund the US administration’s expansionary policy and the maturing debt of the highly-leveraged American companies. Non-resident investors have provided huge support to the US dollar corporate bond market in recent years, but the context has changed: huge hedging costs have reduced the interest of Eurozone and Japanese investors in US assets. In Q2 2018, Eurozone investors cut their net holdings of US debt securities for the first time in four years, and Japanese holdings of US treasuries are at the lowest levels since 2011. As such, the massive rise in US funding needs is likely to be satisfied by dollar investors at the expense of EM. Consequently, the higher US debt supply could push for higher rates, but as this could increase the downside risks to the global economy, we expect limited upside
1/ Central bank balance sheets |
2/ US: net issuance of US treasury securities |
|
(12m. rolling sum, USD bn) |
USD billion
2500
2000
1500
1000
500 155
122
0
-500
-1000
2001 |
2002 |
|
|
|
|
|
|
|
|
|
|
|
|
|
|
|
|
|
2 500 |
|
|
|
|
|
|
|
|
|
|
|
|
|
|
|
|
|
1 902 |
|
|
1 099 |
|
|
|
|
|
|
|
|
|
|
|
|
|
|
|
|
|
|
|
||||
|
|
|
|
|
|
|
|
|
1 568 |
|
|
2 000 |
|
|
|
|
|
|
|
|
|
|
|
|
|
|||||
|
|
|
|
|
|
|
|
|
|
|
|
|
|
|
|
|
|
|
|
|
|
|
|
|
|
|
||||
|
|
|
|
|
|
|
1 254 |
|
1 262 |
|
|
|
|
|
|
|
|
|
|
|
|
|
|
|
|
|||||
|
|
|
|
|
|
|
|
|
|
|
|
|
|
|
|
|
|
|
|
|
|
|
|
|
||||||
|
|
|
|
|
|
|
|
|
|
1 038 |
|
1 089 |
|
1 500 |
|
|
|
|
|
|
|
|
|
|
|
|
|
|||
|
|
|
|
|
|
|
|
|
|
|
|
|
|
|
|
|
|
|
|
|
|
|
|
|
|
|
|
|
|
|
|
|
269 |
286 |
|
371 |
357 |
|
|
|
|
217 |
|
|
|
|
|
|
|
|
|
|
|
|
|
|
|||||
|
|
|
|
|
|
|
|
|
|
|
|
|
|
|
|
|
|
|
|
|
|
|
||||||||
98 200 |
|
|
|
|
|
|
|
|
|
|
|
|
|
|
1 000 |
|
|
|
|
|
|
|
|
|
|
|
|
|
||
|
|
-243 |
|
-168 |
|
|
|
|
|
|
|
|
|
500 |
|
|
|
|
|
|
|
|
|
|
|
|
|
|||
|
|
|
|
|
|
|
|
|
|
|
|
|
-200 |
|
|
|
|
|
|
|
|
|
|
|
|
|
|
|||
|
|
|
|
|
|
|
|
|
|
|
|
|
|
|
|
- |
|
|
|
|
|
|
|
|
|
|
|
|
|
|
2003 |
2004 |
2005 |
2006 |
2007 |
2008 |
2009 |
2010 |
2011 |
2012 |
2013 |
2014 |
2015 |
2016 |
2017 |
2018 |
2019 |
|
|
|
|
|
|
|
|
|
|
|
|
|
|
2007 |
2008 |
2009 |
2010 |
2011 |
2012 |
2013 |
2014 |
2015 |
2016 |
2017 |
2018 |
2019 |
2020 |
|||||||||||||||||
|
|
|
|
|
|
|
Fed |
|
ECB |
|
BOJ |
|
|
Net issuance of LT debt |
|
Net Issuance after FED purchase |
||||||||||||||
|
|
|
|
|
Source: Bloomberg, Amundi Research |
|
|
|
|
|
Source: Bloomberg, Amundi Research |
|||||||||||||||||||
Document for the exclusive attention of professional clients, investment services providers and any other professional of the financial industry 17

vk.com/id446425943
#11 |
November 2018 |
CROSS ASSET |
|
|
|||
|
|
|
|
|
2019 Outlook Special Issue |
INVESTMENT STRATEGY |
|
pressure on US bond yields. In Europe, despite the end of new QE purchases, technicals will still be partially supported by robust volumes of ECB reinvestments and by a very gradual approach the central bank is likely to follow in normalising rates.
Key investment convictions on fixed income and credit markets for 2019
The potential for increasing US rates is, in our view, limited by several factors: 1) the strong demand for US treasuries by US dollar investors; 2) the downside risk associated with the global growth scenario (the sensitivity of emerging markets and global growth to US rate levels); and 3) the mature phase of the US cycle. In the Eurozone, the ECB is going to be cautious on rate hikes, and risk aversion will likely remain high. As such, we expect limited pressure on interest rates.
Under the scenario of limited rises, we predict the following:
•In US: In H1 2019 interest rates should stabilise or increase only slightly, as we expect 10-year yields to peak near the expected peak in Fed funds. In this scenario, the 10-year yield would remain around current levels in the coming months and the US curve would only slightly flatten. In terms of curve segments, therefore, the short to medium segment would still offer an attractive risk/reward combination versus the long part of the curve. In H2 2019: we see some slight downside risk on bond yields in the second part of 2019, together with the slowdown in US growth and the Fed reaching its target on rates normalisation.
10Y bond yields - Dec 2019
|
Target range (%) |
US |
3.1/3.2 |
Germany |
0.55/0.75 |
Japan |
0.1 / 0.2 |
UK |
1.7/1.8 |
Data as of 15 October 2018
•In Europe, the ECB is likely to stick to its cautious forward guidance on rates: the first hike is projected to be delivered not before Q3 2019, and a long period of reinvestments (two-to-three years) should follow: this very gradual approach will be data (and trade issue/political risks/impact on oil prices on EUR) dependent. The ECB will have to carefully assess the timing of the first hike in interest rates as this could happen when the Fed suspends its monetary cycle and the Euro strengthen, potentially leading to excessive tightening in financial conditions. In addition, despite the positive-growth picture, risks are persisting on the political front (Italy, European elections, Brexit). For these reasons, we expect 10Y Bunds to rise but in a limited way. A dovish ECB keeps the search for yield alive in the two to five-year curve bucket, the segment in which Italian spreads also offer more space for normalisation in case of an earlier confrontation with the EU.
•In an environment such as that we have outlined, investors could consider hedging fixed income portfolios from the persisting inflation risk.
•Credit markets offer a mix of still generally supportive fundamentals but more negative technicals, while valuations differ more significantly between the US and the Eurozone and between high grade and speculative grade. Leverage, valuations and non-resident investor support are more challenging in the US. Here, some diversification towards structured credit sectors, including agency MBS as well as non-agency MBS and ABS, may offer more attractive relative value to investors. Political risks and less brilliant macro growth, together with the end of the Corporate Sector Purchase Programme (CSPP), represent major challenges for European corporates. At the same time, valuations look generally more stretched in high beta USD denominated bonds, where the risks of market complacency are higher in case of negative surprises on economic trends and tightening financial conditions. Preference goes to high grade, low duration corporates in the US, and to a more tactical approach on Euro HY and financials, depending on the evolution of political risks, while core names keep their resiliency.
In conclusion, the environment above calls for an active and tactical approach in global fixed income for next year. The short duration stance, which has characterised most of 2018, will be replaced by a more constructive view on duration (neutral in the US), which also acts as a hedge to global risks. On credit, improve the quality will be key. Sector rotation in a wide spectrum of fixed income assets and diversification in the credit continuum space (liquid and illiquid assets/private debt) could help to create value for investors. As global liquidity is set to shrink, we could see episodes of market liquidity deterioration. Therefore, a focus on liquidity management will be key to potentially grasping the opportunities that should open up during the year.
Positive triggers |
Risks to monitor |
Easing political risk together with an eventual soft Brexit deal would support a recovery in periphery and corporate bond spreads in the Eurozone
In the government bond area, positive surprise in inflation/growth in the US and/or a policy mistake (a too fast retreat from QE by the ECB or BoJ), could drive interest rates higher
A deal between China and US on trade would result |
In the Eurozone, persisting and increasing political risk |
supportive for global and US credit and also for |
would weigh on periphery countries and corporate |
Eurozone spread segments |
bonds, despite the limited contagion so far |
In the government bond segment, risks on growth and/ |
In credit markets, risks come from a sudden and |
or on the geopolitical side, would support the search |
unwanted tightening in financial conditions linked to a |
for safe haven |
negative surprise on growth, especially in the US where |
|
leverage and debt is higher |
18 Document for the exclusive attention of professional clients, investment services providers and any other professional of the financial industry

vk.com/id446425943
CROSS ASSET |
November 2018 |
#11 |
|
||
|
|
|
INVESTMENT STRATEGY |
2019 Outlook Special Issue |
CURRENCIES
Geopolitical risks will continue to play a key role
The essential
Central banks’ ongoing policy normalisation, trade tensions and political issues will be the key drivers to watch in the FX market. Brexit and political noise in the Eurozone might weigh on GBP and EUR for some time. We expect the USD to remain strong in the short term, and weaken with a medium-term horizon as in addition to other factors, the economy might reach the mature phase of its cycle, a situation that has historically coincided with a weaker US dollar.
EUR/USD: short-term headwinds, more positive medium-term outlook
Diverging financial conditions with respect to the US, mild (albeit |
|
|
|
FX target for Dec 2019 |
|
||
increasing) growth, concerns over the impact of a trade war on European |
|
||
exports and rising political risks have weighed on the EUR during the |
|
Target range |
|
year. More recently, headwinds from the Italian budget announcement |
EUR/USD |
1.23-1.25 |
|
put a cap on the EUR in light of the many uncertainties that remain and |
USD/JPY |
105-107 |
|
might be in place for some time to come as, for instance, negotiations with |
|||
GBP/USD |
1.39-1.42 |
||
the EU Commission might take a while to reach a resolution. With the |
|||
renewed rise in German political uncertainties and with Italian political |
Data as at 15 October 2018 |
|
|
risks tilted to the upside, we could see some short-term pressures that |
|
|
|
|
|
could prevent the EUR/USD from appreciating from current levels. European elections also pose additional risks to the currency – as the Bavarian elections recently showed, increased political fragmentation may be expected in addition to the risks of breakthrough of populists. Despite the fragile sentiment, elevated speculative short positioning indicates the negatives are very much priced in and, thus, further EUR selling seems unlikely, especially in the context of strong fundamentals. While growth for the Eurozone should remain above potential, external sector figures are also supportive to the currency (very high current account surplus). Moreover, we expect the ECB to keep moving towards normalisation and increase interest rates in H2 2019, thus lowering the policy divergence with the Fed. Hence, we remain EUR bullish in the medium term.
USD/JPY: downward trend for the year ahead
While we believe the USD/JPY might keep trading around the current levels (our forecast is 112 by the year-end), we expect the Japanese yen to be on an upward trend in 2019, driven by monetary policy and persistent trade protectionism talks. While recent communication from the Bank of Japan (BoJ) points to the continuation of the ongoing ultra-accommodative monetary policy for some time to come, we expect the BoJ to allow further flexibility on its long-term yield policy next year, thus moving (albeit at a very gradual pace) towards the normalisation of its monetary policy stance. Moreover, global trade friction risks might persist or could further escalate in the medium term. This provides further support to the currency, due to its traditional safe haven status. Its extremely cheap valuation (the lowest among the G10 space) and the resumption of a medium-term USD downtrend could also provide support for the currency’s appreciation. In addition, past experience has shown that the JPY tends to appreciate further on the back of rising US bond volatility, due to the effect of positions rebalancing and capital repatriation back to Japan. We note that hedge ratios on Japanese investments in US assets have indeed decreased substantially due to the high cost of hedging and any repatriation is not likely to be FX neutral.
GBP/USD: it is all about politics
Brexit negotiations are entering a critical period and, as such, the pound has reacted to political developments. As many uncertainties remain over the future of the British economy, we expect the currency volatility to remain high in the short/middle run. Even though in our baseline scenario (70% probability): i) the UK and the EU will reach a deal late in 2018 or early in 2019; and ii) the UK is going to exit the EU in March 2019 or soon afterwards to start a transition period, we expect that such a deal will only be reached through a “rock path”. This means that initial deadlines are mostly likely to be bypassed, the deal is likely going to be reached at the last moment and the parliamentary approval process is going to be very difficult. But we note that this is something that seems to be very much priced in as investors remain short the currency and option market participants remain tilted to the downside, even looking at a 1Y time horizon. Thus, we expect temporary market stress regarding Brexit would certainly give some relief to the currency. In our view, the potential upside should remain quite contained as markets might start looking at the country’s ability to finance its large current account deficit under the new framework, thus putting a cap on the GBP. We also note that support from monetary policy is not clear as further rate hikes from the Bank of England will very much depend on the final Brexit outcome and, especially, on how resilient the economy will (still) be next year.
Document for the exclusive attention of professional clients, investment services providers and any other professional of the financial industry 19

vk.com/id446425943
#11 |
November 2018 |
CROSS ASSET |
|
|
|||
|
|
|
|
|
2019 Outlook Special Issue |
INVESTMENT STRATEGY |
|
EMERGING MARKETS
Seek entry points and search for carry
The essential
After a challenging year for EM assets, we expect the economic and financial environment to improve through 2019, and we see some possible entry points materialising in the second part of the year, when the Fed tightening cycle will be close to an end. Exposure to trade dynamics, low external vulnerabilities and margins of manoeuvre for policy actions will be the key factors to identifying the winners and losers in EM in equity, fixed income and FX. Selection will remain the name of the game when investing in EM in 2019.
EM growth expected to reaccelerate vs DM in H2 2019 and 2020
We expect that the EM-DM growth differential will turn in favour of EM countries in the second half of 2019, due to the likely deceleration in the US economic cycle and the mild reacceleration in the EM universe. As in 2018, the economic performance in EM will mainly be driven by domestic demand (household consumption and investments), more than by external demand, barring any major disruption in the US-China trade relationship. On fixed investments we could see some stabilisation/deceleration as a result of the trade tensions (already implemented and planned) impacting business confidence and therefore investment decisions (i.e., in North Asia and Mexico). Domestic projects, such as those related to filling infrastructure gaps — some already started in 2018 — will continue in 2019 (i.e., in Indonesia and the Philippines).
On consumption, we see an overall benign inflation environment and economies running closer to their potential reducing the slack in the labour market, which should sustain household expenditure.
Winners and losers: watch the trade dynamics and China’s resilience…
2018 has been a year of change in the globalisation dynamics around the world. Changes towards less multilateralism are ongoing, accelerated by populism and more nationalist governments in many countries. The future global trade environment is now more uncertain. On one side, there are still good practices to pursue in trying to keep a sort of global cooperation continuing: World Trade Organization modernisation and enforcement in some areas that today are more relevant than in the past (e.g., services) and new/in-progress effective regional agreements redesigning a more customised multilateralism. On the other side, the urgency among countries to defend their own economic cycles from the recent wave of protectionism and volatility in the FX market, is incentivising unilateral retaliations that could become more disordered in the near future (such as import tariff increases in India and Indonesia). The development in trade-related measures remains highly uncertain; we do believe that a full trade war escalation is possible, but it’s not our base case yet, while a strong improvement and pullback on tariffs is, in our view, highly unlikely.
The outlook for China is crucial in the context of trade restriction. With regards to the $250bn tariffs applied by the US on Chinese exports, China’s growth is likely to hold up with its policy combo underway: monetary, fiscal, and RMB.
1/ Real GDP gap EM-DM (%) |
2/ Amundi EM vulnerability rank |
|
|
3 |
1.0 |
|
|
|
|
|
|
|
|
|
|
|
|
|
0.5 |
|
|
|
2.7 |
|
|
0.0 |
|
|
|
|
|
|
|
|
|
|
|
2.5 |
|
-0.5 |
|
|
|
|
|
|
-1.0 |
Basic Balance |
External Debt position |
Reserves Adequacy |
|
|
|
|
CB Credibility |
Vulnerability Rank |
|
|
|
|
-1.5 |
|
|
|
2018 |
2019 |
2020 |
|
|
|
|
Source: Amundi Research as of 15 October 2018.
20 Document for the exclusive attention of professional clients, investment services providers and any other professional of the financial industry