

Academic Writing Task 3
You should spend 20 minutes on this task.
The graph below shows the population figures of different types of wild birds in the United Kingdom between 1970 and 2004.
S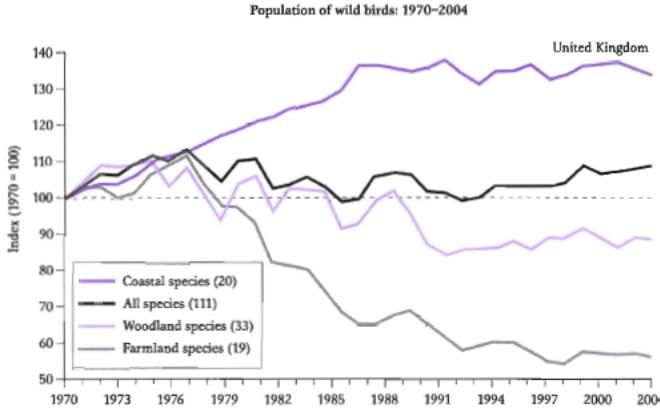 ummarise
the information by selecting and reporting the main features, and
make comparisons where relevant
ummarise
the information by selecting and reporting the main features, and
make comparisons where relevant
Write at least 150 words.
Test Yourself (Units 7 – 12)
1. Which of the following graphical presentations is not appropriate for categorical data?
(a) Pareto diagram
(b) scatter plot
(c) bar chart
(d) pie chart
2. Which of the following graphical presentations is not appropriate for numerical data?
(a) histogram
(b) pie chart
(c) dot-scale diagram
(d) scatter diagram
3. A type of histogram in which the categories are plotted in the descending rank order of the magnitude of their frequencies is called a:
(a) bar chart
(b) pie chart
(c) scatter plot
(d) Pareto diagram
4. One of the advantages of a pie chart is that it shows that the total of all the categories of the pie adds to 100%.
(a) True
(b) False
5. The basic principle behind the ________ is the ability to separate the vital few categories from the trivial many categories.
(a) scatter plot
(b) dot scale diagram
(c) Pareto diagram
(d) pie chart
6. When studying the simultaneous responses to two categorical questions, you should set up a:
(a) histogram
(b) pie chart
(c) scatter plot
(d) cross-classification table
7. In a cross-classification table, the number of rows and columns:
(a) must always be the same
(b) must always be 2
(c) must add to 100%
(d) None of the above
8. Histograms are used for numerical data, whereas bar charts are suitable for categorical data.
(a) True
(b) False
9. A department store in a small town monitors customer complaints and organizes these complaints into six distinct categories. Over the past year, the company has received 534 complaints. One possible graphical method for representing these data is a Pareto diagram.
(a) True
(b) False
10. A department store in a small town monitors customer complaints and organizes these complaints into six distinct categories. Over the past year, the company has received 534 complaints. One possible graphical method for representing these data is a scatter plot.
(a) True
(b) False
11. A computer company collected information on the age of their customers. The youngest customer was 12, and the oldest was 72. To study the distribution of the age of its customers, it should use a pie chart.
(a) True (b) False
12. A computer company collected information on the age of their customers. The youngest customer was 12, and the oldest was 72. To study the distribution of the age of its customers, it can use a histogram.
(a) True (b) False
13. A financial services company wants to collect information on the weekly number of transactions. To study the weekly transactions, it can use a pie chart.
(a) True (b) False
14. A financial services company wants to collect information on the weekly number of transactions. To study the weekly transactions, it can use a time-series plot.
(a) True (b) False
15. A professor wants to study the relationship between the number of hours a student studied for an exam and the exam score achieved. The professor can use a time- series plot.
(a) True (b) False
16. A professor wants to study the relationship between the number of hours a student studied for an exam and the exam score achieved. The professor can use a bar chart.
(a) True (b) False
17. A professor wants to study the relationship between the number of hours a student studied for an exam and the exam score achieved. The professor can use a scatter plot.
(a) True (b) False
18. If you wanted to compare the percentage of items that are in a particular category as compared to other categories, you should use a pie chart, not a bar chart.
(a) True (b) False
19. To evaluate two categorical variables at the same time, a _______ should be developed.
20. A _______ is a vertical bar chart in which the rectangular bars are constructed at the boundaries of each class interval.
21. A _____ chart should be used when you are primarily concerned with the percentage of the total that is in each category.
22. A _______ chart should be used when you are primarily concerned with comparing the percentages in different categories.
23. A _____ should be used when you are studying a pattern between two numerical variables.
24. A _______ should be used to study the distribution of a numerical variable.
25. You have measured your pulse rate daily for 30 days. A _______ plot should be used to study the pulse rate.