

Haber and Menaldo APSR 2011
.pdfAmerican Political Science Review |
Page 1 of 26 February 2011 |
doi:10.1017/S0003055410000584
Do Natural Resources Fuel Authoritarianism?
A Reappraisal of the Resource Curse
STEPHEN HABER Stanford University
VICTOR MENALDO University of Washington
Alarge body of scholarship finds a negative relationship between natural resources and democracy. Extant cross-country regressions, however, assume random effects and are run on panel datasets with relatively short time dimensions. Because natural resource reliance is not an exogenous
variable, this is not an effective strategy for uncovering causal relationships. Numerous sources of bias may be driving the results, the most serious of which is omitted variable bias induced by unobserved country-specific and time-invariant heterogeneity. To address these problems, we develop unique historical datasets, employ time-series centric techniques, and operationalize explicitly specified counterfactuals. We test to see if there is a long-run relationship between resource reliance and regime type within countries over time, both on a country-by-country basis and across several different panels. We find that increases in resource reliance are not associated with authoritarianism. In fact, in many specifications we generate results that suggest a resource blessing.
Asubstantial political economy literature argues that economic and fiscal reliance on petroleum, natural gas, and minerals helps create and perpetuate authoritarian political regimes. The genesis of this idea can be found in Mahdavy (1970), who noted that petroleum revenues in Middle Eastern countries constituted an external source of rents directly captured by governments, thereby rendering them unaccountable to citizens. Other scholars then built upon Mahdavy (1970) to postulate a general law about
Stephen Haber is A.A. and Jeanne Welch Milligan Professor of Political Science and Peter and Helen Bing Senior Fellow, Hoover Institution, Stanford University, 434 Galvez Mall, Stanford, CA 94305 (haber@stanford.edu).
Victor Menaldo is Assistant Professor of Political Science, University of Washington, 101 Gowen Hall, Seattle, WA 98105 (vmenaldo@u.washington.edu).
Research support was provided by the Stanford University President’s Fund for Innovation in International Studies, the Institute for Research in the Social Sciences, and the Hoover Institution, where Menaldo was a National Fellow in 2009–10. Able research assistance was provided by Aaron Berg, Ishan Bhadkamkar, Nicole Bonoff, Roy Elis, Pamela Evers, Andrew Hall, Joanna Hansen, Meryl Holt, Sin Jae Kim, Gabriel Kohan, Ruth Levine, Jose´ Armando Perez-Gea, Aaron Polhamus, Diane Raub, Jennifer Romanek, Eric Showen, Daniel Slate, Anne Sweigart, Ardalan Tajalli, Hamilton Ulmer, Noemi Walzebuck, Scott Wilson, and Aram Zinzalian. Special thanks go to Nikki Velasco, who kept the research team working smoothly. Michael Herb and Thad Dunning generously shared their insights on data sources and methods with us. Earlier drafts of this article were presented at the Yale University Workshop on Political Economy, the Conference of the American Economics Association, the Harvard University Conference on Latin American Economic History, the Stanford Social Science History Workshop, the Stanford Workshop in Comparative Politics, the Caltech Workshop in Social Science History, the Colegio de Mexico,´ the Instituto de Estudios Superiores de Administracion,´ and the National Bureau of Economic Research Workshop in Political Economy. We thank Ran Abramitzky, Thomas Brambor, Roy Elis, James Fearon, Jeff Frieden, Miriam Golden, Avner Greif, Tim Guinnane, Michael Herb, Scott Kieff, David Laitin, Pauline Jones-Luong, Naomi Lamoreaux, Ross Levine, Noel Maurer, Francisco Monaldi, Elias Papaioannou, Armando Razo, Michael Ross, Paul Sniderman, William Summerhill, Ragnar Torvik, Dan Treisman, Nikki Velasco, Romain Wacziarg, and Gavin Wright, as well as three anonymous referees, for their helpful comments on earlier drafts.
natural resource rents and authoritarianism. Luciani (1987), for example, avers that “The fact is that there is ‘no representation without taxation’ and there are no exceptions to this version of the rule.” Huntington (1991, 65) then popularized this idea: “Oil revenues accrue to the state: they therefore increase the power of the state bureaucracy and, because they reduce or eliminate the need for taxation, they also reduce the need for the government to solicit the acquiescence of the public to taxation. The lower the level of taxation, the less reason for publics to demand representation.”
The idea that there is a causal relationship between natural resource reliance and authoritarianism underpins a broad and influential literature. This includes a plethora of country case studies, policy papers produced by multilateral aid organizations, popular books on world politics and economics, and articles in the mass media that make sweeping claims, such as the existence of a “first law of petropolitics” (Friedman 2006). The view that natural resources and democracy do not go together is often coupled with parallel literatures that find correlations between natural resources and slow economic growth or the onset of civil wars. Taken together, these literatures have given rise to the stylized fact that there is a “resource curse.”
Beginning with a seminal article by Ross (2001), numerous scholars have employed cross-country regression frameworks to examine the hypothesis that oil, gas, and minerals cause authoritarianism. Although the details vary, the vast majority of the literature produces results that are consistent with the hypothesis (e.g., Aslaksen 2010; Goldberg, Wibbels, and Myukiyehe 2008; Jensen and Wantchekon 2004; Papaioannou and Siourounis 2008; Ramsay n.d.; Ross 2009; Smith 2007; Wantchekon 2002). A considerably smaller literature either finds against the hypothesis (Herb 2005), or finds that the effect of natural resources on regime type is conditional on other factors (Dunning 2008).
The researchers who find evidence that ostensibly supports the resource curse have not yet provided
1

A Reappraisal of the Resource Curse |
February 2011 |
compelling tests of the hypothesis that natural resources cause authoritarianism. Neither, however, have the skeptics produced compelling results to the contrary. The fundamental issue is that the resource curse is about a dynamic process purported to unfold over time. Moreover, it requires the specification of a counterfactual: the discovery, production, and export of natural resources is hypothesized to distort a country’s regime type, putting it on a different path of political development than it would otherwise have followed. The empirical tests that have been used to test the resource curse hypothesis, however, do not tend to employ time series–centric methods, nor specify counterfactual paths of political development. Instead, they tend to compare resource-reliant countries with resource-poor countries.
In using observational data, there is, of course, a big difference between finding a correlation between two variables and demonstrating that the relationship is causal. It is particularly problematic to infer causality when the correlation is produced by a technique that primarily exploits variance between countries. It would not take lengthy argumentation to demonstrate that there are fundamental differences between countries, and that these differences may be correlated with both the dependent and independent variables that researchers are introducing into their regressions. This is an inconvenient, but ubiquitous, feature of observational data. It implies that, unless a researcher is certain that the dependent and independent variables are uncorrelated with countries’ unobserved differences, it is not appropriate to estimate regressions that pool the data or employ random effects. There is a strong likelihood that the results generated by such approaches will be driven by omitted variables that are time-invariant and country-specific. The bottom line is this: when a process is hypothesized to occur over time, it is best to employ evidence and methods designed to see whether that time series process actually occurred.
This problem besets much of the resource curse literature. To put it concretely, the assumption behind the majority of the regressions in the literature is that, had Saudi Arabia not become oil-reliant, it might have developed the same political institutions as Denmark, provided that it had achieved the same per capita income and had fewer Muslims (see Ross 2001). It is hard to believe, however, that endemic, time-invariant institutions that are not captured by covariates such as GDP per capita and the population share that is Muslim do not differentiate these countries. Moreover, these persistent, unspecified differences define the possible set of political institutions, and the possible set of economic sectors, that emerge and survive (Acemoglu et al. 2008). This includes the resource sector. As some researchers have pointed out, a country’s resources, whether measured as stocks or flows, are not exogenous: they are determined by legal and cultural institutions (e.g., David and Wright 1997; Norman 2009).
Any number of factors might jointly determine resource reliance and authoritarianism. Permit us to provide just one example. Rulers who have inherited inveterately weak states tend to have pressing fiscal needs
and short time horizons; they may therefore choose to search for resources and/or extract them at high rates today to obtain the rents needed for political survival, rather than save those resources for tomorrow. Indeed, as Manzano and Monaldi (2008) point out, world oil reserves happen to be concentrated in precisely those countries with weak state capacity—and as any number of case studies have shown, weak state capacity preceded the discovery of oil or other minerals in those countries (e.g., Haber, Razo, and Maurer 2003). Given that countries’ underlying institutions are also correlated with their regime types (Acemoglu et al. 2008), it is likely that inveterately weak state capacity jointly determines authoritarianism and high levels of resource reliance.1 Unfortunately, there is no consensus metric to operationalize “state capacity” across countries and time, let alone a metric that is exogenous. Moreover, there are likely to be several such unobserved factors that confound correlations between resource reliance and autocracy. The implication, we hope, is clear: lest the results be biased by omitted variables, time-invariant, country-specific factors have to be expunged.
A number of techniques are available to control for unobserved country heterogeneity, but one in particular—looking at variance within countries over time—gives researchers the flexibility to simultaneously address other factors that may also produce biased estimates. The core of our approach is to employ time series–centric methods that evaluate the long-run effect of resource reliance on regime types. We carry out this analysis using both a country-by-country timeseries approach and a dynamic panel framework with country fixed effects. In order to do this, we construct original datasets whose time-series dimension extends back to the period before countries became reliant on natural resources: our panel covers 168 countries from 1800 to 2006. To ensure that our results are robust, we construct four different measures of natural resource reliance and employ the two most popular measures of regime type used in the literature.
We analyze the data with an eye to detecting and estimating time-series relationships, and do so by biasing in favor of the resource curse hypothesis. We diagnose the stationarity characteristics of both our resource reliance measures and regime type, and tend to find evidence that suggests that the data in levels are nonstationary. We therefore perform cointegration tests to see if there are grounds to suggest that there is a structural relationship between resources and regime types. When the tests suggest that we can reject the null hypothesis, implying a long-run relationship between these variables, we run error correction mechanism (ECM) regressions to estimate the direction, magnitude, and statistical significance of that relationship. However, because we want to bias our analysis in favor of the resource curse, and because there is always
1 This is also true of population, by which we and others normalize resource reliance. As Cutler, Deaton, and Lleras-Muney (2006) and Soares (2007) show, persistent institutions determine the level and growth rate of population.
2

American Political Science Review
the possibility—however slight—that both unit root and cointegration tests can produce false negatives, we also run ECM models when we cannot reject the null of no cointegration. We do this to identify and report the direction of the relationship between resource reliance and regime types in levels, despite the fact that there are reasons to be dubious of any inferences that can be drawn from a regression in levels between two nonstationary and noncointegrated variables (Granger and Newbold 1974). That is, our goal is to leave no stone unturned in looking for evidence consistent with the hypothesis of a resource curse.
Focusing on the relationship between natural resource reliance and regime types within countries over the long run also allows us the flexibility to address other issues that may confound causal inference. For example, if there are good theoretical priors about factors that may condition the effect of an independent variable on the outcome of interest, the regressions need to go beyond simply estimating the average effect. Do natural resources always give rise to autocracy, or only under certain conditions? To answer this question we group countries by their level of income, inequality, threshold level of resource reliance, time period, and region, and then estimate separate regressions on those subsamples.
Another common problem in drawing causal inferences is the specification of the counterfactual outcome. What would have happened had a particular country not been exposed to the treatment variable of interest? One technique that researchers use to address this problem is a difference-in-differences estimator. Focusing on variance within countries over time also allows us to employ such an approach, but we differ from typical applications: we develop a technique that is suited to estimating the effect of a continuous treatment variable. First, we specify the counterfactual path that a resource-reliant country’s regime type would have followed in the absence of those resources, on the basis of the path followed by the non–resource reliant countries in its geographic region. Second, we compare that counterfactual path with the actual path. Third, we see whether any divergence between the actual and counterfactual paths of political change correlates with increases in resource reliance. If one wanted, for example, to specify the counterfactual path that would have been followed by oiland gas-rich Kazakhstan had it not discovered those resources, the best approximation would be the other Central Asian Republics that have not emerged as major resource producers (e.g., Uzbekistan)—but that share Kazakhstan’s history of repeated invasions and occupations, as well as broad geographic and cultural characteristics.
Finally, researchers have to be certain that their results are not biased by reverse causality. Do natural resources fuel authoritarianism, or is it the other way around? Might it be the case that the only economic sectors that yield rates of return high enough to compensate for expropriation risk in authoritarian states are oil, gas, and minerals, thereby engendering resource reliance? We therefore create several instruments based on countries’ proven oil reserves that
have both time-series and cross-sectional variance in order to estimate instrumental variables regressions with country fixed effects.
No matter how we look at the long-run data—includ- ing just making simple country-by-country graphs—we cannot find a systematic tendency that matches the concept of a resource curse. In fact, to the degree that we detect any statistically significant relationships, they point to a resource blessing: increases in natural resource income are associated with increases in democracy. This is particularly the case among countries that had low per capita incomes before they discovered resources. This is not to say that one cannot point to cases in which a dictator used resource rents to stay in power. It is to say, however, that there is a huge difference between identifying cases of a phenomena and making lawlike statements. The weight of the evidence indicates that scholars might want to reconsider the idea that there is a resource curse.
LITERATURE REVIEW
We are not the first researchers to have noted that the techniques employed in the resource curse literature may yield biased results. Indeed, resource curse researchers have become increasingly aware of the problems of drawing causal inferences from observational data.
Aslaksen (2010) provides the best attempt to date to address unit heterogeneity bias by employing a dynamic panel model. Her approach, however, introduces a range of new problems. First, because the time dimension of her dataset (1972–2002) is only 30 years, she has to be concerned about Nickell Bias (correlation between the lagged dependent variable(s) and the unit fixed effects). She therefore employs a generalized method of moments (GMM) system approach. Her estimation strategy is to introduce a lagged dependent variable and a one-year lag of the independent variables, but this potentially imposes invalid restrictions on the structure of the data, thereby biasing the results (DeBoef and Keele 2008). Second, although a system GMM estimator is designed to estimate models with data in levels that are highly persistent, this is not a license to neglect the evaluation of the time series properties of the data. In particular, Aslaksen does not evaluate whether her data are nonstationary—even though high persistence strongly suggests unit roots— and then take the proper steps to estimate relationships in light of this fact. Third, as Bun and Wendmeijer (2010) have shown, the system GMM estimator suffers from a weak instrument problem, making results unreliable. Finally, when estimating regressions that are centered on “within variance,” one has to be concerned about measurement error. Aslaksen potentially mitigates measurement error by abandoning yearly data as the unit of observation. She instead employs fiveyear averages. Unfortunately, by compressing the time dimension of the data into only six periods, Aslaksen foregoes the opportunity to model the time-series relationship between oil and democracy adequately.
3
A Reappraisal of the Resource Curse |
February 2011 |
Herb (2005) gains considerable traction on the specification of historically plausible counterfactuals for resource-reliant countries to better isolate the effect of resources on regime types. He reasons that resourcereliant countries would have been substantially poorer had they not found oil, gas, or minerals, and that their lower GDPs would have caused them to be less democratic. He therefore estimates what their GDP would have been in the absence of these resources, and then estimates their level of democracy at those lower, counterfactual levels of GDP. This is, however, only a partial solution: it ignores dynamics. A more powerful approach is to specify the alternative trajectories that resource-reliant countries would have followed in the absence of increasing resources, compare those counterfactual trajectories to their actual trajectories, and thereby control for other changes experienced by the resource-reliant cases during exposure to resources.
Dunning (2008) provides the best attempt to date to address the possibility of conditional effects. He theorizes that when a society has a highly unequal distribution of income, natural resource wealth permits democratization because elites do not fear redistribution by the enfranchisement of the poor; conversely, when the distribution of income is more equal, natural resource wealth reinforces authoritarian regimes because leaders do not face demands for redistribution, and therefore can deploy the rents from resources to buy off or coerce opponents. He therefore introduces into the typical random-effects specification with resource reliance as the independent variable a measure of inequality and an interaction of inequality with resource reliance. These regressions, however, can be critiqued for employing a measure of inequality (the capital share of nonoil value added) that omits the oil sector. This potentially causes him to overestimate the share of income that is earned by labor in oilrich countries that have undiversified economies (e.g., the Middle East). These regressions may therefore be picking up a fixed effect associated with undiversified oil economies. There are also other theoretically relevant conditional effects for which Dunning does not search.
Ramsay (n.d.) addresses endogeneity bias by instrumenting oil income with out-of-region natural disasters, reasoning that if a tsunami hits Malaysia, for example, it increases oil income in the rest of the world’s producers without affecting their regime type through any other channel. Ramsay assumes that his instrument addresses both endogeneity and unobserved heterogeneity, and therefore does not introduce country fixed effects. This assumption is problematic. A short-term shock to oil prices will likely be offset by an immediate increase in oil production by a few big producers with substantial excess capacity before any increase in oil prices materializes. In fact, Saudi Arabia, the world’s largest producer, seeks as a matter of policy to create a stable world oil market by manipulating output to offset shocks. In short, Ramsay’s instrument may be picking up a “big producer” fixed effect—a conjecture supported by the fact that his instrument is rendered weak when the sample excludes the Middle East.
RESEARCH DESIGN
Measuring Regime Types
Our primary measure of regime type is the standard measure of democracy employed in the resource curse literature—the Combined Polity 2 score, an index of the competitiveness of political participation, the openness and competitiveness of executive recruitment, and the constraints on the chief executive that is coded for every country in the world from 1800 on (Marshall and Jaggers 2008). For simplicity, we refer to this measure as Polity. To make the regression coefficients easier to interpret, we normalize Polity to run from 0 to 100. Some researchers have argued that democracy is best measured as a binary variable. We thus also employ a widely used binary measure of democracy known as Regime (Przeworski et al. 2000) that we extend to run from 1800 to 2002. For a full discussion of the construction of this variable, as well as all of the other variables mentioned herein, see Online Appendix 1, Sources and Methods (available at www.journals.cambridge.org/psr2011001).
Measuring Oil and Mineral Dependence
Researchers have employed various measures of resource reliance in the extant literature. We draw upon those measures in undertaking our empirical analyses, but go beyond the extant literature in three ways. First, in order to be sure that our results are not driven by the choice of measure, we conduct our empirical analyses using four different measures. Second, the extant literature employs datasets that are truncated with respect to time: they typically go back no farther than 1970, with a few that extend back to 1960. We extend our measures back to independence or 1800 (if a country obtained independence before 1800). This means that we are able to observe countries before and after they became major natural resource producers. It also means that we are able to estimate the long-run effect of natural resources on a country’s regime type. Third, rather than downloading datasets of uncertain provenance and quality that may be beset by measurement error, we construct our series from primary sources (when those are not available we give precedence to sources that are closest to the primary sources).
The resource curse literature claims that the causal mechanism that links natural resources to regime types is the rents captured by governments from oil, gas, and mineral production, which allow them to become “rentier states” that are financed without taxing citizens. We therefore follow Mahdavy (1970) and Herb (2005) by constructing a measure of fiscal reliance on resource revenues, the percentage of government revenues from oil, gas, or minerals. For the sake of simplicity, we refer to this variable throughout the article as Fiscal Reliance. Unlike Mahdavy (1970), who only covers a few years in the 1950s and 1960s for a small group of Mideast countries, and Herb (2005), who covers major producers during the period 1972–1999, we provide coverage of Fiscal Reliance from a country’s first year
4

American Political Science Review
of independence (or 1800) to 2006, allowing us to observe countries before and after they became oil, gas, or mineral producers.
There is one practical disadvantage to our time series approach to this measure: the retrieval and standardization of fiscal data extending back to the nineteenth century is not an enterprise characterized by economies of scale. We therefore truncate our coverage of Fiscal Reliance with respect to the number of countries by focusing on large producers that demonstrate variance in Polity (see Online Appendix 1, Sources and Methods, for details about the selection criteria). We code Fiscal Reliance for 18 countries: 16 oil and gas producers and 2 of the world’s major copper producers. The oil and gas producers are Mexico, Venezuela, Ecuador, Trinidad and Tobago, Nigeria, Angola, Indonesia, Iran, Algeria, Bahrain, Equatorial Guinea, Gabon, Yemen, Oman, Kuwait, and Norway. The copper producers are Chile and Zambia.
We also estimate regressions on total oil income per capita (barrels produced, divided by population, multiplied by the real world price, expressed in thousands of 2007 dollars). For the sake of simplicity, we refer to this variable as Total Oil Income. Total Oil Income is a theoretically second-best metric compared to Fiscal Reliance: it measures the income earned by a country from crude oil, not the rents garnered by the government from that income. We employ it, however, for two reasons. First, it has emerged as the standard measure in recent work on the resource curse (e.g., Aslaksen 2010; Dunning 2008; Ramsay n.d.; and Ross 2009). Second, it affords broad time series and cross-sectional coverage. Unlike the literature to date, however, which truncates coverage to the period since 1960, we begin coding in 1800 and cover 168 countries (104 display positive values) until 2006. Our first positive values are in 1861, just after the United States and Romania sank the world’s first commercial oil wells.
We also develop two additional measures of resource reliance—Total Fuel Income (oil, natural gas, and coal, divided by population, expressed in thousands of 2007 dollars) and Total Resource Income (oil, natural gas, coal, precious metals, and industrial metals, divided by population, expressed in thousands of 2007 dollars). These measures are based on a measure frequently employed in the literature, the Hamilton and Clemens (1999) Mineral Depletion variable (e.g., Aslaksen 2010; Dunning 2008). Our measures differ from theirs in multiple respects, the most salient of which is longitudinal coverage: we estimate our measures back to 1900, instead of 1960, as is standard in the literature.
Control Variables and Instrumental Variables
In the unrestricted specifications that follow we introduce a battery of variables to control for other determinants of regime type, such as per capita income, global and regional democratic diffusion effects, and civil war. We discuss those controls as we deploy them below. We also instrument for Total Oil Income with several measures based on oil reserves, which we discuss further below, to address reverse causation.
DATA ANALYSIS
Before diagnosing the time series properties of our data, and reviewing the results of several multivariate analyses, we first report some basic time series patterns adduced by inspecting and graphing the data for the 168 countries in our dataset. We hasten to emphasize that we are not drawing causal inferences from such a basic visual inspection of the data. Rather, this exercise is intended to provide readers with an idea of what the data look like in time series for each country, as well as to provide a preliminary grouping of the country series on the basis of whether a country appears to be blessed or cursed.
In order to bias in favor of uncovering patterns consistent with the resource curse hypothesis, we take two steps designed to exclude countries that are potentially resource-blessed. First, we decide whether a country is resource-reliant, based on its level of fiscal reliance on resource revenues. Poor, authoritarian governments often obtain significant revenues from natural resources, even if trivial quantities of those resources are produced in an absolute sense, whereas rich, democratic governments typically obtain trivial revenue shares from natural resources, even if large quantities of resources are produced. Second, we set the threshold for resource reliance at a relatively low level: an average of 5% during the period 1972–1999 (for the details see Online Appendix 1). This procedure yields a set of 53 resource-reliant countries. These criteria exclude resource-rich, mature democracies (e.g., the United States, Canada, Australia, and Great Britain), whereas they include authoritarian countries that produce trivial quantities of oil, gas, and minerals (such as Belarus, Tajikistan, and Morocco).
We summarize the patterns revealed after graphing the 53 country series for Polity, Total Resource Income, and Fiscal Reliance (when possible), across their entire histories, in Table 1. For reasons of space we are unable to reproduce all 53 graphs here. We do, however, present the graphs for the 18 countries for which we have data on both Fiscal Reliance and Total Resource Income (see Figures 1–18). We provide the graphs for the remaining countries in our dataset—the 35 other resource-reliant countries, as well as the 115 non–resource reliant countries— in Online Appendix 2, Data Analysis (available at www.journals.cambridge.org/psr2011001).
Potential Resource Blessings
Nineteen of the 53 resource-reliant countries appear to have been blessed by increases in resource reliance. Six countries remained democratic after they experienced resource booms, where democratic means that Polity is 85 or above, following Jaggers and Gurr (1995). Seven countries transitioned to democracy during or after resource booms. Two countries were near-democracies (Polity was 80) before resource booms, and remained at that level during the booms. Four countries were autocracies before they had resource booms, and although they did not reach the threshold for democracy,
5

A Reappraisal of the Resource Curse |
February 2011 |
TABLE 1. Patterns of Potential Resource Blessings and Curses
Panel A: Potentially Resource–blessed Countries
|
|
Remained at Threshold of |
Polity Increased by at |
Remained Democratic |
Democratized during or |
Democracy (Polity = 80) during |
Least One S.D. during or |
during a Resource Boom |
after a Resource Boom |
a Resource Boom |
after a Resource Boom |
|
|
|
|
Jamaica |
Botswana |
Estonia |
Algeria |
Lithuania |
Ecuador |
Namibia |
Angola |
Netherlands |
Mexico |
|
Iran |
Norway |
Mongolia |
|
Kyrgyzstan |
Papua New Guinea |
Peru |
|
|
Trinidad and Tobago |
Russia |
|
|
|
Venezuela |
|
|
|
|
|
|
|
Panel B: Potentially Resource-cursed Countries |
|
|
|
|
|
|
Democratizes after |
Polity Increases by One |
Democracy Fails during or after |
Polity Decreases by One |
Resource Boom |
S.D. When Resource |
a Resource Boom |
S.D. during or after a |
Collapses |
Boom Collapses |
|
Resource Boom |
|
|
|
|
Bolivia |
Dem. Rep. of Congo |
Belarus |
Congo |
Indonesia |
Guinea |
|
|
|
Liberia |
|
|
|
Zambia |
|
|
Panel C: Neither Blessed nor Cursed
Inconclusive: No Discernable Pattern, |
Country Is Autocracy before Boom, and Remains So |
or Movement in Polity Precedes |
Afterward |
Movement in Resources |
|
|
|
Azerbaijan |
Bahrain |
Chile |
Cameroon |
Malaysia |
Egypt |
Niger |
Equatorial Guinea |
Nigeria |
Gabon |
Tunisia |
Iraq |
Ukraine |
Kazakhstan |
|
Kuwait |
|
Libya |
|
Mauritania |
|
Morocco |
|
Oman |
|
Qatar |
|
Saudi Arabia |
|
Tajikastan |
|
Turkmenistan |
|
United Arab Emirates |
|
Vietman |
|
Yemen |
|
|
Note: Polity refers to normalized combined Polity score (0 to 100).
they had at least one–standard deviation increases in Polity (25 points, based on the data’s “within” variation) during or after those booms.
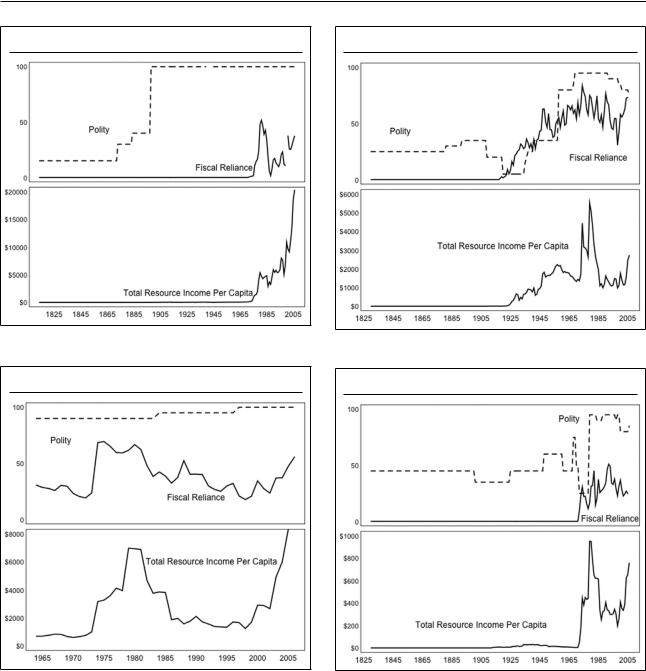
Let us begin with the cases in which a democratic country experienced an oil boom and remained democratic. Norway (Figure 1) is a well-known case that is usually thought of as an exception to the resource curse, but less well known is the experience of
Trinidad and Tobago (Figure 2). Trinidad and Tobago was democratic at independence in 1962, and even though Fiscal Reliance and Total Resource Income increased dramatically in subsequent years—indeed, Trinidad has one of the highest levels of Resource Income Per Capita in the world—Polity continued to tick upward, reaching the maximum score of 100 in the 1990s.
6
American Political Science Review
FIGURE 1. Norway
FIGURE 3. Venezuela
FIGURE 2. Trinidad and Tobago
FIGURE 4. Ecuador
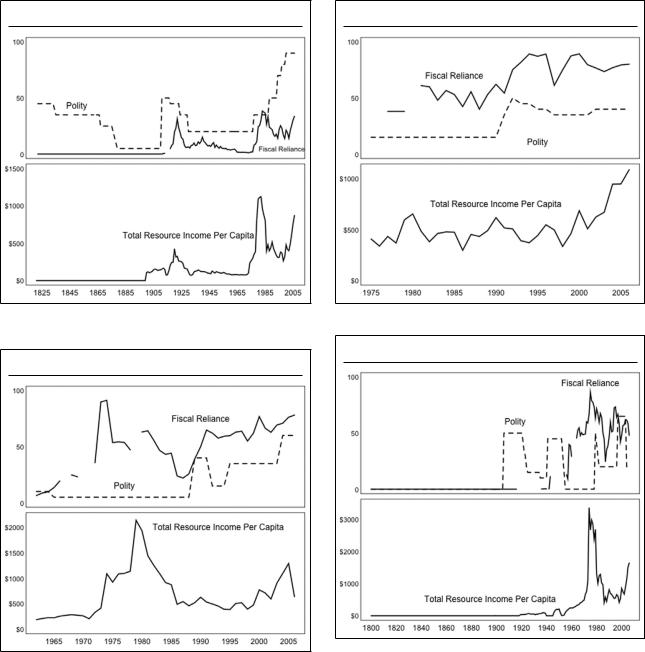
Three of the graphs display data consistent with democratization during a resource boom. Venezuela (Figure 3) has been written about extensively, but other cases, such as Ecuador (Figure 4) and Mexico (Figure 5), are less well known. Mexico is a particularly critical case, because it had two distinct resource booms, punctuated by a long period of decline and stagnation of its oil and mineral sectors: the first boom ran from 1900 to 1924, whereas the second boom has been ongoing since 1974. Mexico’s first resource boom ended after it had exhausted its oil reserves, given the technology of the time (Haber, Razo, and Maurer 2003), but Polity did not increase in the wake of this resource bust, as predicted by the theory of the resource curse. Instead, Mexico saw the heyday of single–party
rule. Mexico’s second resource boom also did not produce the political outcome predicted by the resource curse: as oil rents increased, the Partido Revolucionario Institucional (PRI) gradually lost its viselike grip on power. In 2000, when the PRI finally lost control of the presidency, Fiscal Reliance was four times its 1960s level (23%, as compared to roughly 6%), whereas Total Resource Income had increased sixfold, to $478 per capita. In 2006, when Mexico held a second free and fair election, Fiscal Reliance and Total Resource Income were even higher: 37% and $871 per person, respectively.
An additional three graphs display cases in which Polity increased by at least one standard deviation during a resource boom: Algeria (Figure 6); Angola
7
A Reappraisal of the Resource Curse |
February 2011 |
FIGURE 5. Mexico
FIGURE 7. Angola
FIGURE 6. Algeria
FIGURE 8. Iran
(Figure 7); and Iran (Figure 8). As is well known, none of these countries ever became democratic. Nevertheless, they do not display the patterns that one would expect, given their reputations as being resource-cursed. Iran is a particularly striking example (see Figure 8). When the Shah came to power in 1941, Iran was a trivial producer of petroleum and the government obtained less than 1% of its revenues from natural resources—hardly the “rentier state” that one might imagine from the case that inspired Madhavy’s (1970) theory. Conversely, it was when income from natural resources and fiscal reliance were at all-time highs, in the late 1970s, that Iranian civil society mobilized against the Shah’s repressive dictatorship and overthrew it. In the decade leading up to the
1979 Revolution, Total Resource Income averaged $1,999, whereas Fiscal Reliance averaged 66%. Even more striking, during the period in which Ayatollah Khomeini crushed the revolution’s progressive elements and constructed an Islamic theocracy, Total Resource Income and Fiscal Reliance on that income had collapsed: during the period 1980–1989, Total Resource Income averaged only $894—less than half of its 1970s level—and Fiscal Reliance on that income had fallen as well, to 52%.
Potential Resource Curses
A case can be made for a potential resource curse on the basis of the graphed data in only 8 of the 53
8
American Political Science Review
FIGURE 9. Indonesia
FIGURE 11. Chile
FIGURE 10. Zambia
FIGURE 12. Nigeria
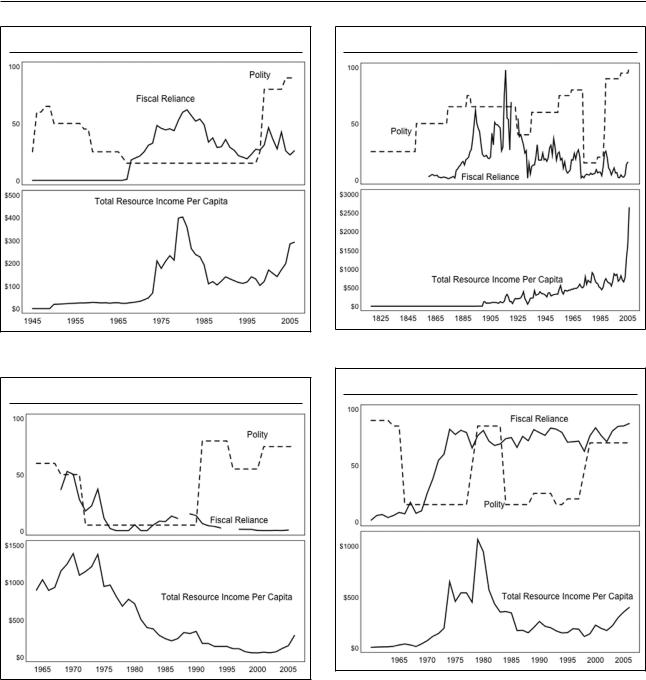
countries, which is surprising, given the generous criteria we have employed to capture the set of resourcereliant countries. Two cases democratized after their resource booms collapsed: Bolivia and Indonesia (Figure 9). In an additional four cases, Polity increased by one standard deviation after the collapse of a resource boom: the Democratic Republic of the Congo, Guinea, Liberia, and Zambia (Figure 10). Of these, Zambia, which at one time was a major copper producer, perhaps makes the strongest case: although it was autocratic during the heyday of its copper production in the 1960s and early 1970s, its fiscal reliance on copper steadily declined from a peak of over 50% to 6% by 1991, at which time its Polity score increased 16-fold.
There is only one case in which democracy failed during or after a resource boom (Belarus), as well as only one case in which Polity declined by at least one standard deviation during or after a resource boom (Congo). In short, potentially resource-blessed countries outnumber potentially resource-cursed countries by a ratio of more than two to one.
One might object that this ratio might be driven by the fact that our criteria for selection into the group of 53 resource-reliant countries allow a number of trivial producers to be included in the potentially blessed set. Lithuania, Kyrgyzstan, and Niger all produced less than $100 on average in Total Resource Income (the mean is $595 for all 168 countries, including those that produce no natural resources at all). By that same standard,
9
A Reappraisal of the Resource Curse |
February 2011 |
FIGURE 13. Bahrain
FIGURE 15. Gabon
FIGURE 14. Equatorial Guinea
FIGURE 16. Kuwait
however, we would also have to exclude three of the eight potentially resource-cursed countries (Belarus, Guinea, and the Democratic Republic of the Congo). The ratio of potentially resource-blessed to potentially resource-cursed countries would therefore increase: to more than three to one.
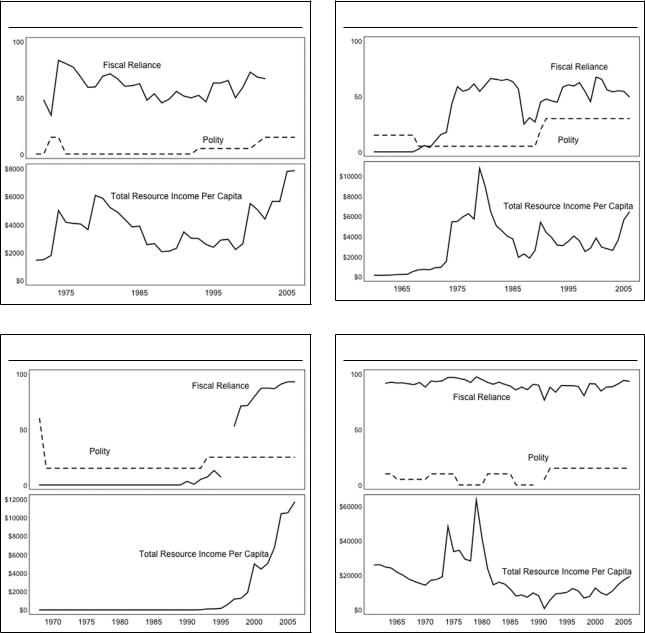
What are we to make of the remaining 26 cases? Seven are inconclusive: either they display no discernable pattern, such as in Chile and Nigeria (Figures 11 and 12, respectively), or substantial movements in Polity precede movements in Total Resource Income. The remaining 19 are cases that were autocratic prior to the discovery of natural resources, and remained autocratic after they experienced resource booms. They also failed to democratize in the wake of the collapse of their resource incomes in the 1980s and 1990s. We
graph the series for six cases for which we have data on both Fiscal Reliance and Total Resource Income: Bahrain (Figure 13), Equatorial Guinea (Figure 14), Gabon (Figure 15), Kuwait (Figure 16), Oman (Fig ure 17), and Yemen (Figure 18). The most reasonable interpretation of these 19 cases is that natural resources and authoritarianism are unrelated.
In keeping with our goal of biasing in favor of uncovering patterns consistent with a resource curse, we would like to argue that these 19 countries would have democratized in the absence of oil and mineral reliance. In order to do so, however, we would have to set aside three inconvenient facts about them: (1) they are clustered in two geographic areas of the world; (2) they have long legacies of authoritarianism that antedate their oil discoveries; (3) the non–oil producing
10