

Phedotikov / 1 / FreeEnergy_27.01.08 / Схемотехнические / Генератор Steven Mark / TPU_ECD-V1_0
.pdfTechnical Relation |
TPU=ECD |
Pag 31 of 55 |
|
|
|
PART TWO
ECD
testing & understanding
By Otto Sabljaric
&
Roberto Notte
Version: TPU=ECD-V_1_0
Document printed on 09/06/2007
Technical Relation |
TPU=ECD |
Pag 32 of 55 |
|
|
|
6. INTRODUCTION
After the full conversion event that led to damaging of almost all the Otto’s equipment there was of course a stop due to the impossibility to do anything.
At this time Roberto Notte contacted Otto Sabljaric and soon after went to his laboratory for 7 days to help him in fixing the damaged equipment and running together a complete set of live tests.
Said philosophy, joining two very different way of thinking, really with our great surprise led us to see many fundamental aspect till now gone unnoticed and to an almost full understanding at least about the phenomena that were playing in front of our eyes. This kind of cooperation proved also useful to speed-up all the test-work. We were excited and worked on a day-night schedule till obtained wanted results/documentation.
What it follows is a complete living log about a series of tests and techniques applied to full understand the events. You will see that during the tests we stumbled into several additional Breakthrough.
6.1 TESTS WITH 2 CC WITH SERIES SECONDARY CONNECTION
Batch #1
Date |
05.31.2007 |
Start time |
9:53 AM |
CC |
2 with secondary in series |
Freq |
1,2 |
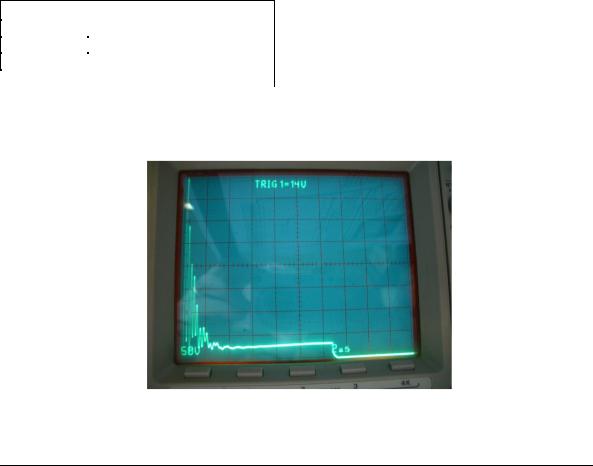
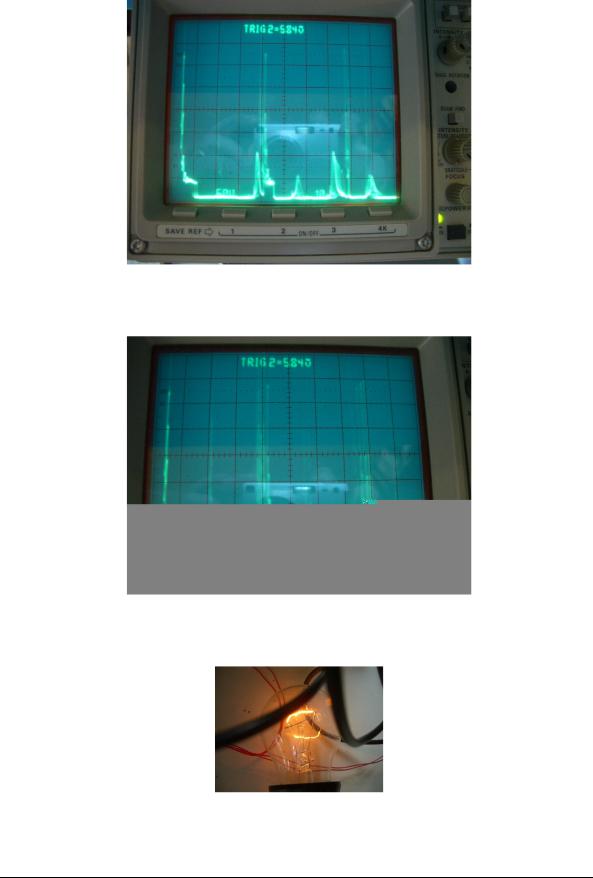
This batch started at 9.53 AM with F1=40 KHz. The scope probe on ZERO point, 60W/230V light-bulb connected between ZERO and PHASE points. The scope zerolevel is set on the screen bottom line. CC temperature about 40°C.
Fig. 11 RE peaks summing on leading pulse edge with 1 Freq.
Version: TPU=ECD-V_1_0
Document printed on 09/06/2007

Technical Relation |
TPU=ECD |
Pag 33 of 55 |
In this picture (11) is evident that RE spikes (about 400V max) are sitting on the waveform leading edge just on top and lasting for about 2 sec and partially summingup themselves.
Fig. 12 ZERO POINT - RE peaks summing on leading pulse edge with 2 Freq.
On fig 12 we pulsed the 2 CC coils with 2 freqs, the probe on the first MOSFET Drain, scope zero level on bottom of the screen, CC temperature about 50°C. It appears that the main RE peak amplitude increased to about +500V (out of the screen) and the peaks summing effect much more strong.
Please look at the artifact on the baseline: what do you think is it? Well on the first we thought just it was just hash. Later I’ll show the meaning…one of the secret of this Breakthrough.
Fig. 13 An enlargement of fig. 11
You can see more info about RE peaks:
Version: TPU=ECD-V_1_0
Document printed on 09/06/2007
Technical Relation |
TPU=ECD |
Pag 34 of 55 |
•Peak’s summing is evident.
•Resonance is about 3.3MHz. This appear now as an NMR typical dumped waveform with 4 – 6 oscillations.
What follows is the signal actually on both MOSFET’s gates, they do seem synched, but they are not.
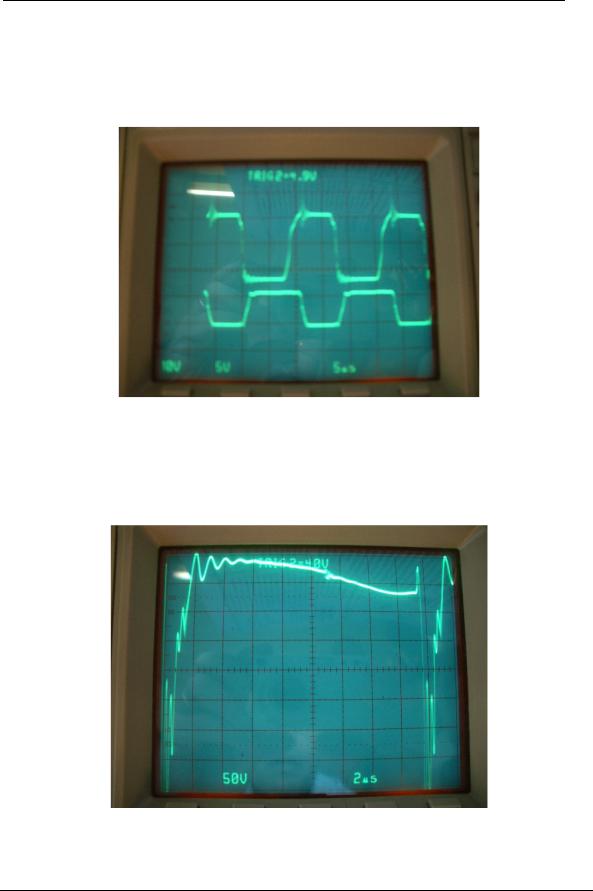
Fig. 14 Signal on MOSFET’s gates
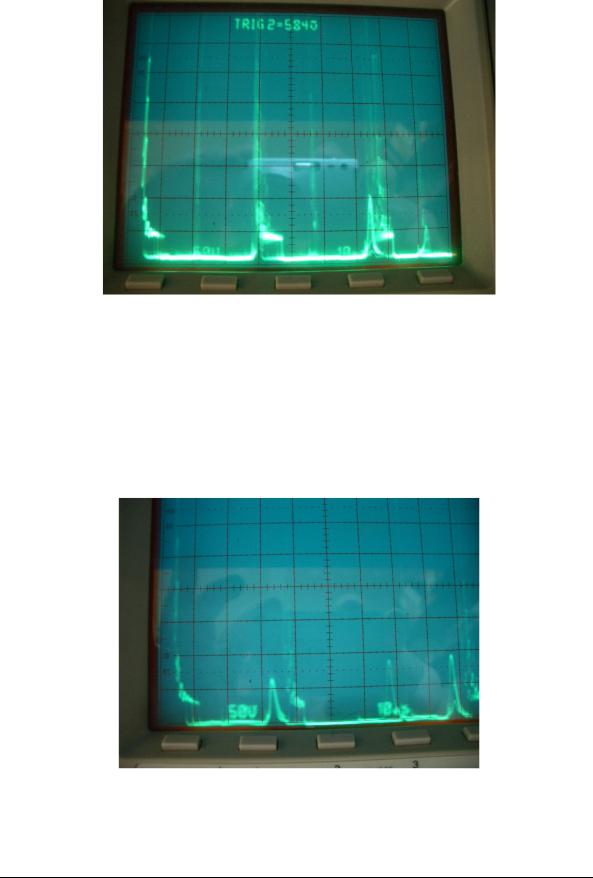
Following pictures (15, 16)) are taken after putting scope probe on ‘PHASE’ point, the 0 scope level is set to top screen line. The waveform in this case is all in the 4th quadrant (all negative) and symmetrical but somehow different from that taken on ‘ZERO’ point (compare with fig.11).
Fig. 15 PHASE point - RE peaks summing on leading pulse edge with 2 Freq.
Version: TPU=ECD-V_1_0
Document printed on 09/06/2007

Technical Relation |
TPU=ECD |
Pag 35 of 55 |
Overall amplitude is about -500V and the peaks connecting line is no more straight but….start appearing something like a sinusoidal waveform. Please take also note that there is still the small artifact on the center of the sinus.
What it follows is an enlargement of fig 14.
Fig. 16 Time enlargement of Fig. 14
Version: TPU=ECD-V_1_0
Document printed on 09/06/2007
|
Technical Relation |
TPU=ECD |
Pag 36 of 55 |
||
|
|
|
|
|
|
|
|
|
|
|
|
|
Batch #2 |
|
|
|
|
|
Date |
05.31.2007 |
|
|
|
|
Start time |
11:12 AM |
|
|
|
|
CC |
2 with secondary in series |
|
|
|
|
Freq |
1,2,3 |
|
|
|
Let us now use 3 frequencies adj (on both CC are applied 3 frequencies) and put the probe on ZERO point. Zero scope level is on bottom line.
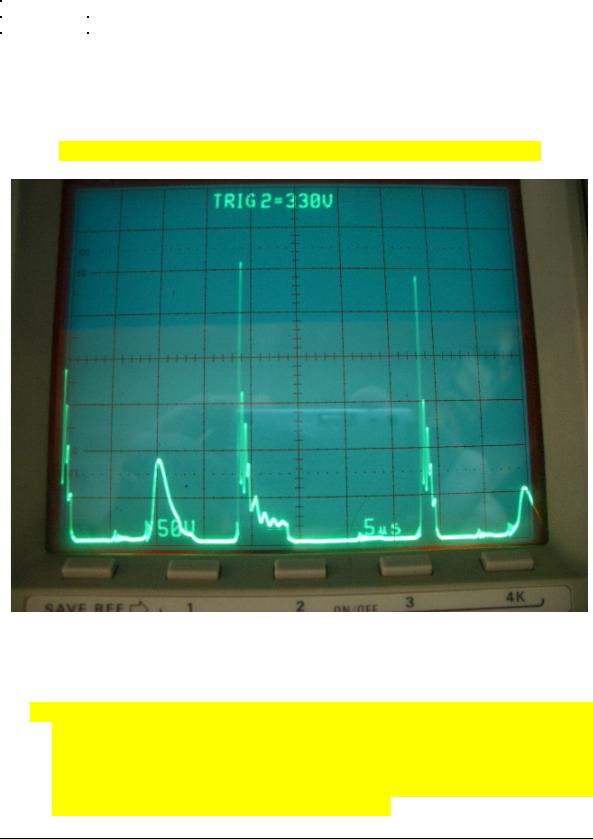
This picture is fundamental, please give it the attention it deserves.
Fig. 17 Start of Conversion process.
The situation as we have after discovered is to be interpreted like this:
1.it is possible to see, starting on the left a first RE ‘special peak’ followed by a small artifact that from now on we will call the ‘Seed’,
2.there’s another Seed just on the start of a piece of a sinusoidal wave; well that Seed is just ‘CREATING’ the piece of sinus!! In this process (not possible to show in a single frame but easily seen if filmed) the Seed does swallow a single ‘special peak’ that was in that same location by converting it in a piece (about +100V) of sinusoidal waveform. It seems incredible but believe me: it was right so showing in front of our eyes.
Version: TPU=ECD-V_1_0
Document printed on 09/06/2007
Technical Relation |
TPU=ECD |
Pag 37 of 55 |
3.It follows a DC pulse +RE spikes and then again one Seed followed by a still ‘special peak’ that could be converted just adj the oscillator with lowest range (F2). Varying F2 does actually slide from left to right the Seed.
4.then another Seed and another Seed doing another conversion (at screen right end).
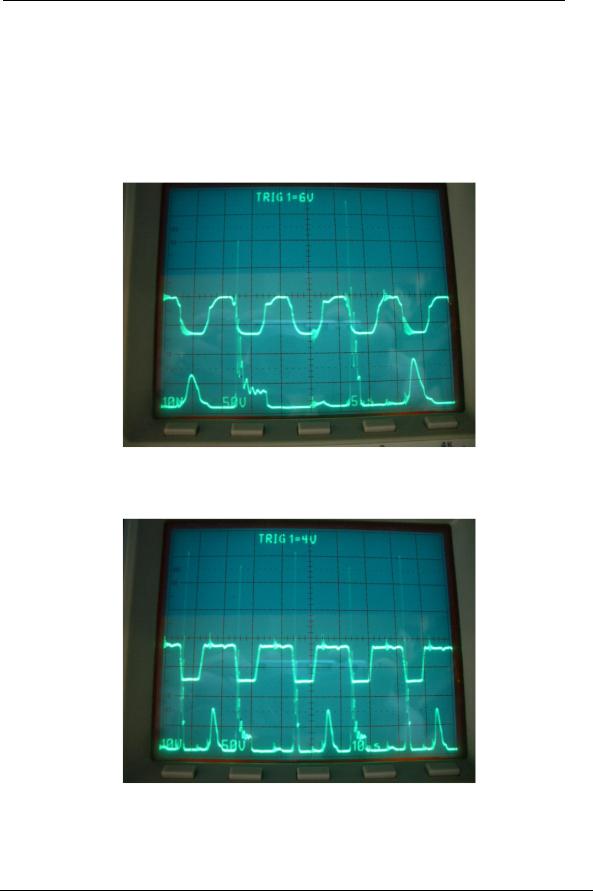
Here it follows another picture for the highest applied frequency and referencing Gate signal (on top) and ZERO signal (on bottom waveform).
Fig. 18 Time relation between ZERO and F3
With it follows is just another Conversion example (every 4 input cycles).
Fig. 19 Time relation between ZERO and F3
In this case we have conversion every 3 input cycles.
Version: TPU=ECD-V_1_0
Document printed on 09/06/2007

Technical Relation |
TPU=ECD |
Pag 38 of 55 |
Summarizing:
It seems that we are experiencing a partial Energy conversion into sinusoidal pure wave every 3 or 4 input cycle.
In following picture we will try to show you in more details the creation process. Looking at following picture we can see 3 pieces of partially converted sinusoidal waveforms taken on ZERO point.
Fig. 20 Detailed sinus forming
You can see on the left that:
1.at 35 sec there’s a almost complete formed big sinus that it’s trying to swallow a near ‘special peak’ (to get bigger and more well formed…), peak sinus amplitude > +110V (zero Dc scope level on bottom line).
2.at 60 sec there is forming a sinus,
3.at 80 sec there is the clear indication of a new sinus forming by the Seed in it’s left side (just near the sinus start point) . Of course the picture is blurred as there is work-in-progress and the scope synchronism is not able to catch on!
In this case the 3 input freqs were:
•F1 = 27.77 KHz
•F2 = 60.606 KHz
•F3 = 52,631 KHz
Now you can see a more refined freqs adj leading to the next picture.
Version: TPU=ECD-V_1_0
Document printed on 09/06/2007
Technical Relation |
TPU=ECD |
Pag 39 of 55 |
|
|
|
Fig. 21 3 created sinus
In this picture you can see 4 sinusoidal waves at various creation state: 2 well formed and 2 in creation. There it follows next freqs adj.
Fig. 22 Peak incorporation
It seems that a sine wave is very near to the second peak just being incorporated in it. At this moment this is the light on a 100W/230V light bulb.
Fig. 23 Light bulb 100W/230V
After adj again the 3 freqs we do obtain following situation.
Version: TPU=ECD-V_1_0
Document printed on 09/06/2007
Technical Relation |
TPU=ECD |
Pag 40 of 55 |
|
|
|
Fig. 24 Sine waves incorporating peaks
It appears that:
1.the first sine wave has joined the second kick,
2.the second sine wave is now near the 3d kick,
3.we do see a ‘pumping’ effect on PS analog voltage meter (voltage goes up & down from +12 to +21V @ Shuman freq.
Continuing to refine the 3 freq settings, when you are near the correct sweet point we note that the PS is less tampered with and voltage indication return to normal level (+12V).
Fig. 25
Now we clearly see that there is indeed a stable sine wave just near the second kick and near the 3rd kick and a just starting another sine wave between the second and the 3rd kick.
Version: TPU=ECD-V_1_0
Document printed on 09/06/2007