

- •Textbook Series
- •Contents
- •1 Overview and Definitions
- •Overview
- •General Definitions
- •Glossary
- •List of Symbols
- •Greek Symbols
- •Others
- •Self-assessment Questions
- •Answers
- •2 The Atmosphere
- •Introduction
- •The Physical Properties of Air
- •Static Pressure
- •Temperature
- •Air Density
- •International Standard Atmosphere (ISA)
- •Dynamic Pressure
- •Key Facts
- •Measuring Dynamic Pressure
- •Relationships between Airspeeds
- •Airspeed
- •Errors and Corrections
- •V Speeds
- •Summary
- •Questions
- •Answers
- •3 Basic Aerodynamic Theory
- •The Principle of Continuity
- •Bernoulli’s Theorem
- •Streamlines and the Streamtube
- •Summary
- •Questions
- •Answers
- •4 Subsonic Airflow
- •Aerofoil Terminology
- •Basics about Airflow
- •Two Dimensional Airflow
- •Summary
- •Questions
- •Answers
- •5 Lift
- •Aerodynamic Force Coefficient
- •The Basic Lift Equation
- •Review:
- •The Lift Curve
- •Interpretation of the Lift Curve
- •Density Altitude
- •Aerofoil Section Lift Characteristics
- •Introduction to Drag Characteristics
- •Lift/Drag Ratio
- •Effect of Aircraft Weight on Minimum Flight Speed
- •Condition of the Surface
- •Flight at High Lift Conditions
- •Three Dimensional Airflow
- •Wing Terminology
- •Wing Tip Vortices
- •Wake Turbulence: (Ref: AIC P 072/2010)
- •Ground Effect
- •Conclusion
- •Summary
- •Answers from page 77
- •Answers from page 78
- •Questions
- •Answers
- •6 Drag
- •Introduction
- •Parasite Drag
- •Induced Drag
- •Methods of Reducing Induced Drag
- •Effect of Lift on Parasite Drag
- •Aeroplane Total Drag
- •The Effect of Aircraft Gross Weight on Total Drag
- •The Effect of Altitude on Total Drag
- •The Effect of Configuration on Total Drag
- •Speed Stability
- •Power Required (Introduction)
- •Summary
- •Questions
- •Annex C
- •Answers
- •7 Stalling
- •Introduction
- •Cause of the Stall
- •The Lift Curve
- •Stall Recovery
- •Aircraft Behaviour Close to the Stall
- •Use of Flight Controls Close to the Stall
- •Stall Recognition
- •Stall Speed
- •Stall Warning
- •Artificial Stall Warning Devices
- •Basic Stall Requirements (EASA and FAR)
- •Wing Design Characteristics
- •The Effect of Aerofoil Section
- •The Effect of Wing Planform
- •Key Facts 1
- •Super Stall (Deep Stall)
- •Factors that Affect Stall Speed
- •1g Stall Speed
- •Effect of Weight Change on Stall Speed
- •Composition and Resolution of Forces
- •Using Trigonometry to Resolve Forces
- •Lift Increase in a Level Turn
- •Effect of Load Factor on Stall Speed
- •Effect of High Lift Devices on Stall Speed
- •Effect of CG Position on Stall Speed
- •Effect of Landing Gear on the Stall Speed
- •Effect of Engine Power on Stall Speed
- •Effect of Mach Number (Compressibility) on Stall Speed
- •Effect of Wing Contamination on Stall Speed
- •Warning to the Pilot of Icing-induced Stalls
- •Stabilizer Stall Due to Ice
- •Effect of Heavy Rain on Stall Speed
- •Stall and Recovery Characteristics of Canards
- •Spinning
- •Primary Causes of a Spin
- •Phases of a Spin
- •The Effect of Mass and Balance on Spins
- •Spin Recovery
- •Special Phenomena of Stall
- •High Speed Buffet (Shock Stall)
- •Answers to Questions on Page 173
- •Key Facts 2
- •Questions
- •Key Facts 1 (Completed)
- •Key Facts 2 (Completed)
- •Answers
- •8 High Lift Devices
- •Purpose of High Lift Devices
- •Take-off and Landing Speeds
- •Augmentation
- •Flaps
- •Trailing Edge Flaps
- •Plain Flap
- •Split Flap
- •Slotted and Multiple Slotted Flaps
- •The Fowler Flap
- •Comparison of Trailing Edge Flaps
- •and Stalling Angle
- •Drag
- •Lift / Drag Ratio
- •Pitching Moment
- •Centre of Pressure Movement
- •Change of Downwash
- •Overall Pitch Change
- •Aircraft Attitude with Flaps Lowered
- •Leading Edge High Lift Devices
- •Leading Edge Flaps
- •Effect of Leading Edge Flaps on Lift
- •Leading Edge Slots
- •Leading Edge Slat
- •Automatic Slots
- •Disadvantages of the Slot
- •Drag and Pitching Moment of Leading Edge Devices
- •Trailing Edge Plus Leading Edge Devices
- •Sequence of Operation
- •Asymmetry of High Lift Devices
- •Flap Load Relief System
- •Choice of Flap Setting for Take-off, Climb and Landing
- •Management of High Lift Devices
- •Flap Extension Prior to Landing
- •Questions
- •Annexes
- •Answers
- •9 Airframe Contamination
- •Introduction
- •Types of Contamination
- •Effect of Frost and Ice on the Aircraft
- •Effect on Instruments
- •Effect on Controls
- •Water Contamination
- •Airframe Aging
- •Questions
- •Answers
- •10 Stability and Control
- •Introduction
- •Static Stability
- •Aeroplane Reference Axes
- •Static Longitudinal Stability
- •Neutral Point
- •Static Margin
- •Trim and Controllability
- •Key Facts 1
- •Graphic Presentation of Static Longitudinal Stability
- •Contribution of the Component Surfaces
- •Power-off Stability
- •Effect of CG Position
- •Power Effects
- •High Lift Devices
- •Control Force Stability
- •Manoeuvre Stability
- •Stick Force Per ‘g’
- •Tailoring Control Forces
- •Longitudinal Control
- •Manoeuvring Control Requirement
- •Take-off Control Requirement
- •Landing Control Requirement
- •Dynamic Stability
- •Longitudinal Dynamic Stability
- •Long Period Oscillation (Phugoid)
- •Short Period Oscillation
- •Directional Stability and Control
- •Sideslip Angle
- •Static Directional Stability
- •Contribution of the Aeroplane Components.
- •Lateral Stability and Control
- •Static Lateral Stability
- •Contribution of the Aeroplane Components
- •Lateral Dynamic Effects
- •Spiral Divergence
- •Dutch Roll
- •Pilot Induced Oscillation (PIO)
- •High Mach Numbers
- •Mach Trim
- •Key Facts 2
- •Summary
- •Questions
- •Key Facts 1 (Completed)
- •Key Facts 2 (Completed)
- •Answers
- •11 Controls
- •Introduction
- •Hinge Moments
- •Control Balancing
- •Mass Balance
- •Longitudinal Control
- •Lateral Control
- •Speed Brakes
- •Directional Control
- •Secondary Effects of Controls
- •Trimming
- •Questions
- •Answers
- •12 Flight Mechanics
- •Introduction
- •Straight Horizontal Steady Flight
- •Tailplane and Elevator
- •Balance of Forces
- •Straight Steady Climb
- •Climb Angle
- •Effect of Weight, Altitude and Temperature.
- •Power-on Descent
- •Emergency Descent
- •Glide
- •Rate of Descent in the Glide
- •Turning
- •Flight with Asymmetric Thrust
- •Summary of Minimum Control Speeds
- •Questions
- •Answers
- •13 High Speed Flight
- •Introduction
- •Speed of Sound
- •Mach Number
- •Effect on Mach Number of Climbing at a Constant IAS
- •Variation of TAS with Altitude at a Constant Mach Number
- •Influence of Temperature on Mach Number at a Constant Flight Level and IAS
- •Subdivisions of Aerodynamic Flow
- •Propagation of Pressure Waves
- •Normal Shock Waves
- •Critical Mach Number
- •Pressure Distribution at Transonic Mach Numbers
- •Properties of a Normal Shock Wave
- •Oblique Shock Waves
- •Effects of Shock Wave Formation
- •Buffet
- •Factors Which Affect the Buffet Boundaries
- •The Buffet Margin
- •Use of the Buffet Onset Chart
- •Delaying or Reducing the Effects of Compressibility
- •Aerodynamic Heating
- •Mach Angle
- •Mach Cone
- •Area (Zone) of Influence
- •Bow Wave
- •Expansion Waves
- •Sonic Bang
- •Methods of Improving Control at Transonic Speeds
- •Questions
- •Answers
- •14 Limitations
- •Operating Limit Speeds
- •Loads and Safety Factors
- •Loads on the Structure
- •Load Factor
- •Boundary
- •Design Manoeuvring Speed, V
- •Effect of Altitude on V
- •Effect of Aircraft Weight on V
- •Design Cruising Speed V
- •Design Dive Speed V
- •Negative Load Factors
- •The Negative Stall
- •Manoeuvre Boundaries
- •Operational Speed Limits
- •Gust Loads
- •Effect of a Vertical Gust on the Load Factor
- •Effect of the Gust on Stalling
- •Operational Rough-air Speed (V
- •Landing Gear Speed Limitations
- •Flap Speed Limit
- •Aeroelasticity (Aeroelastic Coupling)
- •Flutter
- •Control Surface Flutter
- •Aileron Reversal
- •Questions
- •Answers
- •15 Windshear
- •Introduction (Ref: AIC 84/2008)
- •Microburst
- •Windshear Encounter during Approach
- •Effects of Windshear
- •“Typical” Recovery from Windshear
- •Windshear Reporting
- •Visual Clues
- •Conclusions
- •Questions
- •Answers
- •16 Propellers
- •Introduction
- •Definitions
- •Aerodynamic Forces on the Propeller
- •Thrust
- •Centrifugal Twisting Moment (CTM)
- •Propeller Efficiency
- •Variable Pitch Propellers
- •Power Absorption
- •Moments and Forces Generated by a Propeller
- •Effect of Atmospheric Conditions
- •Questions
- •Answers
- •17 Revision Questions
- •Questions
- •Answers
- •Explanations to Specimen Questions
- •Specimen Examination Paper
- •Answers to Specimen Exam Paper
- •Explanations to Specimen Exam Paper
- •18 Index

Limitations
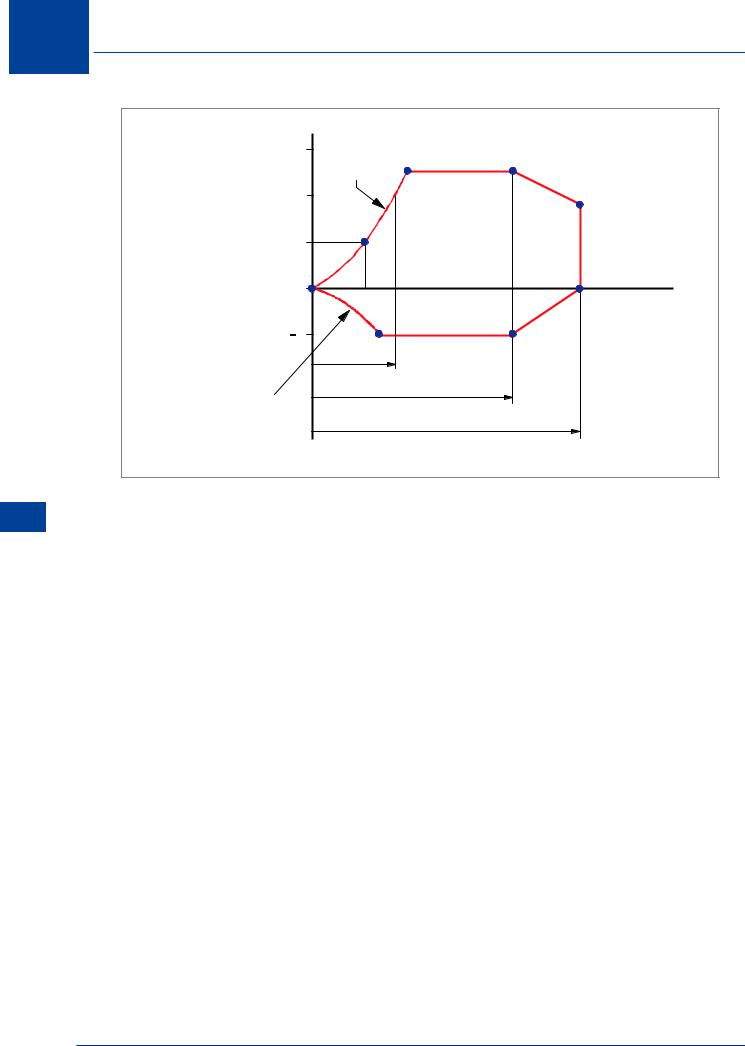
The Manoeuvre Envelope (V - n Diagram)
The maximum load factors which must be allowed for during manoeuvres are shown in an envelope of load factor against speed (EAS). Figure 14.1 shows a typical manoeuvre envelope or V - n diagram.
The limit load factors will depend on the design category of the aircraft.
The EASA regulations state that:
a)For normal category aircraft, the positive limit load factor may not be less than 2.5 and need not be more than 3.8.
(So that structural weight can be kept to an absolute minimum, a manufacturer will not design an aircraft to be any stronger than the minimum required by the regulations).
The positive limit load factor for modern high speed jet transport aircraft is 2.5.
b)For utility category aircraft the positive limit load factor is 4.4
c)For aerobatic category aircraft the positive limit load factor is 6.0
The negative limit load factor may not be less than:
d)-1.0 for normal category aircraft
e)-1.76 for utility category aircraft
f)-3.0 for aerobatic category aircraft
The CLMAX Boundary
The line OA in Figure 14.1 is determined by the CLMAX of the aircraft. In theory, the lift, and hence the load factor for a given weight, depends on the angle of attack of the wing and the
airspeed. The maximum possible lift will occur at the angle of attack where CL is a maximum. At this angle of attack the lift will increase with speed as shown by the line OA.
For level (1g) flight the speed at CLMAX will be the stalling speed (VS), represented by point S in
Figure 14.1.
At Point A, the load factor reaches its positive limit.
14
Limitations 14
461
14 Limitations
Limitations 14
It can be seen from Figure 14.2 that at speeds below point A the wing cannot produce a lift force equal to the limit load factor, whereas at speeds above point A the limit load factor can be exceeded. Manoeuvres at speeds above point A therefore have the potential to cause permanent deformation to the structure or structural failure if the ultimate load is exceeded.
This does not mean that any manoeuvre at a speed greater than point A will always cause structural damage; manoeuvres may be performed safely provided that the limit load factor is not exceeded.
PERMANENT DEFORMATION OF STRUCTURE POSSIBLE
4 |
STRUCTURAL FAILURE |
ULTIMATE |
||
LOAD FACTOR |
||||
|
|
|
||
|
|
UNSAFE |
FACTOR |
|
3 |
|
OF |
||
A |
MANOEUVRE |
SAFETY (1 5) |
||
|
||||
|
|
|
||
|
10 |
POSITIVE LIMIT LOAD FACTOR |
||
2 |
|
|
||
|
STALL |
|
|
|
|
ANGLE |
SAFE |
|
|
|
5 |
|
||
1 |
MANOEUVRE |
|
||
|
|
|
||
O |
|
|
SPEED (EAS) |
|
|
|
|
||
Figure 14.2 Loads imposed during manoeuvres
There is, of course, a safety factor on the airframe of 1.5 so complete failure of the structure will not occur at the load factor of 2.5 but at 2.5 × 1.5 = 3.75.
However, permanent deformation of the structure may occur at load factors between 2.5 and 3.75, so it is not safe to assume that the load factor may be increased above the limiting value just because there is a safety factor.
Design Manoeuvring Speed, VA
The highest speed at which sudden, full elevator deflection (nose-up) can be made without exceeding the design limit load factor.
When establishing VA the aeroplane is assumed to be flying in steady level flight, at point A1 in Figure 14.3, and the pitch control is suddenly moved to obtain extreme positive pitch
acceleration (nose-up). VA is slower than the speed at the intersection of the CLMAX line and the positive limit load factor line (point A) to safeguard the tail structure because of the higher load
on the tailplane during the pitch manoeuvre (Ref. Page 274, Chapter 10, Manoeuvre Stability).
462

|
|
|
Limitations |
14 |
3 |
C L MAX WING FLAPS UP |
|
|
|
|
|
A |
|
|
2 |
|
|
|
|
1 |
|
A1 |
|
|
|
|
|
|
|
|
|
VC |
VD |
|
0 |
Vs 1 |
VA |
|
|
|
|
|
||
-1 |
|
|
|
|
Figure 14.3 Design manoeuvring speed VA
Line OA in Figure 14.3 represents the variation of stalling speed with load factor. Stalling speed increases with the square root of the load factor, therefore;
VA = VS1g √ n
For example an aircraft with a 1g stalling speed of 60 kt and limit load factor of 2.5 would have a VA of:
60 √ 2.5 = 95 kt
Limitations 14
Effect of Altitude on VA
At high altitude the equivalent stalling speed increases with ‘g’ rather more rapidly than at sea level because of the Mach number effect on CLMAX. Above a certain altitude the buffet boundary may intersect the stall boundary at a value of ‘g’ lower than the structural limit, thus VA will become more limiting at high altitude (Please refer to Figure 13.25 for a diagram).
Effect of Aircraft Weight on VA
The 1g stalling speed depends on the weight of the aircraft. The line OA is drawn for the maximum design weight, so for lower weights the stalling speed will be less.
For the same limit load factor VA will therefore decrease. For the example considered above, if VA is 95 kt at 2500 lb weight, then at 2000 lb weight it will be:
2000 |
|
95 √2500 |
= 85 kt |
Note: 20% decrease in weight has given approximately 10% decrease in VA.
463
14 Limitations
Limitations 14
|
3 |
POSITIVE |
A |
C |
|
|
|
CLMAX |
|
||
|
2 |
|
|
D |
|
|
1 |
S |
|
|
|
|
|
|
|
|
|
|
|
|
|
E |
SPEED |
|
O |
VS |
|
(EAS) |
|
|
|
|
|
||
|
|
|
|
|
|
|
1 |
H |
|
F |
|
|
|
|
|
||
NEGATIVE |
CLMAX |
|
VA |
|
|
|
|
VC |
|
||
|
|
|
|
|
|
|
|
|
|
VD |
|
Figure 14.4 The manoeuvre envelope
Design Cruising Speed VC
Point ‘C’ in Figure 14.4 is the design cruise speed VC. This is a speed selected by the designer and used to assess the strength requirements in the cruise. Its value is determined by the requirements CS-25.335 and CS-23.335. It must give adequate spacing from VB (see page 467) and VD to allow for speed upsets. For example CS-25 requires VC to be at least 43 kt above VB, and not greater than 0.8 VD. CS-23 has similar requirements. VC need not exceed the maximum speed in level flight at maximum continuous power (VH) or in CS-23, 0.9 VH at sea level
Design Dive Speed VD
Point ‘D’ in Figure 14.4 is the design dive speed VD. This is the maximum speed which has to be considered when assessing the strength of the aircraft. It is based on the principle of an upset occurring when the aircraft is flying at VC, resulting in a shallow dive, during which the speed increases, until recovery is effected. If the resulting speed is not suitable because of buffet or other high speed effects, a demonstrated speed may be used. This is called VDF, the flight demonstrated design dive speed.
Negative Load Factors
In normal flying and manoeuvres it is not likely that very large negative ‘g’ forces will be produced; however, some negative ‘g’ forces may occur during manoeuvres and the aircraft must be made strong enough to withstand them.
464