

- •Textbook Series
- •Contents
- •1 Overview and Definitions
- •Overview
- •General Definitions
- •Glossary
- •List of Symbols
- •Greek Symbols
- •Others
- •Self-assessment Questions
- •Answers
- •2 The Atmosphere
- •Introduction
- •The Physical Properties of Air
- •Static Pressure
- •Temperature
- •Air Density
- •International Standard Atmosphere (ISA)
- •Dynamic Pressure
- •Key Facts
- •Measuring Dynamic Pressure
- •Relationships between Airspeeds
- •Airspeed
- •Errors and Corrections
- •V Speeds
- •Summary
- •Questions
- •Answers
- •3 Basic Aerodynamic Theory
- •The Principle of Continuity
- •Bernoulli’s Theorem
- •Streamlines and the Streamtube
- •Summary
- •Questions
- •Answers
- •4 Subsonic Airflow
- •Aerofoil Terminology
- •Basics about Airflow
- •Two Dimensional Airflow
- •Summary
- •Questions
- •Answers
- •5 Lift
- •Aerodynamic Force Coefficient
- •The Basic Lift Equation
- •Review:
- •The Lift Curve
- •Interpretation of the Lift Curve
- •Density Altitude
- •Aerofoil Section Lift Characteristics
- •Introduction to Drag Characteristics
- •Lift/Drag Ratio
- •Effect of Aircraft Weight on Minimum Flight Speed
- •Condition of the Surface
- •Flight at High Lift Conditions
- •Three Dimensional Airflow
- •Wing Terminology
- •Wing Tip Vortices
- •Wake Turbulence: (Ref: AIC P 072/2010)
- •Ground Effect
- •Conclusion
- •Summary
- •Answers from page 77
- •Answers from page 78
- •Questions
- •Answers
- •6 Drag
- •Introduction
- •Parasite Drag
- •Induced Drag
- •Methods of Reducing Induced Drag
- •Effect of Lift on Parasite Drag
- •Aeroplane Total Drag
- •The Effect of Aircraft Gross Weight on Total Drag
- •The Effect of Altitude on Total Drag
- •The Effect of Configuration on Total Drag
- •Speed Stability
- •Power Required (Introduction)
- •Summary
- •Questions
- •Annex C
- •Answers
- •7 Stalling
- •Introduction
- •Cause of the Stall
- •The Lift Curve
- •Stall Recovery
- •Aircraft Behaviour Close to the Stall
- •Use of Flight Controls Close to the Stall
- •Stall Recognition
- •Stall Speed
- •Stall Warning
- •Artificial Stall Warning Devices
- •Basic Stall Requirements (EASA and FAR)
- •Wing Design Characteristics
- •The Effect of Aerofoil Section
- •The Effect of Wing Planform
- •Key Facts 1
- •Super Stall (Deep Stall)
- •Factors that Affect Stall Speed
- •1g Stall Speed
- •Effect of Weight Change on Stall Speed
- •Composition and Resolution of Forces
- •Using Trigonometry to Resolve Forces
- •Lift Increase in a Level Turn
- •Effect of Load Factor on Stall Speed
- •Effect of High Lift Devices on Stall Speed
- •Effect of CG Position on Stall Speed
- •Effect of Landing Gear on the Stall Speed
- •Effect of Engine Power on Stall Speed
- •Effect of Mach Number (Compressibility) on Stall Speed
- •Effect of Wing Contamination on Stall Speed
- •Warning to the Pilot of Icing-induced Stalls
- •Stabilizer Stall Due to Ice
- •Effect of Heavy Rain on Stall Speed
- •Stall and Recovery Characteristics of Canards
- •Spinning
- •Primary Causes of a Spin
- •Phases of a Spin
- •The Effect of Mass and Balance on Spins
- •Spin Recovery
- •Special Phenomena of Stall
- •High Speed Buffet (Shock Stall)
- •Answers to Questions on Page 173
- •Key Facts 2
- •Questions
- •Key Facts 1 (Completed)
- •Key Facts 2 (Completed)
- •Answers
- •8 High Lift Devices
- •Purpose of High Lift Devices
- •Take-off and Landing Speeds
- •Augmentation
- •Flaps
- •Trailing Edge Flaps
- •Plain Flap
- •Split Flap
- •Slotted and Multiple Slotted Flaps
- •The Fowler Flap
- •Comparison of Trailing Edge Flaps
- •and Stalling Angle
- •Drag
- •Lift / Drag Ratio
- •Pitching Moment
- •Centre of Pressure Movement
- •Change of Downwash
- •Overall Pitch Change
- •Aircraft Attitude with Flaps Lowered
- •Leading Edge High Lift Devices
- •Leading Edge Flaps
- •Effect of Leading Edge Flaps on Lift
- •Leading Edge Slots
- •Leading Edge Slat
- •Automatic Slots
- •Disadvantages of the Slot
- •Drag and Pitching Moment of Leading Edge Devices
- •Trailing Edge Plus Leading Edge Devices
- •Sequence of Operation
- •Asymmetry of High Lift Devices
- •Flap Load Relief System
- •Choice of Flap Setting for Take-off, Climb and Landing
- •Management of High Lift Devices
- •Flap Extension Prior to Landing
- •Questions
- •Annexes
- •Answers
- •9 Airframe Contamination
- •Introduction
- •Types of Contamination
- •Effect of Frost and Ice on the Aircraft
- •Effect on Instruments
- •Effect on Controls
- •Water Contamination
- •Airframe Aging
- •Questions
- •Answers
- •10 Stability and Control
- •Introduction
- •Static Stability
- •Aeroplane Reference Axes
- •Static Longitudinal Stability
- •Neutral Point
- •Static Margin
- •Trim and Controllability
- •Key Facts 1
- •Graphic Presentation of Static Longitudinal Stability
- •Contribution of the Component Surfaces
- •Power-off Stability
- •Effect of CG Position
- •Power Effects
- •High Lift Devices
- •Control Force Stability
- •Manoeuvre Stability
- •Stick Force Per ‘g’
- •Tailoring Control Forces
- •Longitudinal Control
- •Manoeuvring Control Requirement
- •Take-off Control Requirement
- •Landing Control Requirement
- •Dynamic Stability
- •Longitudinal Dynamic Stability
- •Long Period Oscillation (Phugoid)
- •Short Period Oscillation
- •Directional Stability and Control
- •Sideslip Angle
- •Static Directional Stability
- •Contribution of the Aeroplane Components.
- •Lateral Stability and Control
- •Static Lateral Stability
- •Contribution of the Aeroplane Components
- •Lateral Dynamic Effects
- •Spiral Divergence
- •Dutch Roll
- •Pilot Induced Oscillation (PIO)
- •High Mach Numbers
- •Mach Trim
- •Key Facts 2
- •Summary
- •Questions
- •Key Facts 1 (Completed)
- •Key Facts 2 (Completed)
- •Answers
- •11 Controls
- •Introduction
- •Hinge Moments
- •Control Balancing
- •Mass Balance
- •Longitudinal Control
- •Lateral Control
- •Speed Brakes
- •Directional Control
- •Secondary Effects of Controls
- •Trimming
- •Questions
- •Answers
- •12 Flight Mechanics
- •Introduction
- •Straight Horizontal Steady Flight
- •Tailplane and Elevator
- •Balance of Forces
- •Straight Steady Climb
- •Climb Angle
- •Effect of Weight, Altitude and Temperature.
- •Power-on Descent
- •Emergency Descent
- •Glide
- •Rate of Descent in the Glide
- •Turning
- •Flight with Asymmetric Thrust
- •Summary of Minimum Control Speeds
- •Questions
- •Answers
- •13 High Speed Flight
- •Introduction
- •Speed of Sound
- •Mach Number
- •Effect on Mach Number of Climbing at a Constant IAS
- •Variation of TAS with Altitude at a Constant Mach Number
- •Influence of Temperature on Mach Number at a Constant Flight Level and IAS
- •Subdivisions of Aerodynamic Flow
- •Propagation of Pressure Waves
- •Normal Shock Waves
- •Critical Mach Number
- •Pressure Distribution at Transonic Mach Numbers
- •Properties of a Normal Shock Wave
- •Oblique Shock Waves
- •Effects of Shock Wave Formation
- •Buffet
- •Factors Which Affect the Buffet Boundaries
- •The Buffet Margin
- •Use of the Buffet Onset Chart
- •Delaying or Reducing the Effects of Compressibility
- •Aerodynamic Heating
- •Mach Angle
- •Mach Cone
- •Area (Zone) of Influence
- •Bow Wave
- •Expansion Waves
- •Sonic Bang
- •Methods of Improving Control at Transonic Speeds
- •Questions
- •Answers
- •14 Limitations
- •Operating Limit Speeds
- •Loads and Safety Factors
- •Loads on the Structure
- •Load Factor
- •Boundary
- •Design Manoeuvring Speed, V
- •Effect of Altitude on V
- •Effect of Aircraft Weight on V
- •Design Cruising Speed V
- •Design Dive Speed V
- •Negative Load Factors
- •The Negative Stall
- •Manoeuvre Boundaries
- •Operational Speed Limits
- •Gust Loads
- •Effect of a Vertical Gust on the Load Factor
- •Effect of the Gust on Stalling
- •Operational Rough-air Speed (V
- •Landing Gear Speed Limitations
- •Flap Speed Limit
- •Aeroelasticity (Aeroelastic Coupling)
- •Flutter
- •Control Surface Flutter
- •Aileron Reversal
- •Questions
- •Answers
- •15 Windshear
- •Introduction (Ref: AIC 84/2008)
- •Microburst
- •Windshear Encounter during Approach
- •Effects of Windshear
- •“Typical” Recovery from Windshear
- •Windshear Reporting
- •Visual Clues
- •Conclusions
- •Questions
- •Answers
- •16 Propellers
- •Introduction
- •Definitions
- •Aerodynamic Forces on the Propeller
- •Thrust
- •Centrifugal Twisting Moment (CTM)
- •Propeller Efficiency
- •Variable Pitch Propellers
- •Power Absorption
- •Moments and Forces Generated by a Propeller
- •Effect of Atmospheric Conditions
- •Questions
- •Answers
- •17 Revision Questions
- •Questions
- •Answers
- •Explanations to Specimen Questions
- •Specimen Examination Paper
- •Answers to Specimen Exam Paper
- •Explanations to Specimen Exam Paper
- •18 Index
13 High Speed Flight
Normal Shock Waves
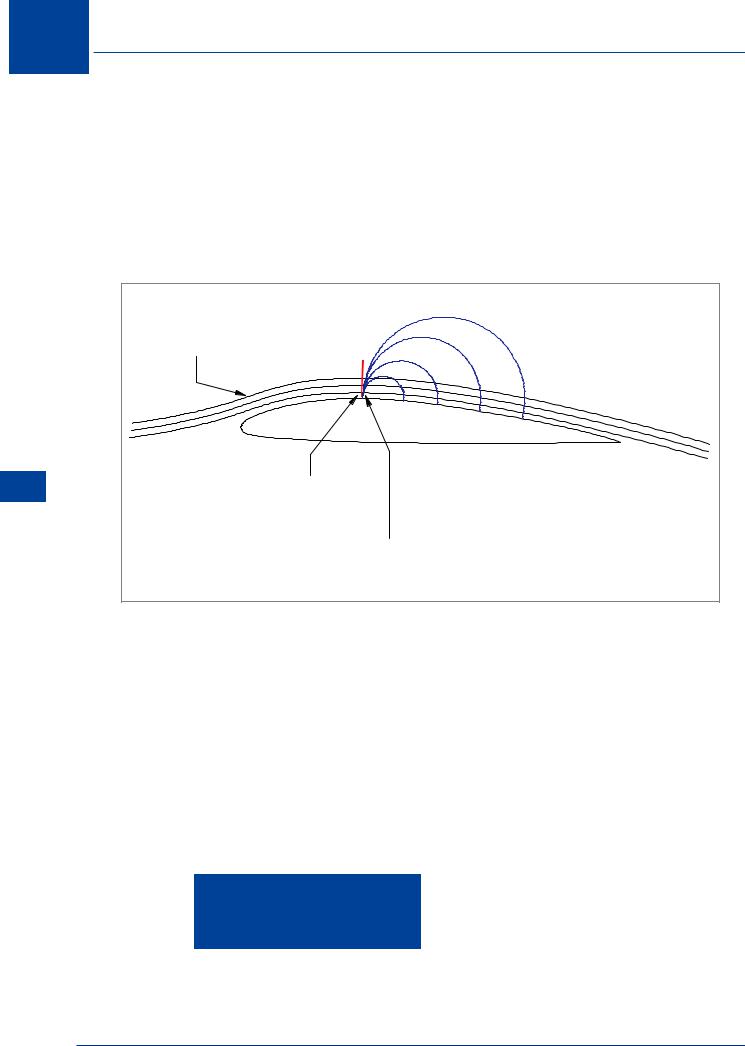
(Normal meaning perpendicular to the upstream flow). In addition to the formation of a shock wave described overleaf, a shock wave can be generated in an entirely different manner when there is no object in the supersonic airflow. (We have now returned to the wind tunnel analogy of a stationary aircraft and moving air). Whenever supersonic airflow is slowed to subsonic speed without a change in direction, a ‘normal’ shock wave will form as a boundary between the supersonic and subsonic region. This means that some ‘compressibility effects’ will occur before the aircraft as a whole reaches Mach 1.0.
|
AIR BEING ACCELERATED |
NORMAL |
|
SHOCK |
|
|
TO SUPERSONIC SPEED |
WAVE |
13 |
LOCAL MACH NUMBER > 1 |
|
|
|
|
High |
|
|
Speed |
|
LOCAL MACH NUMBER < 1 |
|
|
|
Flight |
|
(PRESSURE WAVES ABLE |
|
TO TRAVEL FORWARD) |
|
|
|
Figure 13.5 Shock wave at subsonic free stream Mach number
Critical Mach Number
An aerofoil generates lift by accelerating air over the top surface. At small angles of attack the highest local velocity on an aircraft will usually be located at the point of maximum thickness on the wing. For example, at a free stream speed of M 0.84, maximum local velocity on the wing might be as high as M 1.05 in cruising level flight. At increased angles of attack the local velocity will be greater and further forward. Also, if the thickness/chord ratio were greater, the local speed will be higher.
As the free stream speed increases, the maximum speed on the aerofoil will reach the local speed of sound first. The free stream Mach number at which the local velocity first reaches Mach 1.0 (sonic) is called the Critical Mach number (MCRIT ).
Critical Mach number is the highest speed at which no parts of the aircraft are supersonic
Increased thickness/chord ratio and increased angle of attack cause greater accelerations over the top surface of the wing, so the critical
Mach number will decrease with increasing thickness/chord ratio or angle of attack.
414
High Speed Flight
Accelerating beyond MCRIT
At speeds just above the critical Mach number there will be a small region of supersonic airflow on the upper surface, terminated by a shock wave, Figure 13.6.
|
NORMAL |
|
AREA OF SUPERSONIC FLOW |
SHOCK |
|
WAVE |
||
|
||
SUBSONIC FLOW |
SUBSONIC FLOW |
|
|
Figure 13.6 Mixed supersonic & subsonic airflow at transonic speeds
As the aircraft speed is further increased, the region of supersonic flow on the upper surface extends, and the shock wave marking the end of the supersonic region moves rearwards. A similar sequence of events will occur on the lower surface although the shock wave will usually form at a higher aircraft speed because the lower surface usually has less curvature so the air is not accelerated so much.
When the aircraft speed reaches Mach 1.0, the airflow is supersonic over the whole of both upper and lower surfaces, and both the upper and lower shock waves will have reached the trailing edge. At a speed just above Mach 1.0 the other shock wave previously described and illustrated in Figure 13.4, the bow wave, forms ahead of the leading edge.
The bow shock wave is initially separated (detached) from the leading edge by the build-up of compressed air at the leading edge, but as speed increases, it moves closer to the leading edge. For a sharp leading edge the shock eventually becomes attached to the leading edge. The Mach number at which this occurs depends upon the leading edge angle. For a sharp leading edge with a small leading edge angle the bow wave will attach at a lower Mach number than one with a larger leading edge angle.
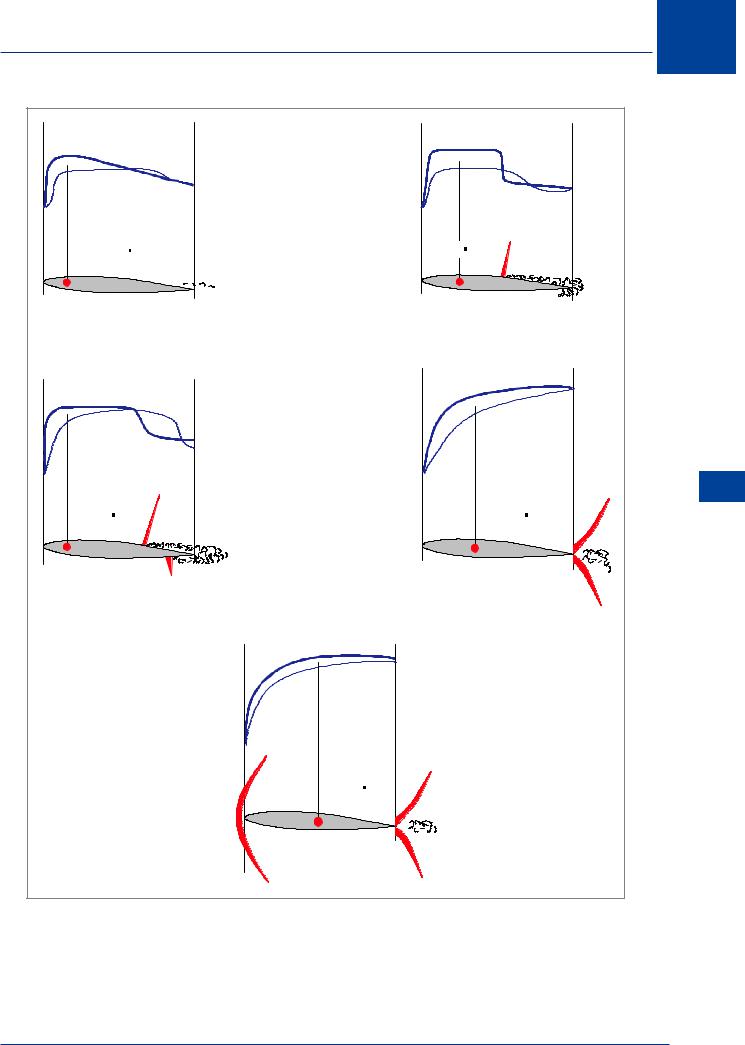
Figure 13.8 on page 417, shows the development of shock waves on an aerofoil section at a small constant angle of attack as the airspeed is increased from subsonic to supersonic.
13
High Speed Flight 13
A shock wave forms at the rear of an area of supersonic flow
At MCRIT there is no shock wave because there is no supersonic flow
415
13 High Speed Flight
Pressure Distribution at Transonic Mach Numbers
Flight Speed High 13
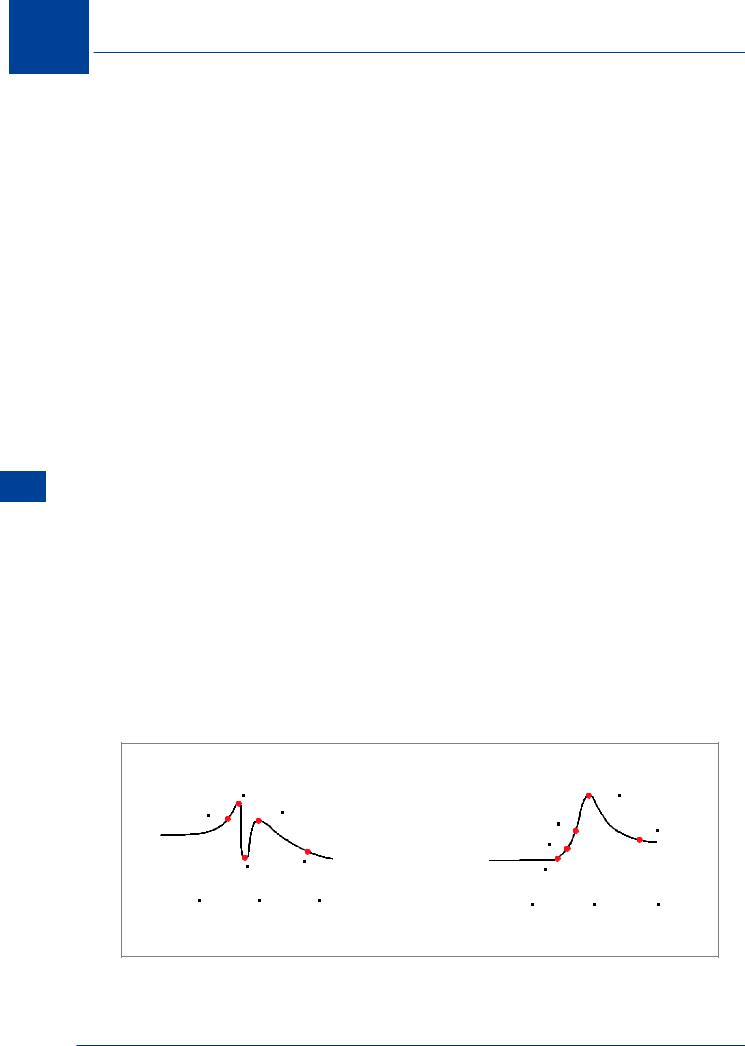
Refer to Figure 13.8. The solid blue line represents upper surface pressure and the dashed blue line the lower surface. Decreased pressure is indicated upwards. The difference between the full line and the dashed line shows the effectiveness of lift production; if the dashed line is above the full line, the lift is negative in that area. Lift is represented by the area between the lines, and the Centre of Pressure (CP) by the centre of the area.
During acceleration to supersonic flight, the pressure distribution is irregular.
M 0.75 This is the subsonic picture. Separation has started near the trailing edge and there is practically no net lift over the rear third of the aerofoil section; the CP is well forward. Figure 13.7 shows that CL is quite good and is rising steadily; CD, on the other hand, is beginning to rise.
M 0.81 A shock wave has appeared on the top surface; notice the sudden increase of pressure (shown by the falling line) caused by decreasing flow speed at the shock wave. The CP has moved back a little, but the area is still large. Figure 13.7 shows that lift is good, but drag is now rising rapidly.
M 0.89 The pressure distribution shows very clearly why there is a sudden drop in lift coefficient before the aerofoil as a whole reaches the speed of sound; on the rear portion of the aerofoil the lift is negative because the suction on the top surface has been spoilt by the shock wave, while there is still quite good suction and high-speed flow on the lower surface. On the front portion there is nearly as much suction on the lower surface as on the upper. The CP has now moved well forward again. Figure 13.7 shows that drag is still increasing rapidly.
M 0.98 This shows the important results of the shock waves moving to the trailing edge and no longer spoiling the suction or causing separation. The speed of the flow over the surfaces is nearly all supersonic, the CP has moved aft again and, owing to the good suction over nearly all the top surface, with rather less on the bottom, the lift coefficient has actually increased. The drag coefficient is just about at its maximum, as shown Figure 13.7.
M 1.4 The aerofoil is through the transonic region. The bow wave has appeared. The lift coefficient has fallen again because the pressure on both surfaces is nearly the same; and for the first time since the critical Mach number, the drag coefficient has fallen considerably.
CL |
M 0 81 |
|
|
CD |
|
|
M 0 98 |
|
|
M 0 75 |
M 0 98 |
|
|
|
|
|
|||
|
|
|
|
M 0 89 |
|
M 1 4 |
|||
|
|
|
|
|
|
|
|
||
|
|
|
|
|
|
M 0 81 |
|
||
|
|
|
|
|
|
|
|
||
|
|
M 0 89 |
M 1 4 |
|
M 0 75 |
|
|
||
|
|
|
|
|
|
|
|||
|
|
|
|
|
|
|
|
|
|
|
0 5 |
1 0 |
|
1 5 |
|
|
|
|
|
|
|
0 |
5 |
1 0 |
1 5 |
||||
|
Mach number |
|
|||||||
|
|
|
|
Mach number |
|
||||
|
|
|
|
|
|
|
|
||
Figure 13.7 Changes in lift & drag in the transonic region
416
High Speed Flight 13
M 0 75 |
M 0 81 |
|
|
CP |
CP |
|
|
|
|
13 |
|
M 0 89 |
|
M 0 98 |
|
CP |
CP |
SpeedFlight |
|
High |
|||
|
|
||
|
M 1 4 |
|
|
|
CP |
|
|
|
Figure 13.8 Pressure distribution in the transonic region |
|
417