

2 Random variables: joint distributions and covariance
-
Random variables X and Z have a joint distribution
-
The covariance between X and Z is
cov(X,Z) = E[(X – BXB)(Z – BZB)] = BXZB
-
The covariance is a measure of the linear association between X and Z; its units are units of X units of Z
-
cov(X,Z) > 0 means a positive relation between X and Z
-
If X and Z are independently distributed, then cov(X,Z) = 0 (but not vice versa!!)
-
The covariance of a r.v. with itself is its variance:
cov(X,X)
= E[(X
– BXB)(X
– BXB)]
= E[(X
– BXB)P2P]
=
![]()
The covariance between Test Score and STR is negative:
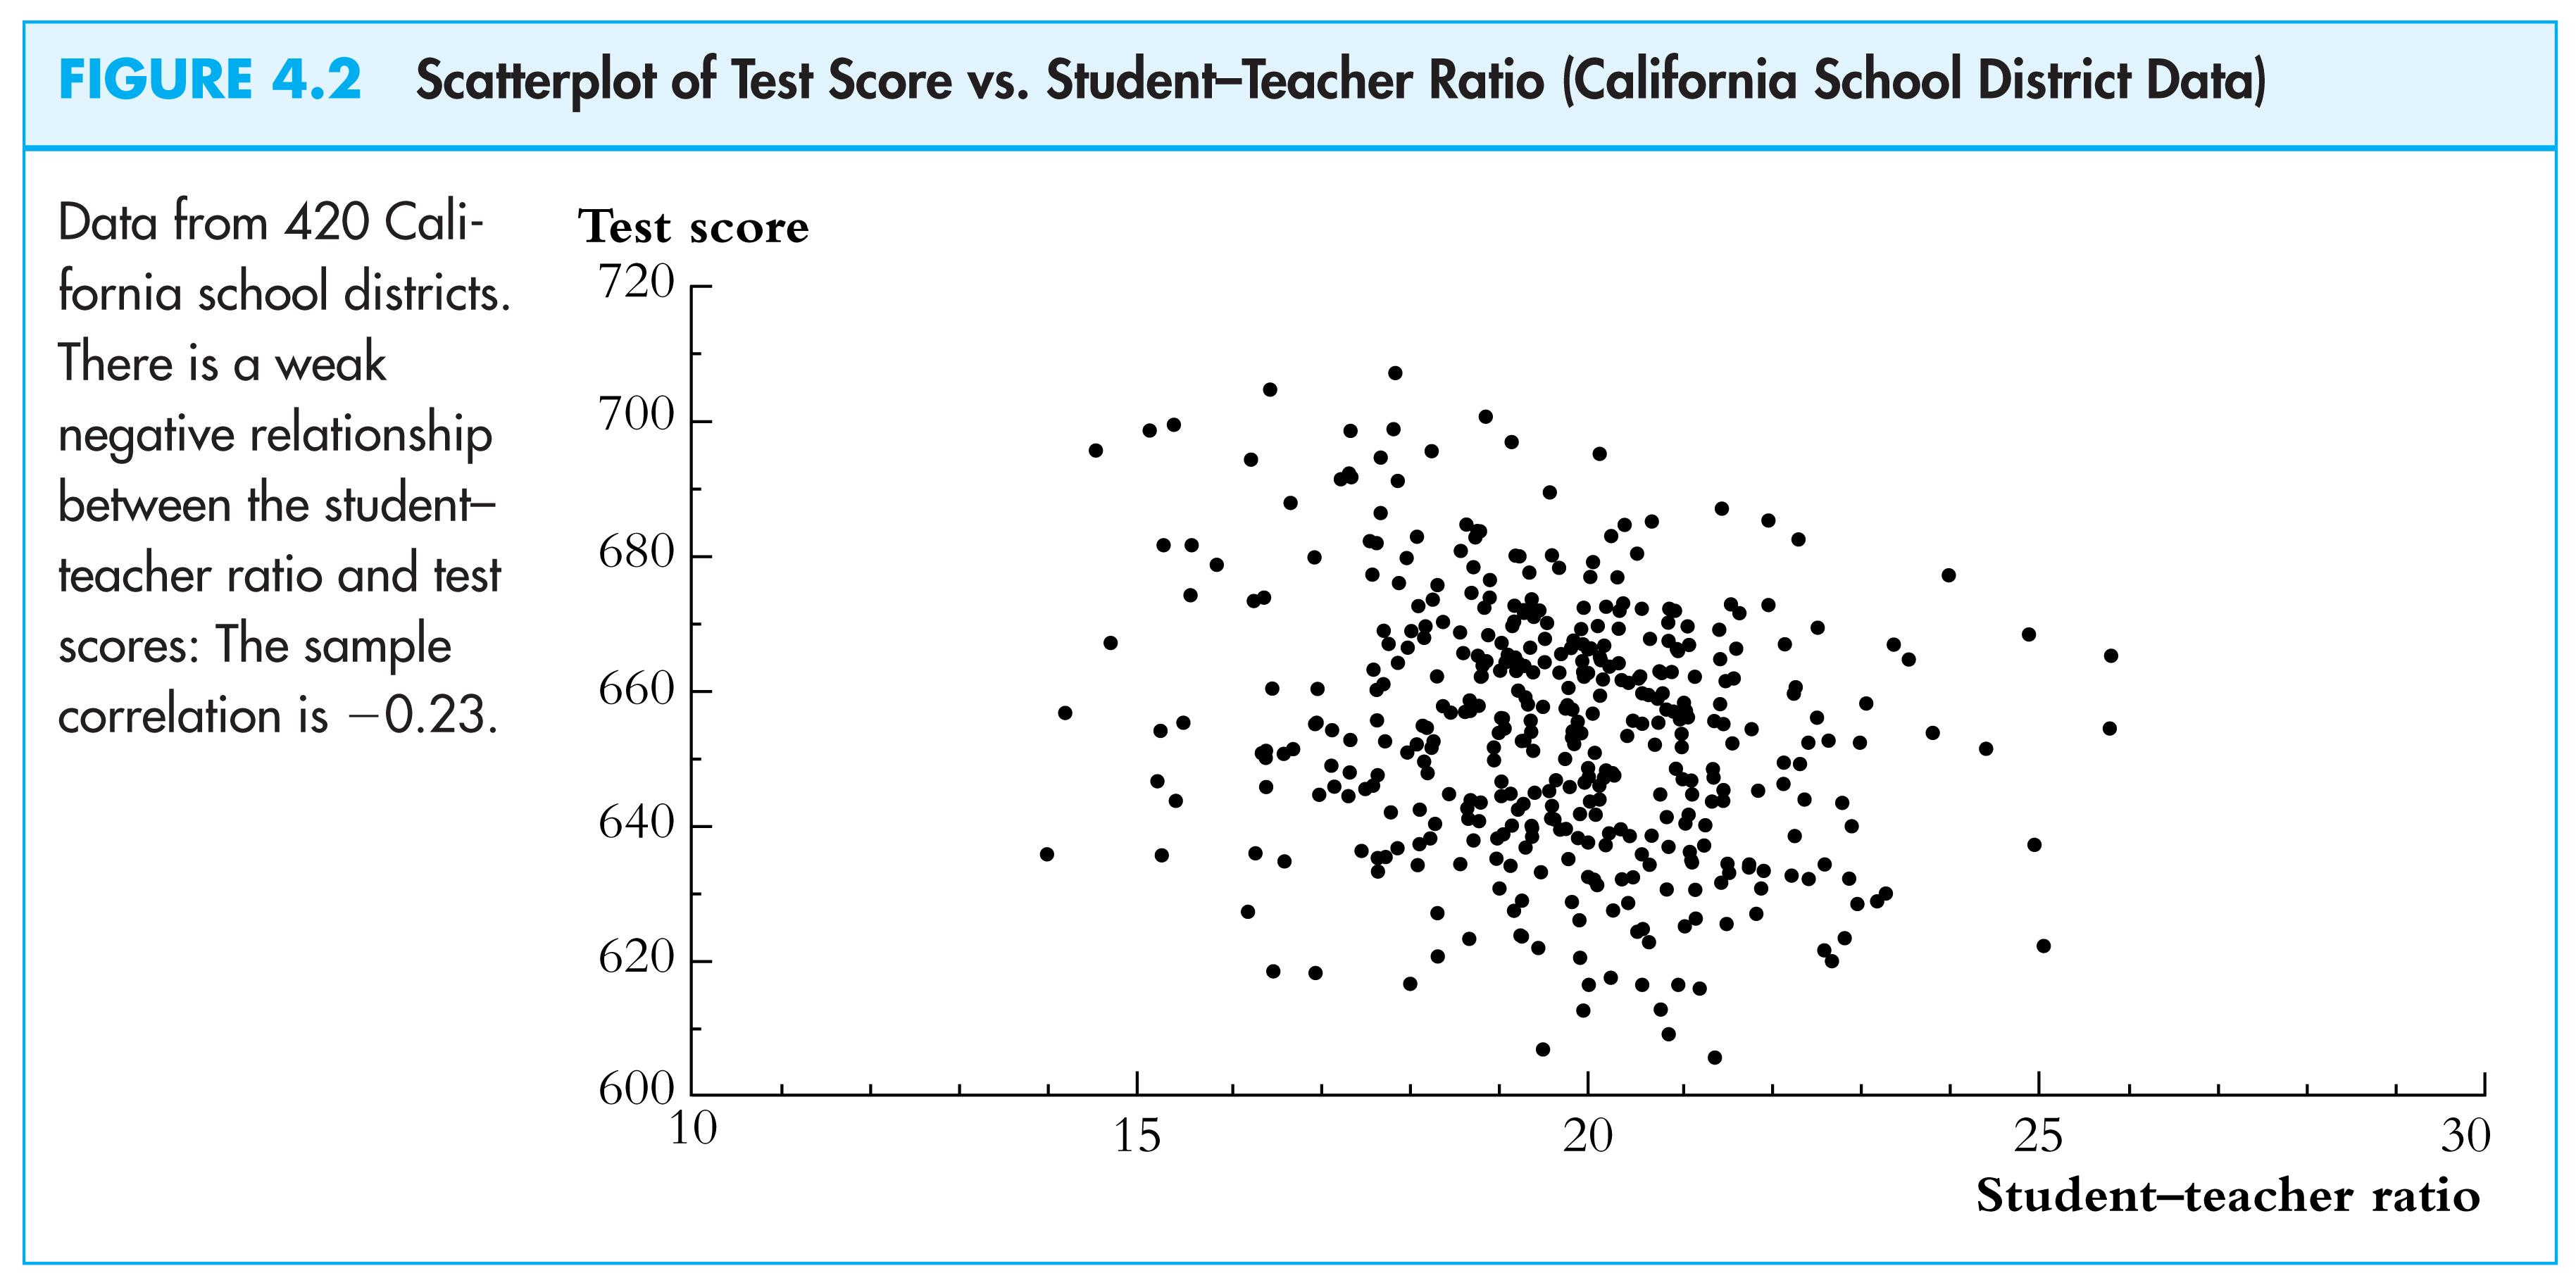
so is the correlation…
The correlation coefficient is defined in terms of the covariance:
corr(X,Z)
=
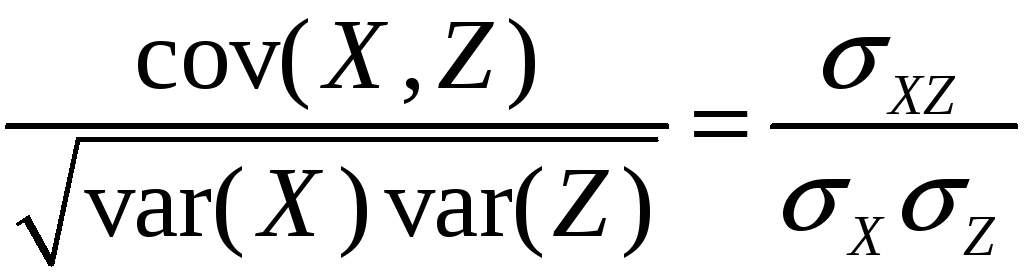 = rBXZB
-
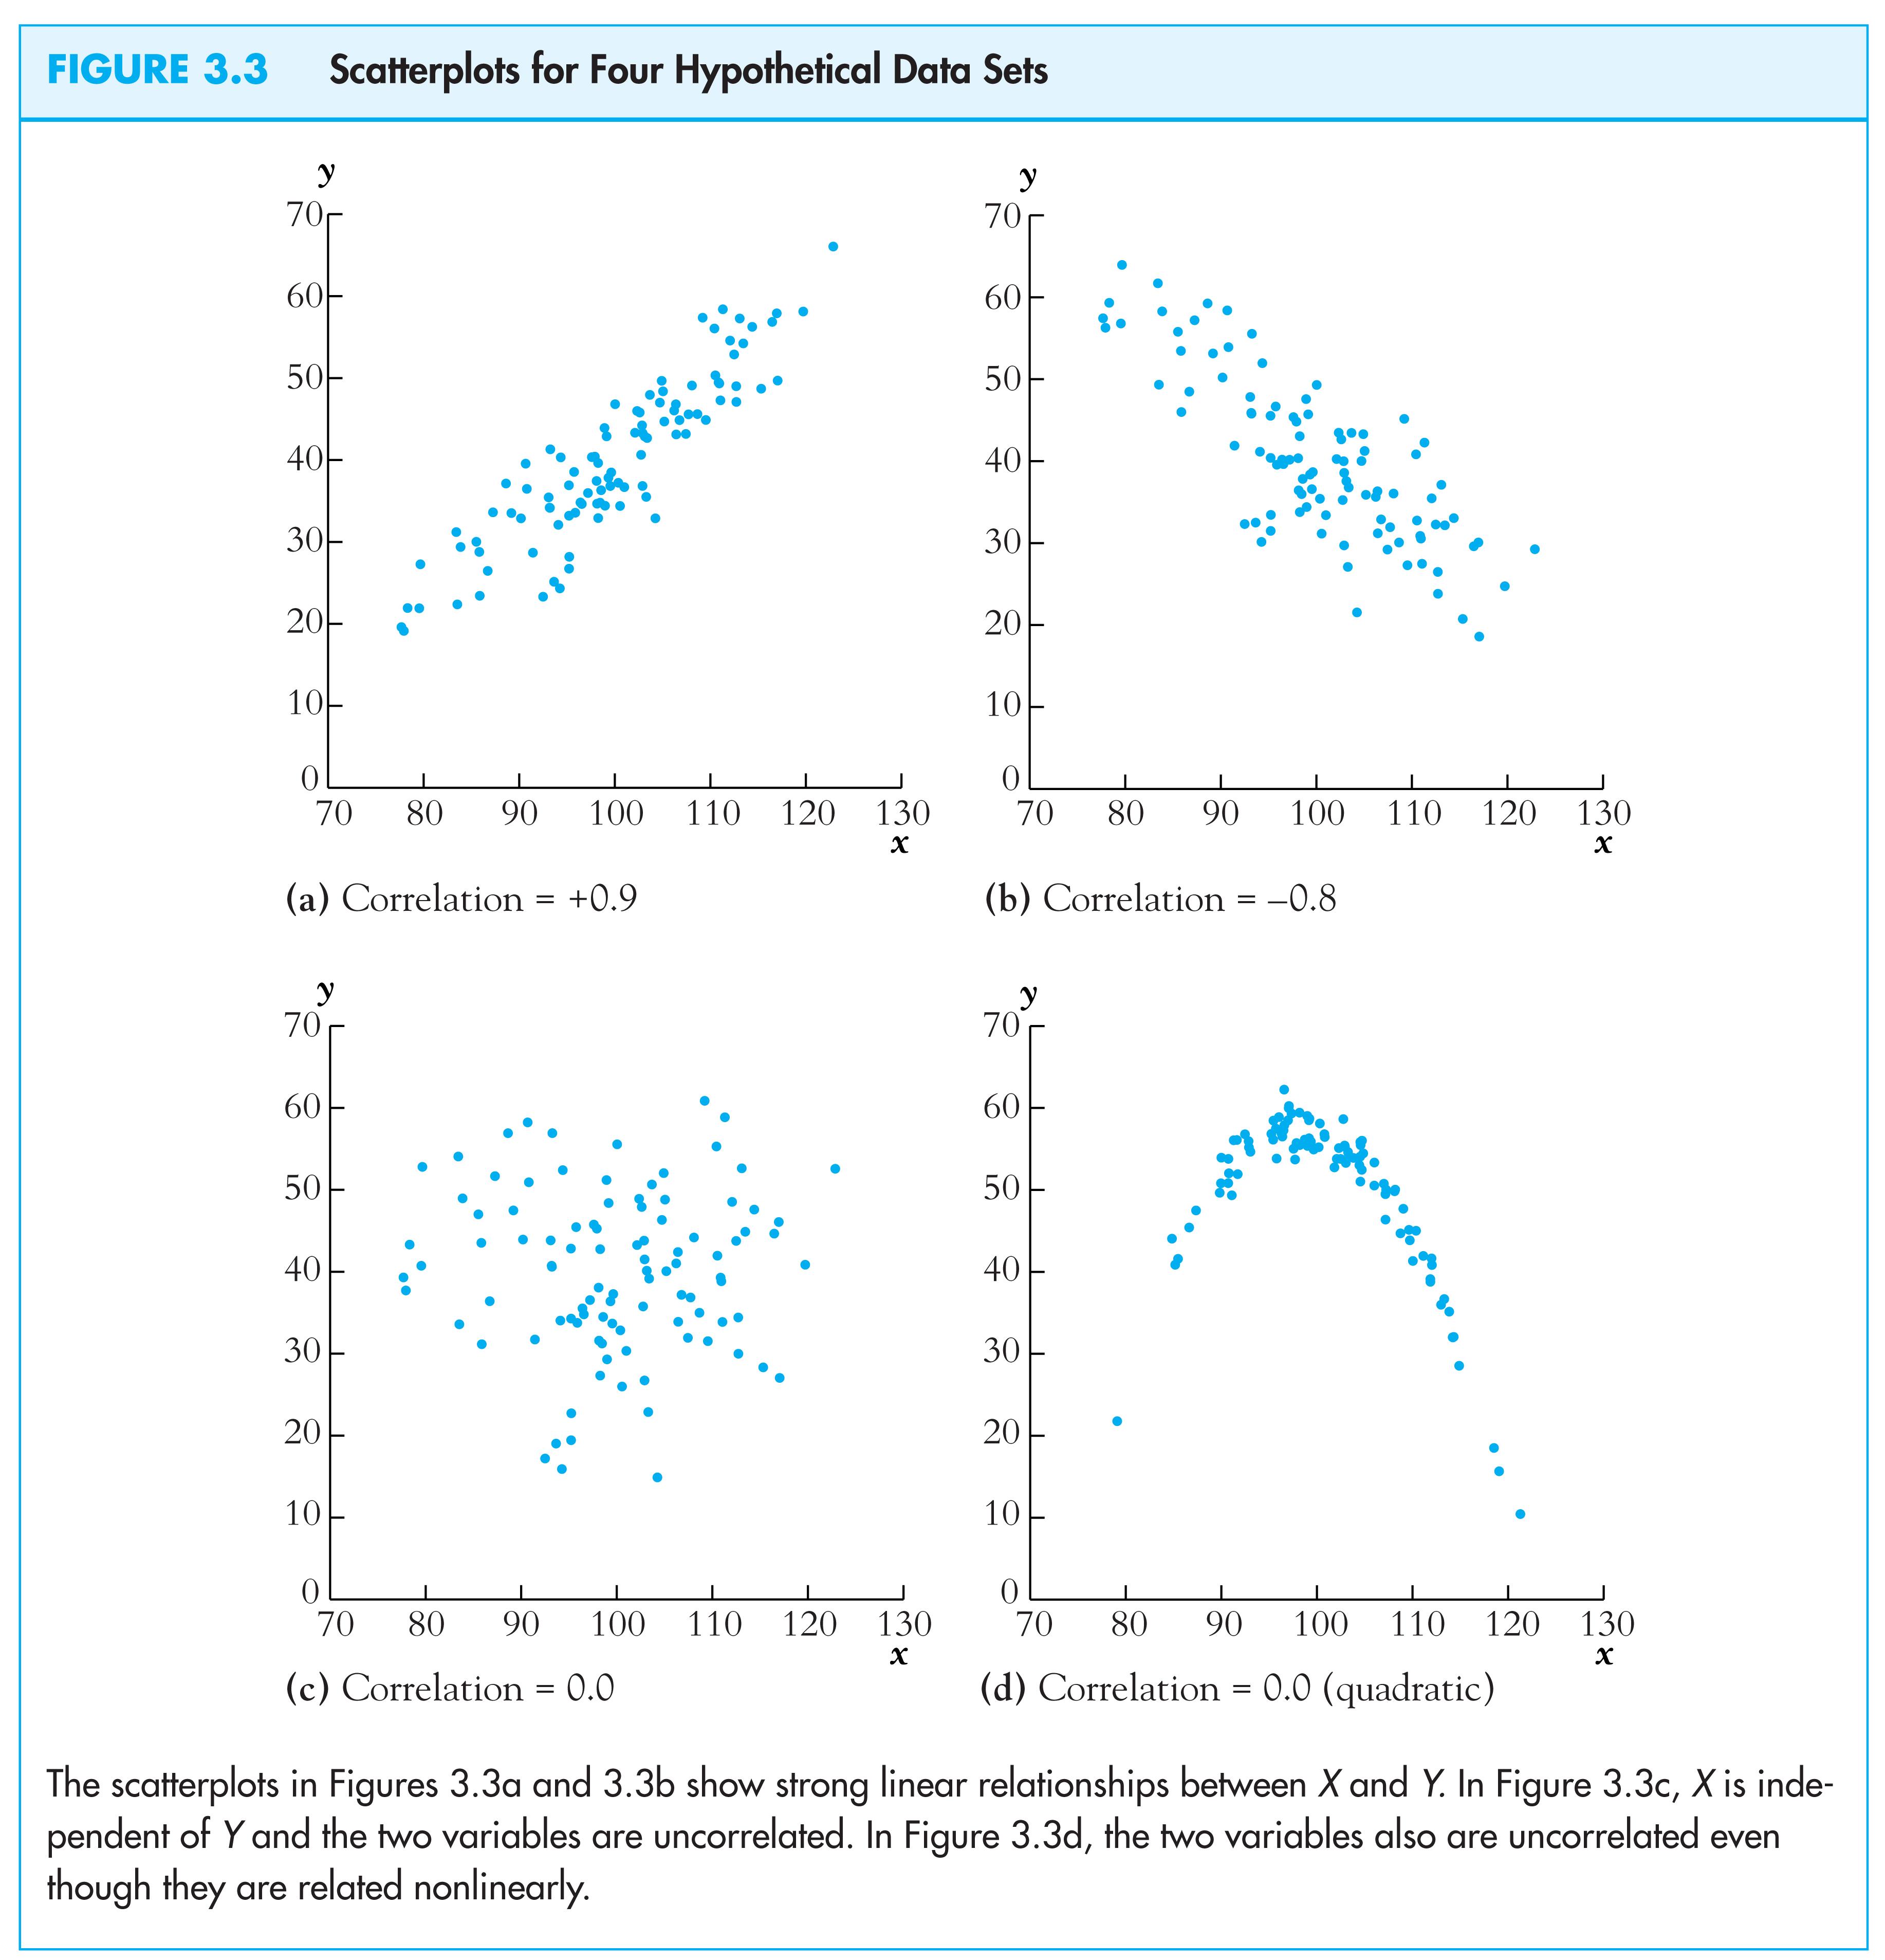
–1 corr(X,Z) 1
-
corr(X,Z) = 1 mean perfect positive linear association
-
corr(X,Z) = –1 means perfect negative linear association
-
corr(X,Z) = 0 means no linear association
The correlation coefficient measures linear association
(c) Conditional distributions and conditional means
Conditional distributions
-
The distribution of Y, given value(s) of some other random variable, X
-
Ex: the distribution of test scores, given that STR < 20
Conditional expectations and conditional moments
-
conditional mean = mean of conditional distribution
= E(Y|X = x) (important concept and notation)
-
conditional variance = variance of conditional distribution
-
Example: E(Test scores|STR < 20) = the mean of test scores among districts with small class sizes
The difference in means is the difference between the means of two conditional distributions:
Conditional mean, ctd.
= E(Test scores|STR < 20) – E(Test scores|STR ≥ 20)
Other examples of conditional means:
-
Wages of all female workers (Y = wages, X = gender)
-
Mortality rate of those given an experimental treatment (Y = live/die; X = treated/not treated)
-
If E(X|Z) = const, then corr(X,Z) = 0 (not necessarily vice versa however)
The conditional mean is a (possibly new) term for the familiar idea of the group mean
(d) Distribution of a sample of data drawn randomly
from a population: YB1B,…, YBnB
We will assume simple random sampling
-
Choose and individual (district, entity) at random from the population
Randomness and data
-
Prior to sample selection, the value of Y is random because the individual selected is random
-
Once the individual is selected and the value of Y is observed, then Y is just a number – not random
-
The data set is (YB1B, YB2B,…, YBnB), where YBiB = value of Y for the iPthP individual (district, entity) sampled
Distribution of YB1B,…, YBnB under simple random sampling
-
Because individuals #1 and #2 are selected at random, the value of YB1B has no information content for YB2B. Thus:
-
YB1B and YB2B are independently distributed
-
YB1B and YB2B come from the same distribution, that is, YB1B, YB2B are identically distributed
-
That is, under simple random sampling, YB1B and YB2B are independently and identically distributed (i.i.d.).
-
More generally, under simple random sampling, {YBiB}, i = 1,…, n, are i.i.d.
-
This framework allows rigorous statistical inferences about moments of population distributions using a sample of data from that population …