

METEOROLOGY
.pdf28 METEOROLOGY 10 DEC 10
METEOROLOGICAL SERVICE FOR INTERNATIONAL AIR NAVIGATION
/ MODEL CHARTS - ANNEX 3
EX
© JEPPESEN, 1999, 2010. ALL RIGHTS RESERVED.
10 DEC 10 |
METEOROLOGY |
29 |
METEOROLOGICAL SERVICE FOR INTERNATIONAL AIR NAVIGATION
/ MODEL CHARTS - ANNEX 3
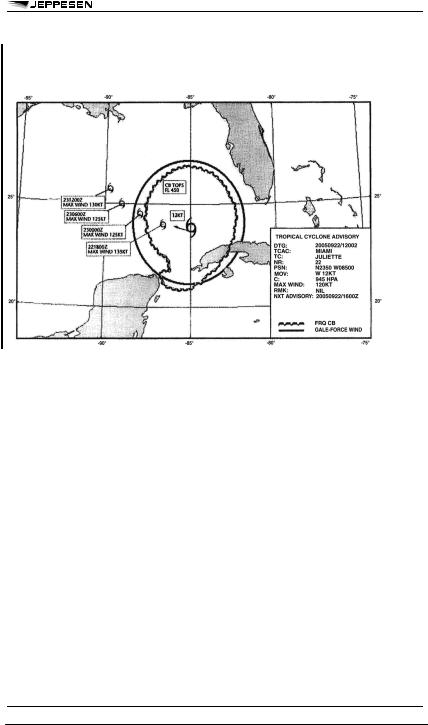
APPENDIX 1 - MODEL TCG - CYCLONE ADVISORY INFORMATION IN GRAPHICAL FORMAT
© JEPPESEN, 1999, 2010. ALL RIGHTS RESERVED.
30 |
METEOROLOGY |
10 DEC 10 |
METEOROLOGICAL SERVICE FOR INTERNATIONAL AIR NAVIGATION
/ MODEL CHARTS - ANNEX 3
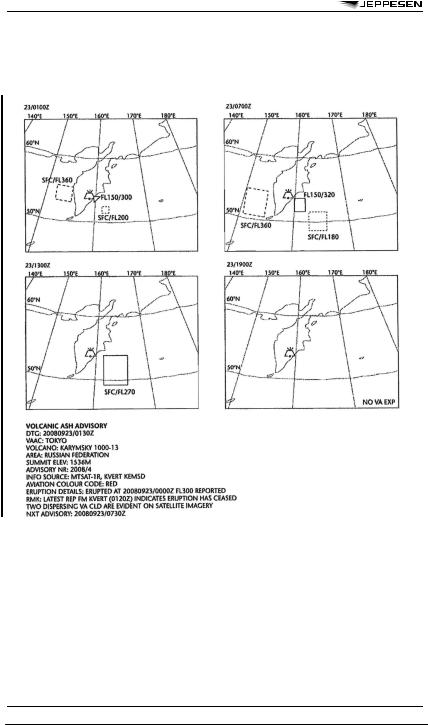
APPENDIX 1 - MODEL VAG -
VOLCANIC ASH ADVISORY INFORMATION IN GRAPHICAL FORMAT
© JEPPESEN, 1999, 2010. ALL RIGHTS RESERVED.
10 DEC 10 |
METEOROLOGY |
31 |
METEOROLOGICAL SERVICE FOR INTERNATIONAL AIR NAVIGATION
/ MODEL CHARTS - ANNEX 3
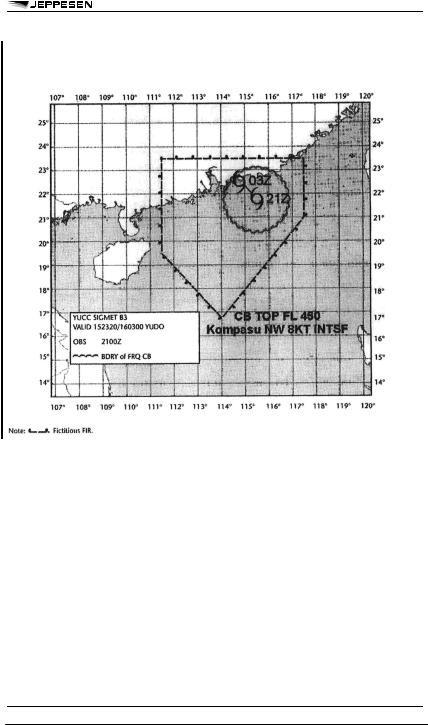
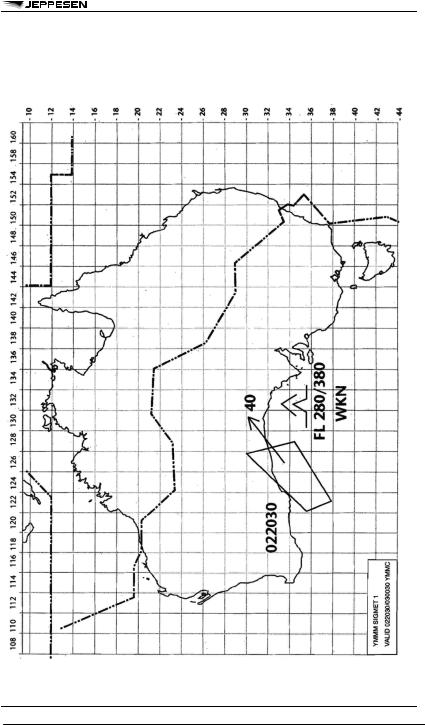
APPENDIX 1 - MODEL STC - SIGMET FOR TROPICAL CYCLONE IN GRAPHICAL FORMAT
© JEPPESEN, 1999, 2010. ALL RIGHTS RESERVED.
32 |
METEOROLOGY |
10 DEC 10 |
METEOROLOGICAL SERVICE FOR INTERNATIONAL AIR NAVIGATION
/ MODEL CHARTS - ANNEX 3
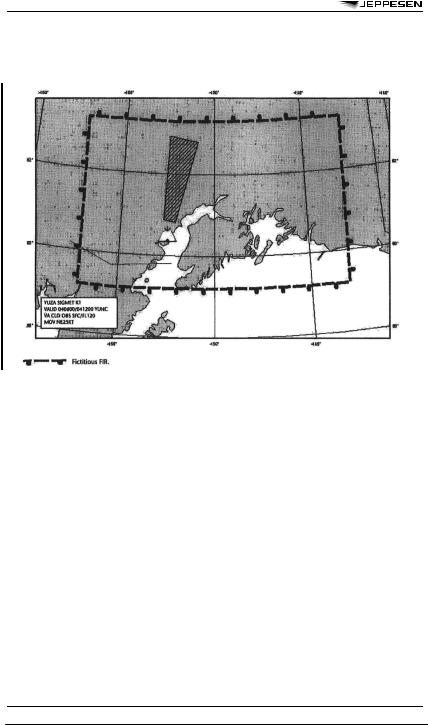
APPENDIX 1 - MODEL SVA - SIGMET FOR VOLCANIC ASH IN GRAPHICAL FORMAT
© JEPPESEN, 1999, 2010. ALL RIGHTS RESERVED.
10 DEC 10 |
METEOROLOGY |
33 |
METEOROLOGICAL SERVICE FOR INTERNATIONAL AIR NAVIGATION
/ MODEL CHARTS - ANNEX 3
APPENDIX 1 - MODEL SGE - SIGMET FOR PHENOMENA OTHER THAN TROPICAL CYCLONE AND VOLCANIC ASH IN GRAPHICAL FORMAT
© JEPPESEN, 1999, 2010. ALL RIGHTS RESERVED.
10 DEC 10 |
METEOROLOGY |
35 |
METEOROLOGICAL SERVICE FOR INTERNATIONAL AIR NAVIGATION
/ SIGMET NOTATIONS - ANNEX 3
APPENDIX 1. MODEL SN –
NOTATIONS USED IN FLIGHT DOCUMENTATION
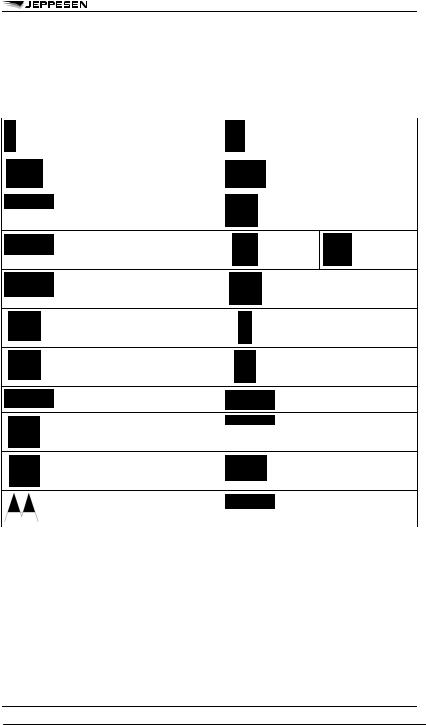
1SYMBOLS FOR SIGNIFICANT WEATHER
1 In flight documentation for flights operating up to FL 100, this symbol refers to “squall line”.
2The following information should be included at the side of the chart: radioactive materials symbol; Latitude/longitude of accident site; Date and time of accident; check NOTAM for further information.
3The following information should be included at the side of the chart: Volcanic eruption symbol; Name and international number of volcano (if known); Latitude/longitude; Date and time of the first eruption (if known)
4 This symbol does not refer to icing due to precipitation coming into contact with an aircraft which is at a very low temperature.
© JEPPESEN, 1999, 2010. ALL RIGHTS RESERVED.
36 METEOROLOGY 10 DEC 10
METEOROLOGICAL SERVICE FOR INTERNATIONAL AIR NAVIGATION
/ SIGMET NOTATIONS - ANNEX 3
NOTE: Height indications between which phenomena are expected, top above base as per chart legend.
2FRONTS AND CONVERGENCE ZONES AND OTHER SYMBOLS USED
1 This symbol refers to widespread surface wind speeds exceeding 15 m/s (30 kt).
3ABBREVIATIONS USED TO DESCRIBE CLOUDS
3.1TYPE
CI = Cirrus |
AS = Altostratus |
ST = Stratus |
CC = Cirrocumulus |
NS = Nimbostratus |
CU = Cumulus |
CS = Cirrostratus |
SC = Stratocumulus |
CB = Cumulonimbus |
AC = Altocumulus |
|
|
© JEPPESEN, 1999, 2010. ALL RIGHTS RESERVED.
10 DEC 10 |
METEOROLOGY |
37 |
METEOROLOGICAL SERVICE FOR INTERNATIONAL AIR NAVIGATION
/ SIGMET NOTATIONS - ANNEX 3
3.2AMOUNT
Clouds except CB:
FEW = few (1/8th to 2/8ths) SCT = scattered (3/8th to 4/8ths) BKN = broken (5/8ths to 7/8ths) OVC = overcast (8/8ths)
CB only:
ISOL = individual CBs (isolated)
OCNL = well separated CBs (occasional)
FRQ = CBs with little or no separation (frequent)
EMBD = CBs embedded in layers of other clouds or concealed by haze (embedded)
3.3HEIGHTS
Heights are indicated on SWH and SWM charts in flight levels (FL), top over base.
In SWL charts:
When XXX is used, tops or bases are outside the layer of the atmosphere to which the chart applies.
a.Heights are indicated as altitudes above mean sea level;
b.The abbreviation SFC is used to indicate ground level.
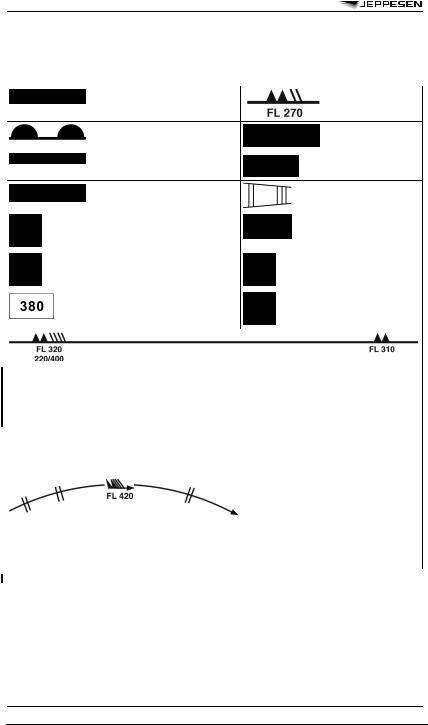
4DEPICTING OF LINES AND SYSTEMS ON SPECIFIC CHARTS
4.1SWH AND SWM — SIGNIFICANT WEATHER CHARTS (HIGH
AND MEDIUM)
Scalloped line Heavy broken line
Heavy solid line interrupted by wind arrow and flight level
Figures on arrows
Flight levels inside small rectangles
=demarcation of areas of significant weather
=delineation of area of CAT
=position of jet stream axis with indication of wind direction, speed in kt or km/h and height in flight levels. The vertical extent of the jet stream is indicated (in flight levels), e.g. FL270 accompanied by 240/290 indicates that the jet extends from FL240 to FL290.
=speed in kt or km/h of movement of frontal system
= |
|
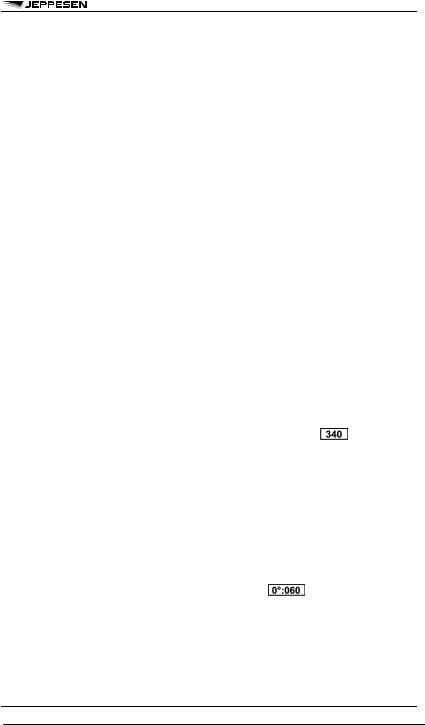
height in flight levels of tropopause at spot locations; e.g., |
. Low and High |
points of the tropopause topography are indicated by the letters L or H respectively inside a pentagon with the height in flight levels.
Display explicit FL for JET dephts and tropopause height even if outside forecast bounds.
4.2SWL — SIGNIFICANT WEATHER CHART (LOW LEVEL)
X
L
H
Scalloped lines Dashed lines
Figures on arrows
=position of pressure centres given in hectopascals;
=centre of low pressure;
=centre of high pressure;
=demarcation of area of significant weather
=altitude of 0°C isotherm in feet (hectofeet) or metres
NOTE: 0°C level may also be indicated by; |
i.e., 0°C level is at an |
altitude of 6,000 ft. |
|
= speed in kt or km/h of movement of frontal systems, depressions or anticyclones
© JEPPESEN, 1999, 2010. ALL RIGHTS RESERVED.
38 |
METEOROLOGY |
10 DEC 10 |
METEOROLOGICAL SERVICE FOR INTERNATIONAL AIR NAVIGATION
/ SIGMET NOTATIONS - ANNEX 3
Figure inside the state |
= |
total wave height in feet or metres |
of the sea symbol |
= |
|
Figure inside the sea |
sea surface temperature in °C |
|
surface temperature |
|
|
symbol |
= |
|
Figures inside the |
wind in kt or km/h |
|
strong surface wind |
|
|
symbol |
|
|
4.3ARROWS, FEATHERS AND PENNANTS
Arrows indicate direction. Number of pennants and/or feathers correspond to speed.
EXAMPLE:
270° / 115 kt (equivalent to 57.5 m/s) Pennants correspond to 50 kt or 25 m/s; Feather correspond to 10 kt or 5 m/s; Half-feather correspond to 5 kt or 2.5 m/s. A conversion factor of 1 to 2 is used.
© JEPPESEN, 1999, 2010. ALL RIGHTS RESERVED.