

Статистика пожаров / Центр пожарной статистики CTIF / ctif_report17_world_fire_statistics_2012
.pdf
|
|
|
|
|
|
|
|
|
|
|
Table/Таблица/Tabelle 2 |
|
|
|
|
|
Common indicators of fire statistics in the countries of the world in 2010 |
|
|
||||||
|
|
|
Укрупненные показатели объема работы и обстановки с пожарами в странах мира в 2010 г. |
|
|
|||||||
|
|
|
Verdichtete Kennzahlen der Brandsituation in den Staaten für das Jahr 2010 |
|
|
|||||||
|
|
Population |
|
Number of |
|
|
|
Average number |
|
|
||
|
Country |
thous.inh. |
calls |
fires |
fire |
fire |
per 1000 inh.: |
of fire deaths per: |
of fire injuries per: |
|||
|
|
|
deaths |
injuries |
calls |
fires |
100000 inh. |
100 fires |
100000 inh. |
100 fires |
||
|
|
|
|
|
||||||||
|
|
Население, |
|
Число |
|
|
|
Среднее число |
|
|
||
N |
Страна |
тыс. чел. |
выездов |
пожаров |
погибших |
травмиро- |
на 1000 чел.: |
погибших на: |
травмированных на: |
|||
|
|
|
ванных |
выездов |
пожаров |
100000 чел. |
100 пожаров |
100000 чел. |
100 пожаров |
|||
|
|
|
|
|
|
|||||||
|
|
Einwohner |
|
Anzahl der … |
|
|
|
|
Mittlere |
|
|
|
|
Staat |
in 1.000 |
Einsätze |
Brände |
Brand- |
Verletzten- |
1.000 Einw. |
Brandtotenzahl je: |
Verletztenzahl je: |
|||
|
|
|
tote |
zahl |
Einsätze |
Brände |
100.000 Einw. |
100 Brände |
100.000 Einw. |
100 Brände |
||
|
|
|
|
|
||||||||
1 |
USA |
311 537 |
28 205 000 |
1 331 500 |
3 120 |
17 720 |
90,5 |
4,3 |
1,0 |
0,2 |
5,7 |
1,3 |
2 |
Russia |
141 900 |
- |
179 500 |
13 061 |
13 117 |
- |
1,3 |
9,2 |
7,3 |
9,2 |
7,3 |
3 |
Vietnam |
86 000 |
- |
2 231 |
60 |
150 |
- |
0,0 |
0,1 |
2,7 |
0,2 |
6,7 |
4 |
France |
65 027 |
4 031 767 |
336 867 |
438 |
13 513 |
62,0 |
5,2 |
0,7 |
0,1 |
20,8 |
4,0 |
5 |
Great Britain |
60 003 |
623 800 |
281 500 |
388 |
- |
10,4 |
4,7 |
0,6 |
0,1 |
- |
- |
6 |
Italy |
58 500 |
736 673 |
197 166 |
74 |
101 |
12,6 |
3,4 |
0,1 |
0,0 |
0,2 |
0,1 |
7 |
Spain |
47 021 |
347 290 |
115 267 |
192 |
- |
- |
2,5 |
0,4 |
0,2 |
- |
- |
8 |
Ukraine |
45 871 |
182 510 |
62 207 |
2 819 |
- |
4,0 |
1,4 |
6,1 |
4,5 |
- |
- |
9 |
Poland |
38 167 |
509 640 |
135 555 |
525 |
- |
13,4 |
3,6 |
1,4 |
0,4 |
- |
- |
10 |
Romania |
21 504 |
192 636 |
13 167 |
247 |
442 |
9,0 |
0,6 |
1,1 |
1,9 |
2,1 |
3,4 |
11 |
Kazachstan |
15 819 |
59 163 |
19 058 |
528 |
604 |
- |
1,2 |
3,3 |
2,8 |
3,8 |
3,2 |
12 |
Portugal |
11 000 |
1 179 000 |
26 800 |
0 |
250 |
107,2 |
2,4 |
0,0 |
0,0 |
2,3 |
0,9 |
13 |
Czechia |
10 517 |
- |
17 937 |
131 |
1 060 |
- |
1,7 |
1,2 |
0,7 |
10,1 |
5,9 |
14 |
Hungary |
9 999 |
82 034 |
16 756 |
112 |
455 |
8,2 |
1,7 |
1,1 |
0,7 |
4,6 |
2,7 |
15 |
Belarus |
9 500 |
46 901 |
10 023 |
1 110 |
481 |
4,9 |
1,1 |
11,7 |
11,1 |
5,1 |
4,8 |
16 |
Austria |
8 388 |
202 996 |
34 364 |
39 |
- |
24,2 |
4,1 |
- |
- |
- |
- |
17 |
Serbia |
7 566 |
38 333 |
17 304 |
81 |
311 |
- |
2,3 |
1,1 |
0,5 |
4,1 |
1,8 |
18 |
Bulgaria |
7 364 |
41 198 |
25 030 |
79 |
292 |
5,6 |
3,4 |
1,1 |
0,3 |
4,0 |
1,2 |
19 |
Ireland |
6 200 |
- |
- |
38 |
- |
- |
- |
0,6 |
- |
- |
- |
20 |
Denmark |
5 500 |
38 044 |
16 723 |
74 |
- |
6,9 |
3,0 |
1,3 |
0,4 |
- |
- |
21 |
Slovakia |
5 435 |
34 118 |
9 979 |
41 |
244 |
6,3 |
1,8 |
0,8 |
0,4 |
4,5 |
2,4 |
22 |
Finland |
5 375 |
110 387 |
15 208 |
80 |
639 |
20,5 |
2,8 |
1,5 |
0,5 |
11,9 |
4,2 |
23 |
Kyrgyzstan |
5 100 |
- |
6 145 |
64 |
45 |
|
1,2 |
1,3 |
1,0 |
0,9 |
0,7 |
24 |
Norway |
4 858 |
39 981 |
9 780 |
65 |
- |
8,2 |
2,0 |
1,3 |
0,7 |
- |
- |
25 |
Croatia |
4 290 |
31 899 |
5 036 |
26 |
92 |
7,4 |
1,2 |
0,6 |
0,5 |
2,1 |
1,8 |
26 |
New Zealand |
4 271 |
69 579 |
18 622 |
34 |
276 |
16,3 |
4,4 |
0,8 |
0,2 |
6,5 |
1,5 |
27 |
Singapore |
4 987 |
130 223 |
4 600 |
0 |
143 |
26,1 |
0,9 |
0,0 |
0,0 |
2,9 |
3,1 |
28 |
Lithuania |
3 245 |
24 888 |
13 411 |
233 |
215 |
7,7 |
4,1 |
7,2 |
1,7 |
6,6 |
1,6 |
29 |
Latvia |
2 230 |
13 469 |
8 176 |
149 |
242 |
6,0 |
3,7 |
6,7 |
1,8 |
10,9 |
3,0 |
30 |
Slovenia |
2 050 |
- |
3 770 |
16 |
152 |
- |
1,8 |
0,8 |
0,4 |
7,4 |
4,0 |
31 |
Estonia |
1 340 |
17 963 |
6 439 |
69 |
102 |
13,4 |
4,8 |
5,1 |
1,1 |
7,6 |
1,6 |
32 |
Cyprus |
839 |
13 354 |
7 160 |
6 |
20 |
15,9 |
8,5 |
0,7 |
0,1 |
- |
- |
Total/Итого/Gesamt |
1 011 403 |
37 002 846 |
2 947 281 |
23 899 |
50 666 |
36,6 |
2,9 |
2,4 |
0,8 |
5,0 |
1,7 |
|

|
|
|
|
|
|
|
|
|
|
|
|
|
|
Table/Таблица/Tabelle 3 |
||
|
|
|
|
Structure of fire service calls in the countries of the world in 2010 |
|
|
|
|
|
|||||||
|
|
|
Структура объема боевой работы противопожарных служб в странах мира в 2010 г. |
|
|
|
||||||||||
|
|
|
|
Struktur der Feuerwehreinsätze in den Staaten im Jahr 2010 |
|
|
|
|
|
|||||||
|
|
|
|
|
|
|
|
Number of calls |
|
|
|
|
|
|
|
|
|
|
|
|
|
|
|
|
|
|
|
|
|
|
|
||
|
|
Country |
fires |
in |
incidents |
in |
technical |
in |
medical |
in |
|
false |
|
in |
other |
in |
|
|
|
|
% |
accidents |
% |
aid |
% |
aid |
% |
|
calls |
|
% |
|
% |
|
|
|
|
|
|
|
|
Число выездов |
|
|
|
|
|
|
|
|
|
|
|
|
|
|
|
|
|
|
|
|
|
|
|
||
N |
|
Страна |
на |
в |
на |
в |
тех. |
в |
мед. |
в |
|
ложные |
|
в |
другие |
в |
|
|
|
пожары |
% |
аварии |
% |
помощь |
% |
помощь |
% |
|
вызовы |
|
% |
|
% |
|
|
|
|
|
|
|
Anzahl der Einsätze ... |
|
|
|
|
|
|
|
||
|
|
|
|
|
|
|
|
|
|
|
|
|
|
|||
|
|
Staat |
zu |
in |
zu |
in |
Techn. |
in |
Medizin. |
in |
|
Fehl- |
|
in |
Sonstiges |
in |
|
|
|
Bränden |
% |
Havarien |
% |
Hilfe |
% |
Hilfe |
% |
|
einsätze |
|
% |
|
% |
1 |
|
Austria |
|
|
|
|
|
|
|
|
|
26 603 |
|
12,5 |
|
|
|
34 364 |
16,2 |
125 963 |
59,3 |
- |
- |
0 |
0,0 |
|
|
25 453 |
12,0 |
||||
2 |
|
Belarus |
10 023 |
44,3 |
2 811 |
12,4 |
- |
- |
1 922 |
8,5 |
|
382 |
|
1,7 |
7 468 |
33,0 |
3 |
|
Bulgaria |
25 030 |
60,8 |
10 496 |
25,5 |
- |
- |
258 |
0,6 |
|
2 034 |
|
4,9 |
3 380 |
8,2 |
4 |
|
Croatia |
5 036 |
15,8 |
12 665 |
71,5 |
- |
- |
- |
- |
|
- |
|
- |
14 198 |
44,5 |
5 |
|
Cyprus |
7 160 |
53,8 |
5 600 |
41,9 |
- |
- |
48 |
0,4 |
|
546 |
|
4,1 |
- |
- |
6 |
|
Denmark |
16 723 |
44,0 |
3 444 |
9,1 |
- |
- |
0 |
0,0 |
|
14 446 |
|
38,0 |
3 431 |
9,0 |
7 |
|
Estonia |
6 439 |
28,2 |
1 058 |
4,6 |
5 452 |
23,9 |
- |
- |
|
7 676 |
|
44,2 |
2 201 |
12,7 |
8 |
|
Finland |
14 992 |
19,7 |
29 682 |
26,9 |
- |
- |
27 044 |
24,5 |
|
34 189 |
|
31,0 |
4 480 |
4,1 |
9 |
|
France |
336 867 |
8,4 |
2 922 100 |
72,5 |
- |
- |
169 900 |
4,2 |
|
- |
|
- |
602 900 |
15,0 |
10 |
|
Great Britain |
286 500 |
45,9 |
- |
- |
- |
- |
- |
- |
|
337 300 |
|
54,1 |
- |
- |
11 |
|
Hungary |
16 756 |
20,4 |
63 602 |
77,5 |
- |
- |
0 |
0,0 |
|
1 676 |
|
2,0 |
- |
- |
12 |
|
Italy |
197 166 |
26,8 |
42 697 |
5,8 |
84 199 |
11,4 |
0 |
0,0 |
|
19 507 |
|
2,6 |
393 339 |
53,4 |
13 |
|
Kazachstan |
19058 |
31,5 |
4446 |
7,3 |
- |
- |
0 |
0,0 |
|
251 |
|
0,4 |
36756 |
60,7 |
14 |
|
Latvia |
8 175 |
60,7 |
3 431 |
25,5 |
- |
- |
0 |
0,0 |
|
1 863 |
|
13,8 |
- |
- |
15 |
|
Lithuania |
13 411 |
53,9 |
6 151 |
24,7 |
- |
- |
465 |
1,9 |
|
1 015 |
|
4,1 |
3 846 |
15,5 |
16 |
|
New Zealand |
18 622 |
26,8 |
17 581 |
25,3 |
- |
- |
- |
- |
|
22 227 |
|
31,9 |
11 149 |
16,0 |
17 |
|
Norway |
9 484 |
23,7 |
1 098 |
2,7 |
- |
- |
947 |
2,4 |
|
1 169 |
|
2,9 |
27 289 |
68,2 |
18 |
|
Poland |
135 555 |
49,3 |
58 935 |
21,4 |
29 020 |
10,6 |
7 574 |
2,8 |
|
17 960 |
|
6,5 |
25 996 |
9,5 |
19 |
|
Portugal |
26 800 |
2,3 |
42 000 |
3,6 |
- |
- |
1 000 000 |
84,5 |
|
14 000 |
|
1,2 |
100 000 |
8,5 |
20 |
|
Romania |
13 167 |
7,3 |
1 983 |
1,0 |
13 347 |
6,9 |
146 643 |
76,1 |
|
7 237 |
|
3,8 |
10 259 |
5,3 |
21 |
|
Serbia |
17 304 |
45,1 |
1 387 |
3,6 |
- |
- |
- |
- |
|
277 |
|
0,7 |
19 365 |
50,5 |
22 |
|
Singapore |
4 600 |
3,5 |
- |
- |
- |
- |
122 605 |
94,2 |
|
2 998 |
|
2,3 |
- |
- |
23 |
|
Slovakia |
9 979 |
23,8 |
7 734 |
18,5 |
22 240 |
53,1 |
0 |
0,0 |
|
1 050 |
|
2,5 |
849 |
2,0 |
24 |
|
Ukraine |
62 207 |
33,9 |
8 398 |
4,6 |
12 255 |
6,7 |
- |
- |
|
19 375 |
|
10,6 |
81 176 |
44,3 |
25 |
|
USA |
1 331 500 |
4,5 |
2 251 500 |
7,7 |
1 189 500 |
4,0 |
18 522 000 |
63,0 |
|
2 187 000 |
|
7,4 |
3 913 000 |
13,3 |
Total/Итого/Gesamt |
|
|
|
|
|
|
|
|
|
2 720 781 |
|
7,2 |
|
|
||
2 626 918 |
7,0 |
5 624 762 |
15,0 |
1 356 013 |
3,6 |
19 999 406 |
53,2 |
|
|
5 286 535 |
14,1 |
|||||

|
|
|
|
|
|
|
|
|
|
|
|
|
|
|
|
Table/Таблица/Tabelle 4 |
|||
|
|
|
|
|
Distribution of fires by fire origin in the countries of the world in 2010 |
|
|
|
|
|
|||||||||
|
|
|
|
Распределение пожаров по местам возникновения в странах мира в 2010 г. |
|
|
|
|
|
||||||||||
|
|
|
Verteilung der Brände nach Objekten der Brandentstehung in den Staaten im Jahr 2010 |
|
|
|
|
|
|||||||||||
|
|
|
|
|
|
|
|
|
Number of fires … |
|
|
|
|
|
|
|
|
||
|
|
|
|
|
|
|
|
|
|
|
|
|
|
|
|
|
|||
|
|
Country |
structure |
in |
chimneys |
in |
out of |
in |
vehicles |
in |
forests |
in |
grass, |
|
in |
rubbish |
in |
other |
in |
|
|
|
fires |
% |
|
% |
buildings |
% |
|
% |
|
% |
brush |
|
% |
|
% |
|
% |
|
|
|
|
|
|
|
|
|
Число пожаров … |
|
|
|
|
|
|
|
|
||
|
|
|
|
|
|
|
|
|
|
|
|
|
|
|
|
|
|||
N |
|
Страна |
в |
в |
в дымо- |
в |
вне |
в |
На транс- |
в |
в |
в |
травы, |
|
в |
мусора, |
в |
другие |
в |
|
|
|
зданиях |
% |
ходах |
% |
зданий |
% |
порте |
% |
лесах |
% |
кустов |
|
% |
свалок |
% |
|
% |
|
|
|
|
|
|
|
|
|
Anzahl der Brände … |
|
|
|
|
|
|
|
|
||
|
|
|
|
|
|
|
|
|
|
|
|
|
|
|
|
|
|||
|
|
Staat |
in Ge- |
in |
Schorn- |
in |
Frei- |
in |
Trans- |
in |
im |
in |
Gras |
|
in |
Abfall |
in |
Sonstige |
in |
|
|
|
bäuden |
% |
stein |
% |
land |
% |
port |
% |
Wald |
% |
usw. |
|
% |
Müll |
% |
|
% |
1 |
|
Austria |
|
|
|
|
|
|
|
|
|
|
|
|
9,4 |
|
|
|
|
|
8 988 |
55,3 |
1 273 |
7,8 |
- |
- |
1 374 |
8,5 |
514 |
3,2 |
1 528 |
|
- |
- |
2 564 |
15,8 |
|||
2 |
|
Belarus |
- |
- |
- |
- |
- |
- |
- |
- |
511 |
5,1 |
1 036 |
|
10,3 |
- |
- |
8 476 |
84,6 |
3 |
|
Bulgaria |
3 320 |
13,3 |
217 |
0,9 |
- |
- |
1 958 |
7,8 |
76 |
0,3 |
8 231 |
|
32,9 |
635 |
2,5 |
10 593 |
42,3 |
4 |
|
Croatia |
893 |
17,7 |
263 |
5,2 |
- |
- |
611 |
12,1 |
675 |
13,4 |
1 159 |
|
23,0 |
145 |
2,9 |
1 290 |
25,6 |
5 |
|
Cyprus |
553 |
7,7 |
61 |
0,9 |
- |
- |
372 |
5,2 |
76 |
1,1 |
4 580 |
|
64,0 |
362 |
5,1 |
1 156 |
16,1 |
6 |
|
Czechia |
5 259 |
29,3 |
304 |
1,7 |
- |
- |
2 155 |
12,0 |
732 |
4,1 |
558 |
|
3,1 |
5 202 |
29,0 |
3 727 |
20,8 |
7 |
|
Denmark |
5 994 |
35,8 |
1 061 |
6,3 |
- |
- |
3 244 |
19,4 |
- |
- |
1 743 |
|
10,4 |
2 201 |
13,2 |
2 480 |
14,8 |
8 |
|
Estonia |
1 850 |
28,7 |
110 |
1,7 |
- |
- |
339 |
5,3 |
30 |
0,5 |
1 424 |
|
22,1 |
1 530 |
23,8 |
1 156 |
18,0 |
9 |
|
Finland |
5 928 |
39,0 |
408 |
2,7 |
- |
- |
2 438 |
16,0 |
1 412 |
9,3 |
1 688 |
|
12,2 |
241 |
1,6 |
3 093 |
20,3 |
10 |
|
France |
88 607 |
26,3 |
- |
- |
- |
- |
64 244 |
19,1 |
- |
- |
63 147 |
|
18,7 |
- |
- |
120 869 |
35,9 |
11 |
|
Great Britain |
59 600 |
22,9 |
10 000 |
3,5 |
26 300 |
9,2 |
32 500 |
11,3 |
- |
- |
61 300 |
|
21,4 |
- |
- |
96 800 |
33,8 |
12 |
|
Hungary |
7 255 |
43,4 |
- |
- |
- |
- |
1 384 |
8,3 |
- |
- |
7 428 |
|
44,4 |
- |
- |
646 |
3,9 |
13 |
|
Latvia |
3 622 |
44,3 |
489 |
6,0 |
- |
- |
440 |
5,4 |
88 |
1,1 |
2 006 |
|
28,6 |
1 085 |
13,3 |
445 |
5,4 |
14 |
|
Lithuania |
2 493 |
20,5 |
944 |
7,7 |
- |
- |
1 225 |
10,0 |
108 |
0,9 |
2 825 |
|
23,2 |
2 986 |
24,5 |
1 609 |
13,2 |
15 |
|
New Zealand |
4 205 |
22,6 |
533 |
2,9 |
- |
- |
1 997 |
10,7 |
- |
- |
4 768 |
|
25,6 |
4 443 |
23,9 |
2 676 |
18,9 |
16 |
|
Norway |
5 346 |
56,4 |
- |
- |
- |
- |
1 138 |
12,0 |
62 |
0,7 |
1 002 |
|
10,6 |
- |
- |
1 932 |
20,4 |
17 |
|
Poland |
28 274 |
20,9 |
326 |
0,2 |
- |
- |
8 879 |
6,6 |
4 198 |
3,1 |
23 645 |
|
17,4 |
27 875 |
20,6 |
42 358 |
31,2 |
18 |
|
Portugal |
8 500 |
16,0 |
1 100 |
2,1 |
- |
- |
4 000 |
7,5 |
13 200 |
24,9 |
- |
|
- |
13 100 |
24,7 |
13 117 |
32,9 |
19 |
|
Romania |
7 150 |
54,3 |
2 197 |
16,7 |
- |
- |
1 848 |
14,0 |
40 |
0,3 |
61 |
|
0,5 |
221 |
1,7 |
1 650 |
12,5 |
20 |
|
Russia |
147 599 |
85,1 |
- |
- |
6 067 |
3,4 |
23 649 |
13,2 |
- |
- |
- |
|
- |
- |
- |
2 185 |
1,2 |
21 |
|
Serbia |
6 255 |
36,1 |
1 142 |
6,6 |
- |
- |
1 593 |
9,2 |
254 |
1,5 |
2 957 |
|
17,1 |
2 996 |
17,3 |
2 107 |
12,2 |
22 |
|
Singapore |
2 825 |
54,0 |
- |
- |
- |
- |
628 |
12,0 |
- |
- |
314 |
|
6,0 |
- |
- |
1 461 |
27,9 |
23 |
|
Slovakia |
2 426 |
24,6 |
414 |
4,2 |
- |
- |
1 125 |
11,4 |
123 |
1,2 |
2 094 |
|
21,3 |
2 088 |
21,2 |
1 581 |
16,0 |
24 |
|
Slovenia |
1 456 |
38,6 |
447 |
11,9 |
- |
- |
432 |
11,5 |
386 |
10,2 |
121 |
|
3,2 |
516 |
13,7 |
412 |
10,9 |
25 |
|
Ukraine |
34 294 |
55,1 |
- |
- |
18 954 |
30,5 |
3 198 |
5,1 |
3 240 |
5,2 |
- |
|
- |
- |
- |
2 521 |
4,1 |
26 |
|
USA |
482 000 |
36,2 |
- |
- |
72 500 |
5,4 |
215 500 |
16,2 |
- |
- |
304 000 |
|
22,8 |
173 000 |
13,0 |
84 500 |
6,3 |
Total/Итого/Gesamt |
|
|
|
|
|
|
|
|
|
|
|
|
19,2 |
|
|
|
|
||
924 692 |
35,7 |
21 289 |
0,8 |
91 454 |
3,5 |
376 271 |
16,0 |
25 725 |
1,0 |
497 615 |
|
238 626 |
9,2 |
411 404 |
15,9 |
||||

|
|
|
|
|
|
|
|
|
|
|
|
|
|
Table/Таблица/Tabelle 5 |
||
|
|
|
|
Distribution of countries by number of structure and vehicle fires and by fire deaths at these fires in 2010 |
|
|||||||||||
|
|
Распределение стран по числу пожаров в зданиях и на транспорте и по числу погибших при этих пожарах в 2010 г. |
|
|||||||||||||
|
|
Rangfolge der Staaten nach der Anzahl der Gebäudeund Transportbrände sowie der Zahl der Brandtoten in diesen Bereichen in 2010 |
||||||||||||||
|
|
|
|
Population |
|
Number of |
|
Part of |
|
Number of |
|
Number of structure |
|
Number of fire |
|
Number of |
|
|
|
|
|
|
|
|
|
|
|||||||
|
|
Country |
|
thous.inh. |
|
structure and |
|
all fires, |
|
fire deaths* |
|
and vehicle fires |
|
deaths |
|
fire deaths |
|
|
|
|
|
|
vehicle fires |
|
% |
|
|
|
per 1.000 inh. |
|
реr 100.000 inh. |
|
per 100 fires |
|
|
|
|
|
|
|
|
|
|
|
|
|
|
|
|
|
|
|
|
|
Население, |
|
Число пожаров |
|
Доля от |
|
Число |
|
Число пожаров в |
|
Число погибших |
|
Число |
N |
|
Страна |
|
тыс. чел. |
|
в зданиях и на |
|
общего числа |
|
погибших при |
|
зданиях и на транс- |
|
в таких пожарах |
|
погибших на |
|
|
|
|
|
|
транспорте |
|
пожаров, % |
|
этих пожарах* |
|
порте на 1.000 чел. |
|
на 100.000 чел. |
|
100 пожаров |
|
|
|
|
|
|
|
|
|
|
|
|
|
|
|
|
|
|
|
|
|
Einwohner |
|
Anzahl der |
|
Anteil von |
|
Anzahl der |
|
Anzahl der Gebäude- |
|
Anzahl der Brand- |
|
Anzahl der |
|
|
Staat |
|
in |
|
Gebäudeund |
|
der Gesamt- |
|
Brandtoten |
|
und Transportbrände |
|
toten dieser Brände |
|
Brandtoten |
|
|
|
|
1 000 |
|
Transportbrände |
|
brandzahl, % |
|
dieser Brände* |
|
je 1.000 Einwohner |
|
je 100.000 Einw. |
|
je 100 Brände |
1 |
|
USA |
|
|
|
|
|
|
|
0,4 |
||||||
|
|
311 537 |
|
697 500 |
|
52,4 |
|
2 964 |
|
2,2 |
|
1,0 |
|
|||
2 |
|
Russia |
|
141 900 |
|
171 248 |
|
95,6 |
|
12 407 |
|
1,2 |
|
8,7 |
|
7,2 |
3 |
|
France |
|
65 027 |
|
152 851 |
|
45,4 |
|
416 |
|
2,4 |
|
0,6 |
|
0,3 |
4 |
|
Great Britain |
|
60 003 |
|
102 100 |
|
35,6 |
|
6 |
|
1,7 |
|
0,0 |
|
0,0 |
5 |
|
Ukraine |
|
45 871 |
|
37 492 |
|
60,3 |
|
2 678 |
|
0,8 |
|
5,8 |
|
7,1 |
6 |
|
Poland |
|
38 167 |
|
37 479 |
|
27,6 |
|
499 |
|
1,0 |
|
1,3 |
|
1,3 |
9 |
|
Romania |
|
21 504 |
|
11 195 |
|
85,0 |
|
235 |
|
0,5 |
|
1,1 |
|
2,1 |
10 |
|
Portugal |
|
11 000 |
|
13 600 |
|
50,7 |
|
0 |
|
1,2 |
|
0,0 |
|
0,0 |
11 |
|
Czechia |
|
10 517 |
|
7 718 |
|
43,0 |
|
124 |
|
0,7 |
|
1,2 |
|
1,6 |
13 |
|
Hungary |
|
9 999 |
|
8 639 |
|
51,7 |
|
106 |
|
0,9 |
|
1,1 |
|
1,2 |
14 |
|
Austria |
|
8 388 |
|
11 635 |
|
33,9 |
|
37 |
|
1,4 |
|
0,4 |
|
0,3 |
15 |
|
Serbia |
|
7 566 |
|
8990 |
|
52,0 |
|
80 |
|
1,2 |
|
1,1 |
|
0,9 |
16 |
|
Bulgaria |
|
7 364 |
|
5 495 |
|
22,0 |
|
75 |
|
0,7 |
|
1,0 |
|
1,4 |
17 |
|
Denmark |
|
5 500 |
|
10 299 |
|
61,6 |
|
74 |
|
1,9 |
|
1,3 |
|
0,7 |
18 |
|
Slovakia |
|
5 435 |
|
3 965 |
|
39,7 |
|
39 |
|
0,7 |
|
0,7 |
|
1,0 |
19 |
|
Finland |
|
5 375 |
|
8 774 |
|
57,7 |
|
76 |
|
1,6 |
|
1,4 |
|
0,9 |
20 |
|
Norway |
|
4 858 |
|
6 484 |
|
68,4 |
|
65 |
|
1,3 |
|
1,3 |
|
1,0 |
21 |
|
Croatia |
|
4 290 |
|
1 767 |
|
35,1 |
|
25 |
|
0,4 |
|
0,6 |
|
1,4 |
22 |
|
New Zealand |
|
4 271 |
|
6 735 |
|
36,1 |
|
26 |
|
1,6 |
|
0,6 |
|
0,4 |
23 |
|
Lithuania |
|
3 245 |
|
4 662 |
|
34,8 |
|
221 |
|
1,4 |
|
6,8 |
|
4,7 |
24 |
|
Latvia |
|
2 230 |
|
4 551 |
|
55,7 |
|
142 |
|
2,0 |
|
6,4 |
|
3,1 |
25 |
|
Slovenia |
|
2050 |
|
2335 |
|
61,9 |
|
15 |
|
1,1 |
|
0,7 |
|
0,6 |
26 |
|
Estonia |
|
1 340 |
|
2 299 |
|
35,3 |
|
59 |
|
1,7 |
|
4,4 |
|
2,6 |
27 |
|
Cyprus |
|
839 |
|
986 |
|
13,8 |
|
6 |
|
1,2 |
|
0,7 |
|
0,6 |
Total/Итого/Gesamt |
|
|
|
|
|
|
|
1,5 |
||||||||
|
776 097 |
|
1 318 799 |
|
47,7 |
|
20 375 |
|
1,7 |
|
2,6 |
|
||||
* 95% of all fire deaths (estimation report N6)/95 % от общего числа погибших (оценка отчета № 6)/95 % der Gesamtzahl an Brandtoten (Schätzung aus dem Bericht № 6)

Table/Таблица/Tabelle 6
Trends in fires in the countries of the world in 2006-2010
Динамика числа пожаров в странах мира за 2006-2010 Dynamik der Brandzahlen in den Staaten der Welt für die Jahre 2006-2010
|
|
|
|
Population, |
|
Number of fires |
|
Average |
|||
|
|
Country |
|
|
|
|
|
|
|
per 1000 |
|
|
|
|
thous. inh. |
2006 |
2007 |
2008 |
2009 |
2010 |
per year |
||
|
|
|
|
inh.a year |
|||||||
|
|
|
|
|
|
|
|
|
|
|
|
|
|
|
|
Население, |
|
Число пожаров |
|
Среднее |
|||
|
|
|
|
|
|
||||||
N |
|
Страна |
|
|
|
|
|
|
|
|
|
|
|
|
|
|
|
|
|
на 1000 |
|||
|
|
тыс. чел. |
2006 |
2007 |
2008 |
2009 |
2010 |
в год |
|||
|
|
|
|
чел.в год |
|||||||
|
|
|
|
|
|
|
|
|
|
|
|
|
|
|
|
Einwohner in |
|
Gesamtanzahl der Brände in … |
|
Mittelwert |
|||
|
|
|
|
|
|
||||||
|
|
Staat |
|
|
|
|
|
|
|
je Jahr und |
|
|
|
1.000 |
2006 |
2007 |
2008 |
2009 |
2010 |
je Jahr |
|||
|
|
|
1.000 Einw. |
||||||||
|
|
|
|
|
|
|
|
|
|
|
|
1 |
|
USA |
|
|
|
|
|
|
|
|
|
|
311 537 |
1 642 500 |
1 557 500 |
1 451 500 |
1 348 500 |
1331500 |
1 466 300 |
4,71 |
|||
2 |
|
Bangladesh |
156 000 |
- |
9 196 |
9 310 |
12 182 |
- |
10 229 |
0,07 |
|
3 |
|
Russia |
141 900 |
220 400 |
212 600 |
201 706 |
187 600 |
179500 |
200 361 |
1,41 |
|
4 |
|
Vietnam |
86 000 |
2 124 |
2 668 |
- |
1 948 |
2231 |
2 243 |
0,03 |
|
5 |
|
Germany |
82 218 |
187 604 |
186 254 |
196 713 |
- |
- |
190 190 |
2,31 |
|
6 |
|
France |
65 027 |
359 300 |
330 600 |
312 100 |
343 300 |
336867 |
336 433 |
5,17 |
|
7 |
|
UK* |
60 776 |
436 047 |
384 000 |
327 448 |
- |
285500 |
358 249 |
5,89 |
|
8 |
|
Italy |
58 500 |
227 014 |
246 392 |
236 731 |
210 548 |
197166 |
223 570 |
3,82 |
|
9 |
|
Spain |
47 021 |
- |
- |
- |
- |
115267 |
115 267 |
2,45 |
|
10 |
|
Ukraine |
45 871 |
49 114 |
50 583 |
49 838 |
44 015 |
62207 |
51 151 |
1,12 |
|
11 |
|
Poland |
38 167 |
165 353 |
151 069 |
161 744 |
159 122 |
135555 |
154 569 |
4,05 |
|
12 |
|
Malaysia |
24 500 |
18 913 |
20 226 |
- |
- |
- |
19 570 |
0,80 |
|
13 |
|
Romania |
21 504 |
12 926 |
21 784 |
15 530 |
15 760 |
13167 |
15 833 |
0,74 |
|
14 |
|
Netherlands |
16 306 |
- |
- |
47 327 |
- |
- |
47 327 |
2,90 |
|
15 |
|
Kazachstan |
15 819 |
18 973 |
19 111 |
19 098 |
17 184 |
19058 |
18 685 |
1,18 |
|
16 |
|
Greece |
11 283 |
- |
32 593 |
33 976 |
37 779 |
- |
34 783 |
3,08 |
|
17 |
|
Portugal |
11 000 |
- |
- |
41 624 |
44 849 |
26800 |
37 758 |
3,43 |
|
18 |
|
Belgium |
10 667 |
- |
- |
27 095 |
- |
- |
27 095 |
2,54 |
|
19 |
|
Czechia |
10 517 |
19 665 |
21 835 |
20 406 |
20 177 |
17937 |
20 004 |
1,90 |
|
20 |
|
Hungary |
9 999 |
21 829 |
25 543 |
19 828 |
26 357 |
16756 |
22 063 |
2,21 |
|
21 |
|
Belarus |
9 500 |
11 031 |
9 498 |
8 654 |
- |
10023 |
9 802 |
1,03 |
|
22 |
|
Sweden |
9 341 |
27 106 |
30 005 |
28 693 |
29 493 |
- |
28 824 |
3,09 |
|
23 |
|
Austria |
8 388 |
30 297 |
36 756 |
36 031 |
36 427 |
34363 |
34 775 |
4,15 |
|
24 |
|
Switzerland |
7 786 |
16 307 |
13 408 |
15 503 |
15 094 |
- |
15 078 |
1,94 |
|
25 |
|
Serbia |
7 566 |
5 712 |
6 948 |
6 673 |
6 168 |
17304 |
8 561 |
1,13 |
|
26 |
|
Bulgaria |
7 364 |
29 090 |
38 187 |
38 099 |
30 219 |
25030 |
32 125 |
4,36 |
|
27 |
|
Denmark |
5 500 |
16 965 |
- |
20 786 |
18 946 |
16723 |
18 355 |
3,34 |
|
28 |
|
Slovakia |
5 435 |
10 422 |
14 366 |
11 267 |
11 991 |
9979 |
11 605 |
2,14 |
|
29 |
|
Finland |
5 375 |
17 800 |
14 156 |
- |
15 057 |
15208 |
15 555 |
2,89 |
|
30 |
|
Kyrgyzstan |
5 100 |
2 739 |
3 264 |
3 104 |
3 278 |
6145 |
3 706 |
0,73 |
|
31 |
|
Singapore |
4 987 |
- |
- |
- |
5 236 |
4600 |
4 918 |
0,99 |
|
32 |
|
Norway |
4 858 |
13 499 |
15 272 |
- |
- |
9480 |
12 750 |
2,62 |
|
33 |
|
Croatia |
4 290 |
7 117 |
7 416 |
8 008 |
7 549 |
5036 |
7 025 |
1,64 |
|
34 |
|
New Zealand |
4 271 |
24 405 |
24 802 |
24 315 |
21 060 |
18622 |
22 641 |
5,30 |
|
35 |
|
Ireland |
4 109 |
33 460 |
34 669 |
35 386 |
- |
- |
34 505 |
8,40 |
|
36 |
|
Lithuania |
3 245 |
24 030 |
16 650 |
15 760 |
16 195 |
13411 |
17 209 |
5,30 |
|
37 |
|
Latvia |
|
2 230 |
17 720 |
10 179 |
8 967 |
9 317 |
8175 |
10 872 |
4,88 |
38 |
|
Slovenia |
2 050 |
- |
- |
4 504 |
7 110 |
3770 |
5 128 |
2,50 |
|
39 |
|
Estonia |
1 340 |
14 900 |
10 400 |
9 170 |
8 421 |
6439 |
9 866 |
7,36 |
|
40 |
|
Cyprus |
803 |
- |
5 993 |
6 505 |
5 716 |
7160 |
6 344 |
7,90 |
|
Total/Итого/Gesamt: |
|
|
|
|
|
|
|
|
|||
1 328 150 |
3 684 362 |
3 563 923 |
3 453 399 |
2 716 598 |
2 950 979 |
3 273 852 |
2,46 |
||||
* - data of 2009-2010 year for Great Britain

Table/Таблица/Tabelle 7
Trends in fire deaths in the countries of the world in 2006-2010
Динамика числа жертв пожаров в странах мира за 2006-2010 Dynamik der Brandtotenzahlen in den Staaten für die Jahre 2006-2010
|
|
|
|
Population, |
|
Number of fire deaths |
|
Average number |
||||
|
|
Country |
|
|
|
|
|
|
|
per 100 |
per 100 |
|
|
|
|
thous. inh. |
2006 |
2007 |
2008 |
2009 |
2010 |
per year |
|||
|
|
|
|
thous.inh. |
fires |
|||||||
|
|
|
|
Население, |
|
Число погибших |
|
Среднее число |
||||
|
|
|
|
|
|
|||||||
|
|
Страна |
|
|
|
|
|
|
|
на 100 |
на 100 |
|
N |
|
|
тыс. чел. |
2006 |
2007 |
2008 |
2009 |
2010 |
в год |
|||
|
|
|
тыс.чел. |
пожаров |
||||||||
|
|
|
|
|
|
|
|
|
|
|
||
|
|
|
|
|
|
Anzahl der Brandtoten |
|
|
Mittelwert |
|
||
|
|
|
|
|
|
|
|
|
||||
|
|
Staat |
|
Einwohner in |
|
|
|
|
|
|
je 100.000 |
je 100 |
|
|
|
1.000 |
2006 |
2007 |
2008 |
2009 |
2010 |
je Jahr |
|||
|
|
|
|
Einw. |
Brände |
|||||||
|
|
|
|
|
|
|
|
|
|
|
||
1 |
|
USA |
|
|
|
|
|
|
|
|
|
|
|
|
|
|
|
|
|
|
|
|
|||
|
|
311 537 |
3 245 |
3430 |
3320 |
3010 |
3 120 |
3 225 |
1,04 |
0,22 |
||
2 |
|
Russia |
|
141 900 |
17 223 |
16066 |
15165 |
13946 |
13061 |
15 092 |
10,64 |
7,53 |
3 |
|
Japan |
|
128 056 |
1 509 |
1455 |
1452 |
- |
- |
1 472 |
1,15 |
- |
4 |
|
Vietnam |
|
86 000 |
53 |
50 |
- |
62 |
60 |
56 |
0,07 |
2,51 |
5 |
|
Germany |
|
82 218 |
424 |
346 |
398 |
- |
- |
389 |
0,47 |
0,20 |
6 |
|
France |
|
65 027 |
341 |
378 |
402 |
394 |
438 |
391 |
0,60 |
0,12 |
7 |
|
UK* |
|
60 776 |
504 |
443 |
453 |
416 |
388 |
441 |
0,73 |
0,12 |
8 |
|
Italy |
|
58 500 |
112 |
67 |
80 |
109 |
74 |
88 |
0,15 |
0,04 |
9 |
|
Spain |
|
47 021 |
245 |
2325 |
270 |
196 |
192 |
646 |
1,37 |
0,56 |
10 |
|
Ukraine |
|
45 871 |
4 035 |
4005 |
3896 |
3209 |
2819 |
3 593 |
7,83 |
3,12 |
11 |
|
Poland |
|
38 167 |
608 |
605 |
574 |
584 |
525 |
579 |
1,52 |
1,13 |
12 |
|
Malaysia |
|
24500 |
71 |
80 |
- |
- |
- |
76 |
0,31 |
0,05 |
13 |
|
Romania |
|
21 504 |
220 |
252 |
225 |
234 |
247 |
236 |
1,10 |
1,20 |
14 |
|
Netherland |
|
16 306 |
80 |
|
68 |
- |
- |
74 |
0,45 |
0,47 |
15 |
|
Kazachstan |
|
15 819 |
667 |
602 |
501 |
558 |
528 |
571 |
3,61 |
1,21 |
16 |
|
Greece |
|
11 237 |
72 |
70 |
63 |
55 |
- |
65 |
0,58 |
0,35 |
17 |
|
Portugal |
|
11 000 |
65 |
75 |
- |
0 |
0 |
35 |
0,32 |
0,10 |
18 |
|
Czechia |
|
10 517 |
150 |
130 |
142 |
|
131 |
138 |
1,31 |
0,37 |
19 |
|
Hungary |
|
9 999 |
154 |
133 |
140 |
125 |
112 |
133 |
1,33 |
0,66 |
20 |
|
Belarus |
|
9 500 |
1 149 |
1084 |
1064 |
- |
1120 |
1 104 |
11,62 |
5,01 |
21 |
|
Sweden |
|
9 341 |
83 |
96 |
115 |
124 |
- |
105 |
1,12 |
1,07 |
22 |
|
Austria |
|
8 388 |
33 |
- |
50 |
36 |
39 |
40 |
0,47 |
0,14 |
23 |
|
Switzerland |
|
7 786 |
21 |
- |
- |
- |
0 |
11 |
0,13 |
0,03 |
24 |
|
Serbia |
|
7 566 |
89 |
86 |
93 |
86 |
81 |
87 |
1,15 |
0,32 |
25 |
|
Bulgaria |
|
7 364 |
96 |
105 |
112 |
122 |
79 |
103 |
1,40 |
0,68 |
26 |
|
Denmark |
|
5 500 |
71 |
- |
90 |
71 |
74 |
77 |
1,39 |
0,24 |
27 |
|
Slovakia |
|
5 435 |
49 |
53 |
68 |
56 |
41 |
53 |
0,98 |
0,29 |
28 |
|
Finland |
|
5 375 |
119 |
84 |
- |
107 |
80 |
98 |
1,81 |
0,84 |
29 |
|
Norway |
|
4 858 |
62 |
74 |
- |
- |
65 |
67 |
1,38 |
0,43 |
30 |
|
Croatia |
|
4 290 |
33 |
68 |
37 |
28 |
26 |
38 |
0,90 |
1,04 |
31 |
|
New Zealand |
|
4 271 |
25 |
33 |
34 |
36 |
34 |
32 |
0,76 |
0,66 |
32 |
|
Singapore |
|
4250 |
3 |
4 |
0 |
0 |
0 |
1 |
0,03 |
- |
33 |
|
Ireland |
|
4 109 |
42 |
41 |
35 |
- |
38 |
39 |
0,95 |
0,31 |
34 |
|
Lithuania |
|
3 245 |
307 |
297 |
270 |
203 |
233 |
262 |
8,07 |
3,73 |
35 |
|
Latvia |
|
2 230 |
235 |
207 |
163 |
145 |
144 |
179 |
8,02 |
0,79 |
36 |
|
Slovenia |
|
2 057 |
7 |
- |
19 |
- |
16 |
14 |
0,68 |
0,04 |
37 |
|
Estonia |
|
1 340 |
164 |
134 |
89 |
63 |
69 |
104 |
7,75 |
0,60 |
38 |
|
Cyprus |
|
839 |
- |
0 |
0 |
3 |
6 |
2 |
0,27 |
0,04 |
Total/Итого/Gesamt: |
|
|
|
|
|
|
|
|
|
|||
|
1 283 699 |
32 366 |
32 878 |
29 388 |
23 978 |
23 840 |
29 715 |
2,31 |
0,91 |
|||
* - data of 2009-2010 year for Great Britain

Table/Таблица/Tabelle 8
Trends in fire injuries in the countries of the world in 2007-2010
Динамика числа травмированных на пожарах в странах мира за 2007-2010 Dynamik der Brandverletzten in den Staaten für die Jahre 2007-2010
|
|
Population, |
|
Number of fire injuries |
|
Average number |
||||
|
Country |
|
|
|
|
|
per 100 |
per 100 |
||
|
thous. inh. |
2007 |
2008 |
2009 |
2010 |
per year |
||||
|
|
thous.inh. |
fires |
|||||||
|
|
Население, |
|
Число травмированных |
|
Среднее число |
||||
|
|
|
|
|||||||
N |
Страна |
|
|
|
|
|
на 100 |
на 100 |
||
тыс. чел. |
2007 |
2008 |
2009 |
2010 |
в год |
|||||
|
|
тыс.чел. |
пожаров |
|||||||
|
|
|
|
|
|
|
|
|||
|
|
Einwohner in |
|
Anzahl der Brandverletzten |
|
Mittelwert |
||||
|
|
|
|
|||||||
|
Staat |
|
|
|
|
|
je 100.000 |
je 100 |
||
|
1.000 |
2007 |
2008 |
2009 |
2010 |
je Jahr |
||||
|
|
Einw. |
Brände |
|||||||
|
|
|
|
|
|
|
|
|||
|
|
|
|
|
|
|
|
|
|
|
1 |
USA |
311 537 |
17675 |
16705 |
17050 |
17720 |
17 143 |
5,50 |
1,17 |
|
2 |
Russia |
141 900 |
13688 |
12887 |
13269 |
13117 |
13 281 |
9,36 |
6,63 |
|
3 |
France |
65 027 |
12439 |
14159 |
13637 |
13513 |
13 412 |
20,62 |
3,99 |
|
4 |
UK |
60 776 |
13200 |
12200 |
- |
- |
12 700 |
20,90 |
3,55 |
|
5 |
Italy |
58 500 |
375 |
299 |
85 |
101 |
253 |
0,43 |
0,11 |
|
6 |
Ukraine |
45 871 |
- |
1817 |
- |
- |
1 817 |
3,96 |
1,58 |
|
7 |
Poland |
38 155 |
- |
3383 |
- |
- |
3 383 |
8,87 |
6,61 |
|
8 |
Malaysia |
24 500 |
67 |
- |
- |
- |
77 |
0,31 |
0,05 |
|
9 |
Romania |
21 504 |
381 |
499 |
563 |
442 |
481 |
2,24 |
2,46 |
|
10 |
Netherland |
16 306 |
- |
843 |
- |
- |
843 |
5,17 |
5,32 |
|
11 |
Greece |
11 237 |
146 |
118 |
40 |
- |
101 |
0,90 |
0,54 |
|
12 |
Portugal |
11 000 |
- |
8 |
106 |
250 |
57 |
0,52 |
0,15 |
|
13 |
Czechia |
10 517 |
1023 |
1109 |
980 |
1060 |
1 037 |
9,86 |
3,83 |
|
14 |
Hungary |
9 999 |
583 |
492 |
609 |
455 |
561 |
5,61 |
2,81 |
|
15 |
Belarus |
9 500 |
382 |
- |
473 |
481 |
428 |
4,50 |
1,94 |
|
16 |
Sweden |
9 341 |
1352 |
1158 |
1235 |
- |
1 248 |
13,36 |
12,74 |
|
17 |
Austria |
8 338 |
106 |
- |
- |
- |
106 |
1,27 |
0,37 |
|
18 |
Serbia |
7 566 |
316 |
307 |
262 |
311 |
295 |
3,90 |
3,45 |
|
19 |
Bulgaria |
7 364 |
306 |
320 |
298 |
292 |
308 |
4,18 |
2,04 |
|
20 |
Slovakia |
5 435 |
234 |
232 |
245 |
244 |
237 |
4,36 |
1,29 |
|
21 |
Finland |
5 375 |
563 |
- |
729 |
639 |
646 |
12,02 |
5,57 |
|
22 |
Croatia |
4 290 |
147 |
98 |
99 |
92 |
115 |
2,67 |
3,09 |
|
23 |
New Zealand |
4 271 |
371 |
361 |
380 |
276 |
371 |
8,68 |
7,54 |
|
24 |
Singapore |
4 250 |
96 |
122 |
127 |
143 |
103 |
2,42 |
- |
|
25 |
Lithuania |
3 245 |
270 |
242 |
211 |
215 |
241 |
7,43 |
3,43 |
|
26 |
Latvia |
2 230 |
271 |
245 |
194 |
242 |
237 |
10,61 |
1,05 |
|
27 |
Estonia |
1 340 |
133 |
102 |
110 |
102 |
115 |
8,58 |
0,67 |
|
28 |
Cyprus |
839 |
0 |
- |
32 |
20 |
16 |
1,91 |
0,09 |
|
|
900 213 |
|
|
|
|
|
|
|
||
Total/Итого/Gesamt: |
64 124 |
67 706 |
50 734 |
49 715 |
69 612 |
7,73 |
2,13 |
|||

Table/Таблица/Tabelle 9
Trends in fire fighter deaths/injuries in the countries of the world in 2006-2010
Динамика гибели/травмирования пожарных в странах мира за 2006-2010 г.г.
Dynamik der Anzahl verunglückter Feuerwehrleute in den Staaten für 2006-2010
|
|
Country |
|
|
Number of fire fighter deaths/injuries |
|
|
Average |
|||
|
|
|
2006 |
2007 |
2008 |
2009 |
|
2010 |
|
per year |
|
|
|
|
|
|
|
||||||
N |
|
Страна |
|
Число погибших/травмированных пожарных |
|
Среднее |
|||||
|
|
|
|||||||||
|
|
2006 |
2007 |
2008 |
2009 |
|
2010 |
|
в год |
||
|
|
|
|
|
|
||||||
|
|
Staat |
|
|
Anzahl der FM (getötet / verletzt) |
|
|
Mittelwert |
|||
|
|
|
|
|
|
||||||
|
|
|
2006 |
2007 |
2008 |
2009 |
|
2010 |
|
je Jahr |
|
|
|
|
|
|
|
||||||
1 |
|
Austria |
|
|
|
|
|
|
1/1123 |
|
|
|
|
3/854 |
6/1208 |
2/1439 |
3/1153 |
|
|
3/1155 |
|||
2 |
|
Belarus |
|
- |
0/6 |
- |
- |
|
6/11 |
|
3/8 |
3 |
|
Belgium |
|
- |
- |
3/- |
- |
|
- |
|
3/- |
4 |
|
Bulgaria |
|
1/13 |
0/31 |
0/19 |
0/22 |
|
0/12 |
|
0/19 |
5 |
|
China |
|
- |
- |
16/150 |
- |
|
- |
|
16/150 |
6 |
|
Croatia |
|
2/- |
14/19 |
3/9 |
1/8 |
|
2/6 |
|
4/10 |
7 |
|
Cyprus |
|
- |
- |
0/1 |
0/5 |
|
0/1 |
|
0/3 |
8 |
|
Czechia |
|
- |
0/203 |
1/227 |
0/191 |
|
0/202 |
|
0/205 |
9 |
|
Denmark |
|
- |
- |
0/- |
0/- |
|
0/- |
|
0/- |
10 |
|
Estonia |
|
0/- |
0/2 |
0/6 |
0/7 |
|
0/9 |
|
0/5 |
11 |
|
Finland |
|
0/69 |
0/69 |
- |
1/71 |
|
0/125 |
|
0/83 |
12 |
|
France |
|
11/- |
- |
- |
- |
|
13/1155 |
|
12/1155 |
13 |
|
Germany |
|
18/- |
10/17488 |
- |
- |
|
- |
|
14/17488 |
14 |
|
Greece |
|
- |
0/9 |
0/9 |
0/5 |
|
- |
|
0/8 |
15 |
|
Hungary |
|
4/71 |
0/78 |
0/395 |
0/291 |
|
0/42 |
|
2/175 |
16 |
|
Ireland |
|
- |
1/- |
- |
- |
|
- |
|
1/- |
17 |
|
Italy |
|
3/218 |
3/271 |
5/162 |
2/198 |
|
4/202 |
|
3/210 |
18 |
|
Laos |
|
0/- |
0/- |
0/- |
- |
|
- |
|
0/- |
19 |
|
Latvia |
|
0/39 |
0/30 |
0/17 |
0/14 |
|
0/11 |
|
0/22 |
20 |
|
Lithuania |
|
0/30 |
0/29 |
0/25 |
0/17 |
|
0/17 |
|
0/23 |
21 |
|
Netherlands |
|
0/16 |
- |
4/- |
- |
|
- |
|
2/16 |
22 |
|
New Zealand |
|
0/575 |
0/552 |
1/554 |
0/484 |
|
- |
|
0/541 |
23 |
|
Poland |
|
- |
1/284 |
0/301 |
2/- |
|
0/- |
|
1/292 |
24 |
|
Portugal |
|
- |
- |
0/16 |
0/176 |
|
3/178 |
|
1/123 |
25 |
|
Romania |
|
0/- |
6/120 |
1/10 |
0/26 |
|
1/19 |
|
1/43 |
26 |
|
Russia |
|
11/138 |
6/132 |
12/94 |
- |
|
7/80 |
|
9/111 |
27 |
|
Singapore |
|
0/- |
0/- |
0/- |
- |
|
- |
|
0/- |
28 |
|
Slovakia |
|
- |
- |
0/25 |
0/23 |
|
0/23 |
|
0/24 |
29 |
|
Slovenia |
|
- |
- |
0/- |
0/- |
|
0/17 |
|
0/17 |
30 |
|
Sweden |
|
0/- |
0/0 |
0/0 |
0/- |
|
- |
|
0/0 |
31 |
|
Switzerland |
|
3/234 |
- |
- |
-/213 |
|
- |
|
1/220 |
32 |
|
Ukraine |
|
2/- |
4/- |
1/- |
0/- |
|
0/- |
|
2/- |
33 |
|
USA |
|
89/- |
102/80100 |
103/- |
82/78150 |
|
72/71875 |
|
90/76700 |
34 |
|
Vietnam |
|
0/- |
0/- |
0/- |
0/- |
|
0/- |
|
0/- |
Total/Итого/Gesamt: |
|
|
|
|
|
|
109/74108 |
|
|||
|
147/2257 |
153/100625 |
152/3459 |
91/81054 |
|
|
130/52300 |
||||

Table/Таблица/Tabelle 10
Country
NСтрана
Staat
Statistics of fire services in the countries of the world in 2001-2010 |
|
|
|||||
Численность противопожарных служб в странах мира в 2001-2010 годах |
|
|
|||||
Personal und Ausstattung der Feuerwehren der Staaten in 2001-2010 |
|
|
|||||
Population |
Fire |
Number of |
|
Number of fire fighters |
|
||
thous.inh. |
stations |
engines |
ladders |
profess. |
part time |
volunt. |
total |
|
|
||||||
Население, |
Пожарные |
Число |
|
Число пожарных |
|
||
тыс. чел. |
депо |
АЦ и АН |
АЛ и КП |
проф. |
совмест. |
добр. |
всего |
Einwohner |
Feuer- |
Anzahl der Fahrzeuge |
|
Personal der Feuerwehr |
|
||
in 1.000 |
wachen |
LF, TLF |
DL, TM |
BF |
Teilzeit |
FF |
Gesamt |
1 |
China |
1 321 852 |
- |
- |
- |
130 000 |
- |
7 500 000 |
7 630 000 |
2 |
USA |
311 537 |
51 450 |
67 800 |
6 500 |
323 350 |
- |
825 450 |
1 148 800 |
3 |
Russia |
141 900 |
5 300 |
17 100 |
1 600 |
280 000 |
- |
145 000 |
425 000 |
4 |
Japan |
128 056 |
1 687 |
8 147 |
1 282 |
154 020 |
- |
944 134 |
1 098 154 |
5 |
Vietnam |
86 000 |
- |
542 |
15 |
4 481 |
- |
920 729 |
925 210 |
6 |
Germany |
82 218 |
37 717 |
43 343 |
2 107 |
40 918 |
- |
1 039 737 |
1 080 655 |
7 |
France |
65 027 |
7 277 |
4 182 |
1 192 |
40 302 |
- |
197 307 |
237 609 |
8 |
Iran |
64 000 |
452 |
1 300 |
20 |
9 285 |
- |
- |
9 285 |
9 |
UK |
60 776 |
2 053 |
2 900 |
235 |
40 100 |
19 000 |
1 400 |
60 500 |
10 |
Italy |
58 148 |
103 |
1 517 |
330 |
30 000 |
- |
3 000 |
33 000 |
11 |
South Korea |
49 000 |
144 |
2 220 |
145 |
- |
- |
- |
0 |
12 |
Poland |
38 167 |
16 920 |
19 250 |
663 |
30 144 |
0 |
445 028 |
475 172 |
13 |
Peru |
26 000 |
174 |
- |
- |
- |
- |
- |
0 |
14 |
Malaysia |
23 800 |
193 |
426 |
25 |
8 928 |
- |
11 338 |
20 266 |
15 |
Taiwan |
22 450 |
544 |
959 |
197 |
8 180 |
- |
26 500 |
34 680 |
16 |
Romania |
21 504 |
291 |
381 |
101 |
30 495 |
- |
109 829 |
140 324 |
17 |
Australia |
20 016 |
- |
4 448 |
- |
- |
- |
- |
0 |
18 |
Netherlands |
16 358 |
1 034 |
1 500 |
200 |
5 424 |
21 427 |
- |
26 851 |
19 |
Greece |
11 283 |
775 |
1 655 |
270 |
9 124 |
5 500 |
2 000 |
16 624 |
20 |
Portugal |
11 000 |
473 |
1 600 |
- |
4 100 |
0 |
45 000 |
49 100 |
21 |
Belgium |
10 667 |
252 |
1 680 |
270 |
5 519 |
0 |
12 230 |
17 749 |
22 |
Czechia |
10 517 |
7 925 |
3 767 |
324 |
12 420 |
0 |
73 422 |
85 842 |
23 |
Hungary |
9 999 |
112 |
474 |
88 |
9 037 |
0 |
12 036 |
21 073 |
24 |
Belarus |
9 500 |
- |
- |
- |
11 351 |
- |
8 055 |
19 406 |
25 |
Sweden |
9 341 |
1 016 |
- |
- |
5 167 |
10 752 |
- |
15 919 |
26 |
Austria |
8 388 |
4 856 |
890 |
309 |
2 447 |
0 |
259 984 |
262 431 |
27 |
Switzerland |
7 786 |
1 752 |
- |
- |
1 200 |
0 |
102 002 |
103 202 |
28 |
Serbia |
7 566 |
176 |
720 |
35 |
2 271 |
0 |
8 500 |
10 771 |
29 |
Bulgaria |
7 364 |
175 |
672 |
37 |
7 766 |
0 |
457 |
8 223 |
30 |
Laos |
6 522 |
17 |
52 |
1 |
244 |
0 |
0 |
244 |
31 |
Israel |
6 500 |
93 |
187 |
31 |
1 500 |
- |
400 |
1 900 |
32 |
Denmark |
5 500 |
306 |
406 |
93 |
1 840 |
4 320 |
1 840 |
8 000 |
33 |
Slovakia |
5 435 |
115 |
307 |
123 |
4 173 |
0 |
35 897 |
40 070 |
34 |
Finland |
5 375 |
1 046 |
1 736 |
85 |
3 525 |
- |
12 395 |
15 920 |
35 |
Georgia |
5 266 |
119 |
200 |
15 |
5 128 |
- |
- |
5 128 |
36 |
Norway |
4 858 |
831 |
1 119 |
49 |
3 666 |
8 351 |
0 |
12 017 |
37 |
Ireland |
4 459 |
222 |
300 |
40 |
1 453 |
2 094 |
0 |
3 547 |
38 |
Croatia |
4 290 |
1 923 |
1 898 |
83 |
3 425 |
- |
57 138 |
60 563 |
39 |
New Zealand |
4 271 |
436 |
714 |
31 |
1 789 |
0 |
7 500 |
9 289 |
40 |
Singapore |
4 200 |
14 |
91 |
18 |
1 300 |
- |
52 300 |
53 600 |
41 |
Albania |
3 601 |
45 |
68 |
6 |
724 |
- |
- |
724 |
42 |
Lithuania |
3 245 |
84 |
254 |
44 |
2 319 |
0 |
109 |
2 428 |
43 |
Mongolia |
2 400 |
42 |
70 |
5 |
2 396 |
- |
- |
2 396 |
44 |
Kuwait |
2 275 |
27 |
50 |
11 |
1 557 |
- |
- |
1 557 |
45 |
Latvia |
2 230 |
92 |
299 |
42 |
2 986 |
0 |
- |
2 986 |
46 |
Slovenia |
2 050 |
1 311 |
922 |
32 |
600 |
0 |
95 963 |
96 563 |
47 |
Estonia |
1 340 |
160 |
115 |
20 |
1 634 |
24 |
873 |
2 531 |
48 |
Cyprus |
839 |
31 |
87 |
6 |
725 |
120 |
121 |
966 |
49 |
Brunei |
333 |
16 |
8 |
18 |
987 |
- |
1 695 |
2 682 |
50 |
Barbados |
267 |
6 |
13 |
2 |
214 |
- |
- |
214 |
Total/Итого/Gesamt |
2 715 476 |
149 787 |
196 369 |
16 700 |
1 248 214 |
71 588 |
12 959 369 |
14 279 171 |
|
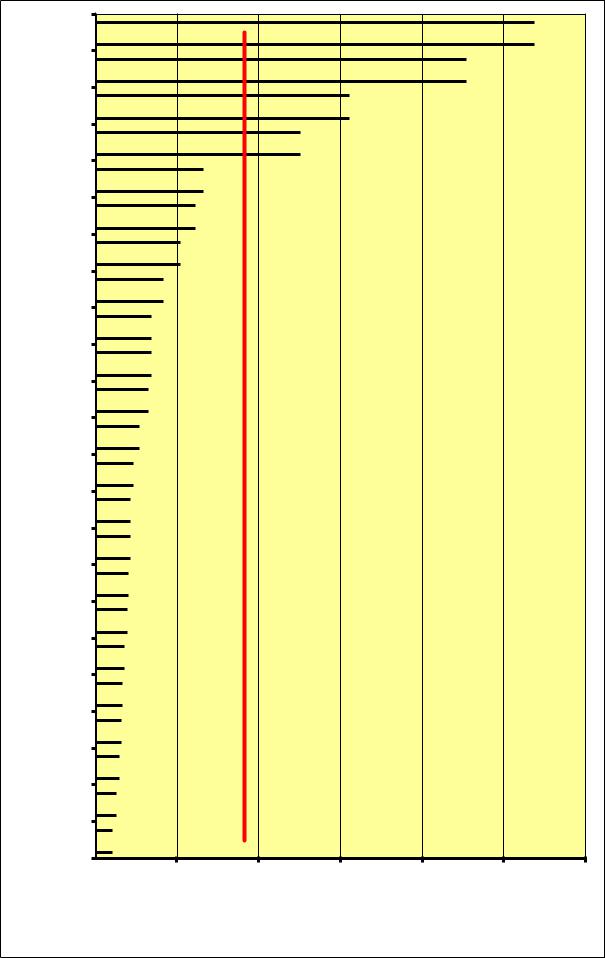
Portugal  107,2
107,2
USA  90,5
90,5
France  62,0
62,0
Cyprus  50,0
50,0
Singapore  26,1
26,1
Austria  24,2
24,2
Finland  20,5
20,5
New Zealand  16,3
16,3
Estonia  13,4
13,4
Poland  13,4
13,4
Italy  12,6
12,6
Great Britain  10,4
10,4
Romania  9,0
9,0
Norway  8,2
8,2
Hungary  8,2
8,2
Lithuania  7,7
7,7
Croatia  7,4
7,4
Denmark  6,9
6,9
Slovakia  6,3
6,3
Latvia  6,0
6,0
Bulgaria  5,6
5,6
Belarus  4,9
4,9
Ukraine  4,0
4,0
0 |
20 |
40 |
60 |
80 |
100 |
120 |
Fig. 1: Average number of calls per 1.000 inh. (2010)
Рис. 1: Среднее число выездов на 1.000 чел. (2010)
Bild 1: Mittlere Einsatzanzahl je 1.000 Einwohner (2010)