

122 / Chapter 11 2D Plots
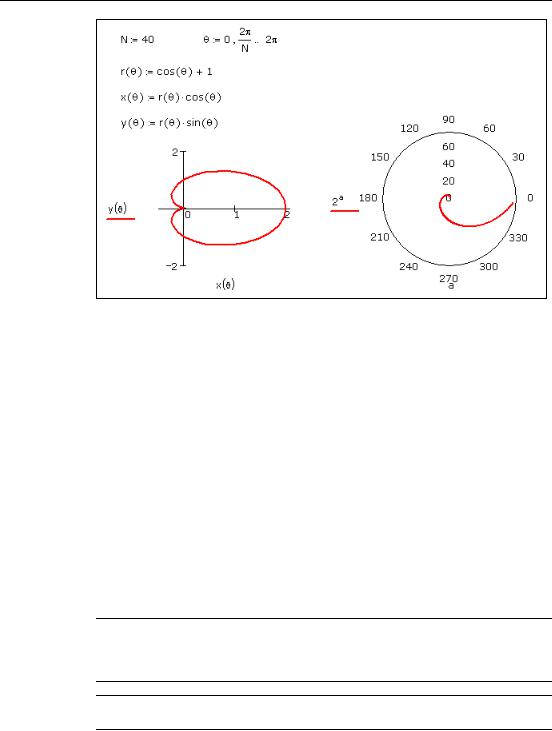
Figure 11-4: Graphing one function against another. For the X-Y plot, the independent variable, θ, is defined as a range variable. For the polar plot, Mathcad chooses a range for the independent variable, a.
Plotting Vectors of Data
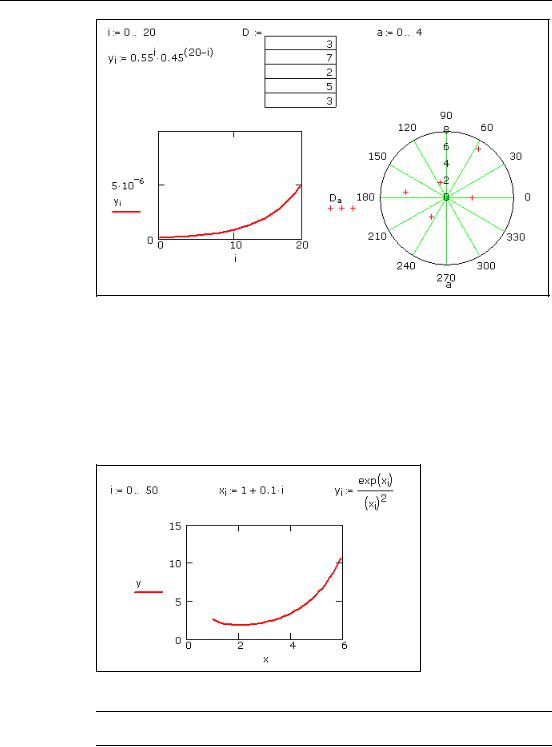
You can plot a vector of data with either an X-Y or a polar plot. You need to use the vector subscript to specify which elements to plot. Some graphs of data vectors are shown in Figure 11-5.
Plotting a Single Vector of Data
To create an X-Y plot of a single vector of data:
1.Define a range variable, such as i, that references the subscript of each element of the vector you want to plot. For example, for a vector with 10 elements, your subscript range variable is i := 0 .. 9.
2.Choose Graph > X-Y Plot from the Insert menu.
3.Enter i in the bottom placeholder and the vector name with the subscript (yi for example) in the placeholder on the left. Type [[] to create the subscript.
Note Subscripts must be integers greater than or equal to ORIGIN, meaning that the x-axis or angular variable used in the graphs in Figure 11-5 can run through whole number values only. If you want to plot fractional or negative values on the x-axis, plot a function or plot one vector against another, as described in the next section.
Tip If you have a handful of data points, you can use a data table to create a vector as shown in the second graph in Figure 11-5 or Figure 11-7. See “Entering a Matrix as a Data Table” on page 41.
Plotting Vectors of Data / 123
Figure 11-5: Graphing a vector.
Plotting One Data Vector Against Another
To plot all the elements of one data vector against all the elements in another, enter the names of the vectors in the axis placeholders:
1.Define the vectors x and y.
2.Choose Graph > X-Y Plot from the Insert menu.
3.Enter y in the y-axis placeholder and x in the x-axis placeholder. (See Figure 11-6.)
Figure 11-6: Graphing two vectors.
Note If the vectors being plotted are not the same length, Mathcad plots the number of elements in the shorter vector.
124 / Chapter 11 2D Plots
If you want to plot only certain vector elements, define a range variable and use it as a subscript on the vector names. In the example above, to plot the fifth through tenth elements of x and y against each other:
1.Define a range variable, such as k, going from 4 to 9 in increments of 1. (Note that the first elements of the vectors x and y are x0 and y0 by default.)
2.Enter yk and xk in the axis placeholders.
Note If you have a set of data values to plot, create a vector by reading in data from a data file, by pasting in the data, or by typing data directly into a data table. See Chapter 5, “Range Variables and Arrays.” See Figure 11-7 for an example showing the use of a data table.
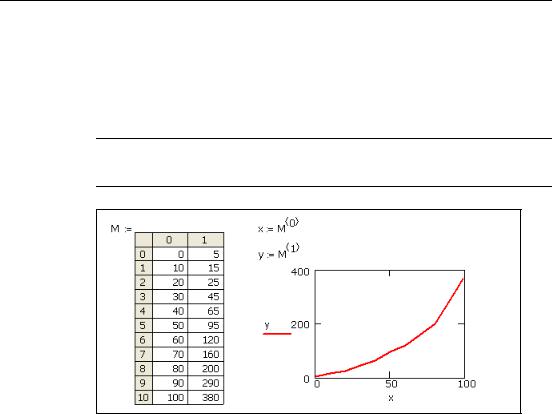
Figure 11-7: Plotting vectors from a data table. Assign column 0 to vector x.
Assign column 1 to vector y. Use [Ctrl] 6 to create the superscript.