

Micro-Cap v7.1.6 / Ug
.pdfChapter 13 |
Printing |
What's in this chapter
This chapter describes how to get copies of your work on printers. MC7 provides output in two basic ways.
•Graphics
•Schematics
•Analysis plots
•Performance plots
•3D plots
•Monte Carlo histograms
•Text
•Schematic text area
•SPICE circuit descriptions
•Document files
•AC, DC, and transient analysis numeric output
•Transient analysis state variables
•Monte Carlo statistics
All text output is available in disk file or hard copy form. Graphics output is available on any printer that your system supports.
215

Printing schematics
Schematics may contain one or more pages which may be printed. Depending upon the scale chosen, each page is partitioned into one or more sheets for printing or plotting. The Auto option scales the largest page to fit on just one sheet. The User option lets the user pick a scale and thus adjust the physical size of the schematic. Larger image sizes produce more sheets of paper per page.
To setup or preview the printed output, use these File menu options:
• Print Setup
The contents of this dialog box depend upon the type of printer chosen, but it usually lets you choose the printer, orientation, paper size, and other options. The choice of orientation affects the Print Preview partitioning.
• Print Preview
This option lets you preview how the schematic will be partitioned for printing into one or more sheets. Its display looks like Figure 13-1.
• OK
This accepts any changes and exits the dialog box.
• Cancel
This ignores any changes and exits the dialog box.
• Next Page
This displays the partitioning for the next page of the schematic. Note that the scale, whether Auto or User is chosen, applies to all pages.
• Prior Page
This selects and displays the partitioning for the prior page.
• Page
This shows the name of the page being displayed. You can display any page by selecting its name from the list.
This invokes the Print dialog box.
• Setup
This accesses the Print Setup dialog box.
216 Chapter 13: Printing
• Properties
This accesses the standard schematic Properties dialog box, which lets you make last minute changes to colors, fonts, and the title block.
• Help
This accesses the Help System.
• Auto Auto_scale
This option adjusts the scale so that the largest page in the schematic will just fit on the chosen paper size. All other pages use this scale. If Auto is clicked, Auto_scale shows the scale value used. The same result is achieved by clicking on the User button and typing the same number in the User_scale data field.
• User User_scale
This button enables the User_scale value. A scale of 100 is normal size. The User Scale data field holds the scale. A change in scale takes effect only when the Apply button is pressed.
• Apply
This updates the display to reflect changes in the User scale field.
The Title Block item on the Preferences dialog box menu lets you define the content of the five fields of the title block. Field 1 is printed in large text, and the remainder are printed in smaller text. There are several options to facilitate printing the file name, date, and page numbers. These options are enabled by placing the following key words in the desired text field.
• $NAME |
This prints the circuit name. |
• $DATE |
This prints the current date. |
• $TIME |
This prints the current time. |
• $USER |
This prints the user name. |
• $COMPANY |
This prints the company name. |
• $PAGE |
This prints the page number. |
• $PAGENAME |
This prints the schematic page name. |
• $MAXPAGE |
This prints the largest page number. |
• $SHEET |
This prints the sheet number. |
• $MAXSHEET |
This prints the largest sheet number. |
The One Title option box produces one title block per schematic if checked. If unchecked one title block per sheet is printed
217
An example of schematic printing
Load the file 'PRINT'. Select Print Preview from the File menu.
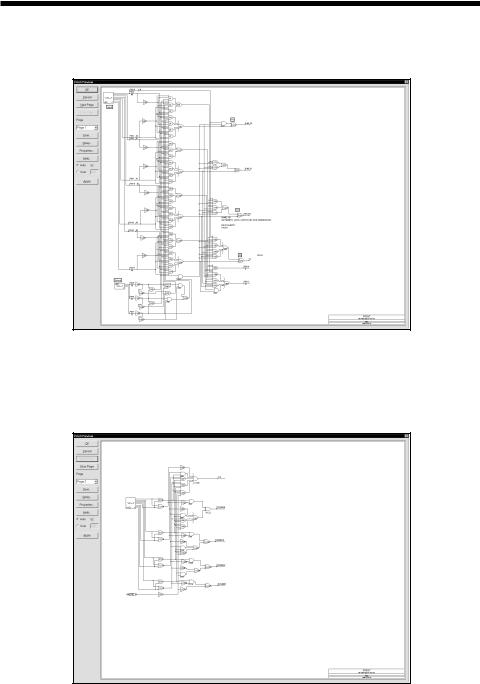
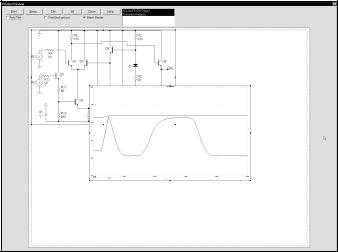
Figure 13-1 Print Preview of page one of the PRINT circuit
The Scale mode is set to Auto so MC7 prints one sheet for each of the two pages contained in this schematic. Figure 13-1 shows how page one will fit in landscape mode. Click on the Next Page button to display page two. It looks like this:
Figure 13-2 Print Preview of page two of the PRINT circuit
218 Chapter 13: Printing
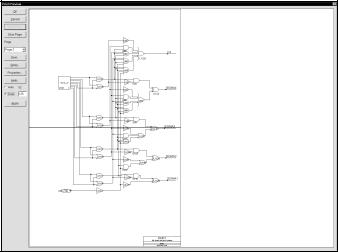
Now click on the User button. This applies the current user scale of 125 and partitions the schematic for printing. The result, shown in Figure 13-3, shows how page two will be partitioned. At this scale, two sheets of paper are required to print page two of the schematic.
Figure 13-3 The Print Preview of page two with a scale of 125
Note that clicking on the Auto or User buttons automatically update the screen. Simply editing the User scale field will not, by itself, update the screen. Clicking the mouse on the Auto, User, or Apply buttons will cause a screen update.
Once a suitable scale is chosen and the desired page ranges are selected, click on the Print button to invoke the Print dialog box to initiate printing. Of course, you need not use the Print Preview each time you want to print. If you've previously checked the Print Preview and are happy with it, simply press CTRL + P to invoke the Print dialog box.
Click on the OK button and close the file.
219
Printing an analysis plot
To produce a plot, first run the analysis. When the analysis is complete select the Print Setup option from the File menu. From this dialog box, select the orientation and other options.
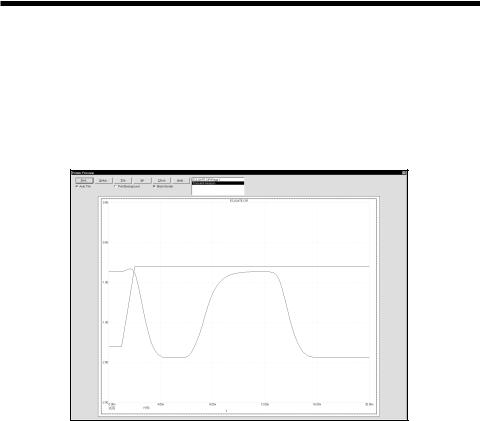
To illustrate, load the file ECLGATE and run transient analysis. Select Print Preview from the File menu. It should look like this:
Figure 13-4 The Print Preview of an analysis plot
The Print Preview dialog box lets you include, and set the size and location on the paper of the analysis plots, 3D plots, and Monte Carlo plots. You can even include the circuit schematic. The dialog box provides these buttons:
Print: This sends the image to the printer.
Setup: This invokes the Print Setup dialog box.
Tile: This arranges the selected plots in contiguous non-overlapping areas of the paper.
All: This selects all available plots for printing.
Close: This closes the Print Preview dialog box.
220 Chapter 13: Printing
Help: This accesses the Help system.
There is a list of available plots. Click on a plot to toggle its selection state. There are also three button options:
Auto Tile: |
This automatically tiles selected plots in the layout. If |
|
Auto Tile is off, each plot acquires a set of handles and |
|
may be moved and re-sized. |
This prints the selected background color. It's generally a |
|
Background: |
bad idea on ink jet printers because the large quantity of |
|
ink needed for the background saturates and warps the |
|
paper surface. |
Black Border: |
This adds a black border around each plot. |
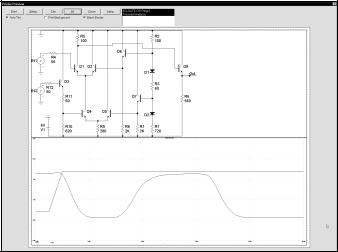
To illustrate, click on the All button. This adds the schematic to the analysis plot producing a display like this.
Figure 13-5 Adding the schematic to the analysis plot
Because Auto Tile is enabled the plots are tiled to fill the paper. Click on the Auto Tile button to disable it. The plots are redrawn showing handles. The handles are the little black rectangles. You can now move individual plots by dragging on the interior part of the plot and you can re-size individual plots by dragging on one of the handles.
221
To illustrate modifying the layout, grab the lower-right handle of the schematic and drag it up and to the left. Release the handle. Drag the upper-right handle of the analysis plot down and to the left. Release the handle. Drag the analysis plot from the interior so that it moves. Drag it up and drop it on the schematic so as to overlap the two. The display should now look like this:
Figure 13-6 Modifying the preview layout
In addition to printing in the usual way, you can create Windows metafiles of the various schematics and plots created by MC7. These metafiles can be imported into other programs such as Word, PageMaker, and Excel. They can also be placed in MC7 schematics.
To illustrate, exit the print routines by clicking on the Close button. From the Edit menu select Copy Entire Window to Picture File. When the dialog box comes up, click on OK. This save the analysis plot as a Windows MetaFile or WMF file using the name ECLGATE.WMF.
Quit transient analysis with F3. Select Options / Mode / Picture. This enters metafile placement mode. Click in the lower right of the schematic. In the dialog box, click on the Browse button and select the ECLGATE.WMF file.
The screen should now look like Figure 13-7.
222 Chapter 13: Printing
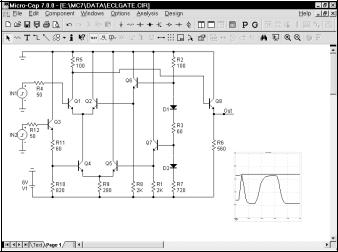
Figure 13-7 Adding a WMF of the analysis plot
This same WMF picture can be imported into Excel. From Excel, select Insert / Picture / From File. Enter the path and file name, or browse until you find it. The path and name will be something like:
C:\MC7\DATA\ECLGATE.WMF.
The picture should appear in Excel with handles for changing its size and shape.
223
224 Chapter 13: Printing