

Metodichka_writing
.pdfEx. 8. The pie charts show the average household expenditures in a country in 1990 and 2012. Look at the phrases in italics in the text below. Choose the phrase which sounds more formal.
Average Household Expenditures
The two pie charts give information about what households spent their money on / household expenditures on goods and services in 1990 and 2012. It is immediately obvious that there are some quite significant differences / some things are significantly different between the two charts.
In 2012 the largest proportion of expenditure was / most money was spent on food whereas in 1990 it was on housing, with food at just 11.2 %. There is a great difference in terms of the amount of money people spent on housing / housing expenditures between the two years. In 1990, 72.1 % of the total household budget / the total of what households spent went towards housing, compared to only 22 % in 2012.
There has been a notable increase in / People have notably increased the amount of money spent on transportation between the two dates. In addition, the charts show a significant rise in the proportion of money spent on health care / that people spent more on health care in 2012 compared to 1990.
There are some similarities, however. For example, in both 1990 and 2012 people spent a similar proportion on education. / the proportion of education expenditures was roughly the same.
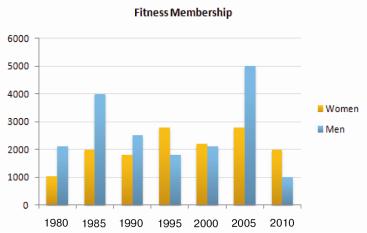
Ex. 9. The bar charts below show male and female fitness membership between 1980 and 2010. Fill in the gaps with the appropriate words from the box.
91
represents |
dipped |
fluctuations |
reached |
marked |
began lower |
indicates |
rates |
The chart shows male and female fitness membership over a thirty– year period. The vertical axis ……………… the number of members. The horizontal axis represents the period from 1980 to 2010.
Overall, the chart ……………. that there were greater
………………. in fitness membership among men than among women. The number of male members started the period at just over two thousand and ………………. highs of four thousand in 1985 and five thousand around 2005. The lowest …………….. were in 1995 and more recently in 2010 when the rate …………… as low as one thousand.
Female fitness membership ………………. at one thousand, doubled by 1985, and then fluctuated between two and three thousand for the remainder of the period. When male rates were at their lowest, female rates were higher. This was particularly true in 1995 when over three thousand women held fitness membership.
In brief, there were ………………. differences in rates of male and female fitness memberships in the period covered.
Ex. 10. Match the facts with the generalizations. Then rewrite these sentences using the Passive Voice using the following structure:
This is shown/demonstrated/illustrated by the fact...
92
|
FACTS |
|
GENERALISATIONS |
||
1. 75 % |
of |
working |
a. ____ This indicates that |
||
mothers who have full-time |
vegetarianism is becoming more |
||||
jobs buy ready-made meals. |
|
popular among the younger generation. |
|||
2. A |
significant |
number |
of |
b. ____ This shows that the older |
|
people in the UK have given up |
generation is taking more of an interest |
||||
smoking in the last three years. |
in health and fitness. |
||||
3. A significant number of |
c. ____ This shows that the older |
||||
people aged between 16 and |
generation is taking more of an interest |
||||
25 do not eat meat at all. |
|
in health and fitness. |
|||
4. A |
large |
number |
of |
d. ____ This shows that more |
|
young |
women have joined |
young people can now afford to take |
|||
judo, karate and self-defense |
holidays abroad. |
||||
classes in the last year. |
|
|
|||
5. A |
large |
proportion |
of |
e. ____ This illustrates that more |
|
men and women over the age |
people are concerned about the effects |
||||
of 60 are joining gyms and |
of smoking on their health. |
||||
health clubs. |
|
|
|
|
|
6. 30 % of |
all |
European |
f. ____ This demonstrates that |
||
holidays are booked by 18–30 |
young women are more aware of the |
||||
year-olds. |
|
|
|
need to be able to defend themselves in |
|
|
|
|
|
|
certain situations. |
Ex. 11. The tables below give information about the amount of beer and fruit juice consumed per person per year in different countries. Fill in the gaps with appropriate data.
|
Beer |
|
|
Fruit juice |
|
|
|
Country |
Amount* |
|
Country |
|
Amount* |
1 |
Ireland |
155 litres |
1 |
Canada |
|
52.6 litres |
2 |
Germany |
119 litres |
2 |
United States |
|
42.8 litres |
3 |
Austria |
106 litres |
3 |
Germany |
|
38.6 litres |
4 |
Belgium |
98 litres |
4 |
Austria |
|
37.3 litres |
5 |
Denmark |
98 litres |
5 |
Sweden |
|
35.5 litres |
6 |
United Kingdom |
97 litres |
6 |
Australia |
|
34.4 litres |
7 |
Australia |
89 litres |
7 |
Finland |
|
33 litres |
8 |
United States |
85 litres |
8 United Kingdom |
|
29.3 litres |
|
9 |
Netherlands |
80 litres |
9 |
Netherlands |
|
28.1 litres |
10 Finland |
79 litres |
10 New Zealand |
|
24.8 litres |
||
_________
*Litres per person per year.
93

The tables show the amount of beer and fruit juice consumed per person per year in countries around the world. Beer is most popular in Ireland, with
the average person in Ireland drinking ......... |
litres per year. Germany ranks |
|
second with ............... |
litres per person. In fact, the top six countries in terms |
|
of consumption of beer are all European. Australia and the United States come next in seventh and eighth positions, with the Netherlands and Finland consuming the least beer of the countries mentioned. Finnish people only drink an average of ................. litres of beer a year.
The country which consumes the greatest quantity of fruit juice per capita is Canada. Canadians drink an average of ................. litres each a year, and that’s almost double the consumption of New Zealand, which is placed at the bottom of the table. Another North American country, the United States, comes second in the table, while German drinkers are ranked at number three, consuming an average of ............... litres annually. Swedes drink approximately the same quantity of fruit juice as
Australians, which is |
.................. |
litres per year. The Finnish and the |
British drink ............... |
and .............. |
litres per year respectively. |
Ex. 12. The chart shows the division of household tasks by gender in Great Britain.
Source: Office for National Statistics on behalf of the Controller of Her Majesty's Stationery Office.
94
(a)Study the sentences below and then write three similar sentences about other parts of the chart.
1. Women spend over twice as much time doing kitchen tasks as men. 2. Men spend 30 minutes a day doing kitchen tasks whereas / while
women spend 74 minutes a day.
3. Women are more active in the kitchen than men (74 minutes a day for women as opposed to 30 minutes for men).
(b)Look at the following sample answer to the writing task. Write a word in each space.
The chart shows the average number of minutes per day men and
women in Great Britain spend on jobs around the house.
In total, men spend just |
.................... two-and-a-half hours on |
|
household tasks whereas women spend slightly |
.................... than four |
|
hours. Women spend more than .................... |
as much time doing kitchen |
|
tasks such as cooking and washing ....................up |
men (74 minutes for |
|
women as opposed .................... |
30 minutes for men). Women are also |
|
more active in cleaning the house (it takes 58 minutes of their day
compared .................... |
13 minutes for men) and in childcare (women put |
|
in more than twice as .................... |
|
time as men). |
On the other hand, men are .................... |
active in gardening and pet |
|
care, where they spend twice as |
.................... time as women, and in |
|
maintenance and DIY, on which they spend 15 minutes more .................... |
||
women. Women account for almost all the combined time spent on washing and ironing clothes. This takes them 25 minutes, ....................
men spend just 2 minutes on this task.
Overall, the figures show that women spend more time on routine domestic chores than men, .................... men do more household maintenance, gardening and pet care.
Ex. 13. Fill in the blank with an appropriate preposition.
1. As shown ... the data ... table 1, the lightweight materials outperformed traditional metals.
2. In February, sales increased ... $ 50,000. The following month, there was a further increase ... $ 20,000. In April, they remained constant ...
$ 70,000.
3. Sea levels are estimated to be rising ... a rate ... 1.8 mm per year. 4. The pass rate fluctuated ... 2010 ... 2012.
5. The graph shows the average rates of pay ... workers ... four key industries.
6. As can be seen ... the data, the defect rate has declined.
95
7.The rate rose dramatically ... September 2012 ... February 2013.
8.The drop-out rate reached a peak ... 17 % in 2011.
9.As revealed ... the graph line, earnings have decreased.
10.The percentage fluctuated ... 5 % ... 5.5 %.
11.The chart shows rates ... pay ... urban and rural areas.
Ex. 14. Choose an appropriate verb.
1.The results indicate/establish that there is a link between the data compared.
2.The table suggests/shows that scientists may need further research.
3.The results given in Table 1 validate/support the hypothesis.
4.Changes in temperature may have influenced/distorted the results.
5.The test results create/suggest a basis for product modification.
6.In their earlier work, they failed/neglected to take into account that reason.
7.As can be seen from Table 2, the new tax laws have encouraged/stimulated industrial investment.
8.The data depict/clarify the genetic relationship.
96
Reference List
В.С. Слепович, О.И. Вашкевич, Г.К. Мась. Пособие по английскому академическому письму и говорению. – Минск: ТетраСистемс, 2012. – 176 с.
A Course in Written English/ В.М. Салье, Э.И. Мячинская,
Л.П. Цурикова и др. – СПб.: Академия, 2006. – 240 с.
Bailey S. Academic Writing. A Handbook for International Students. Routledge Taylor & Francis Group, 2006. – 260 p.
Chin P., Reid S., Wray S., Yamazaki Y. Academic Writing Skills 1. CUP, 2012. – 122 p.
Chin P., Reid S., Wray S., Yamazaki Y. Academic Writing Skills 2. CUP, 2012. – 131 p.
Coe N., Rycroft R. Writing Skills: A Problem-Solving Approach. CUP, 2006. – 95 p.
Hogue A. The Essentials of English: A Writer’s Handbook. Pearson Education, 2003. – 450 p.
Jordan R. Academic Writing Course. Pearson Education Limited, 2012. – 160 p.
Pallant A. English for Academic Study: Writing. Garnet Education, 2012. – 93 p.
http://academicwriting.wikidot.com http://www.ielts-exam.net http://www.uefap.com/indEx. htm
97

|
|
|
|
|
|
|
|
|
|
|
|
APPENDIX I |
|
|
|
|
|
GRAMMAR REFERENCE |
|
|
|
||||
|
Study the forms of the verb in the Active Voice |
|||||||||||
|
Tense |
|
|
|
Present |
|
Past |
|
|
Future |
||
|
Simple |
|
|
|
walk/walks |
|
walked |
|
|
will walk |
||
|
|
|
|
|
do/does |
|
did |
|
|
|
||
|
Progressive |
|
am/is/are walking |
was/were walking |
|
will be walking |
||||||
|
Perfect |
|
have/has walked |
had walked |
|
|
will have |
|||||
|
|
|
|
|
|
|
|
|
|
|
|
walked |
|
Perfect |
|
|
have/has been |
had been walking |
|
will have been |
|||||
|
Progresive |
|
|
|
walking |
|
|
|
|
|
walking |
|
|
Study the forms of the verb in the Passive Voice |
|||||||||||
|
Tense |
|
|
Present |
|
|
Past |
|
|
Future |
||
|
Simple |
|
am/is/are done |
|
was/were done |
|
|
will be done |
||||
|
Progressive |
am/is/are being |
was/were being done |
___ |
||||||||
|
|
|
|
|
done |
|
|
|
|
|
|
|
|
Perfect |
have/has been done |
|
had been done |
|
|
will have been |
|||||
|
|
|
|
|
|
|
|
|
|
|
|
done |
|
|
|
|
|
Study the forms of the Infinitive |
|
||||||
|
|
|
|
|
Active |
|
|
|
Passive |
|||
|
Indefinite |
|
|
|
to develop |
|
|
to be developed |
||||
|
|
|
|
|
|
|
|
|
|
|||
|
Continuous |
|
|
|
to be developing |
|
|
|
––––––– |
|||
|
Perfect |
|
|
|
to have developed |
|
to have been developed |
|||||
|
Perfect |
|
to have been developing |
|
|
––––––– |
||||||
|
Continuous |
|
|
|
|
|
|
|
|
|
|
|
|
Study the forms of Participle I and Participle II |
|||||||||||
|
|
|
Participle I (V–ing) |
|
|
|
Participle II |
|||||
|
|
|
|
|
|
|
|
|
(V-ed; V3 irregular) |
|||
|
Indefinite Active |
|
affecting |
|
|
|
|
|||||
|
|
|
|
|
|
|
|
|||||
|
Indefinite Passive |
|
being affected |
|
|
|
affected |
|||||
|
|
|
|
|
|
|
|
|
|
|
|
|
|
|
|
|
|
|
|
|
|
||||
|
Perfect Active |
|
|
having affected |
|
|
|
|
||||
|
Perfect Passive |
|
|
having been affected |
|
|
|
|
||||
|
|
|
|
|
|
|
|
|
|
|
|
|
98
Study the forms of the Gerund
|
|
Active |
Passive |
Indefinite |
|
translating |
being translated |
|
|
|
|
Perfect |
|
having translated |
having been |
|
|
|
translated |
|
COMMON USE OF PREPOSITIONS |
||
AFTER VERBS
account for |
count on |
limit oneself to |
rely on |
|
|
|
|
accuse smn of |
credit smn with |
look forward to |
reprimand smn for |
|
|
|
|
adapt oneself to |
criticize smn for |
lower oneself to |
reproach smn for/with |
|
|
|
|
admire smn for |
dedicate oneself to |
mislead smn into |
rescue smn from |
|
|
|
|
adjust oneself to |
deduce smth from |
object to |
resign oneself to |
|
|
|
|
agree with |
delay in |
participate in |
restrain smn from |
|
|
|
|
answer for |
delight in |
pay for |
restrict oneself to |
|
|
|
|
apologize for |
depend on |
persist in |
reward smn for |
|
|
|
|
apply oneself to |
deprive smn of |
persuade smn of |
save smn from |
|
|
|
|
blame smn for |
descend to |
praise smn for |
scold smn for |
boast of |
despair of |
preserve in |
shrink from |
|
|
|
|
bother about |
disapprove of |
prevent smn from |
speak about/of |
|
|
|
|
benefit from |
discourage smn |
prohibit smn from |
specialize in |
|
from |
|
|
calculate on |
dissuade smn from |
prosecute smn for |
stand for |
|
|
|
|
certify to |
draw back from |
protect smn from |
submit to |
|
|
|
|
compensate for |
dream of |
punish smn for |
succeed in |
|
|
|
|
complain of/about |
embark on |
react to/against |
suffer from |
|
|
|
|
concentrate on |
expose oneself to |
rebel against |
suspect smn of |
confess to |
flinch from |
rebuke smn for |
talk about/of |
congratulate smn |
force smn into/to |
reckon on |
thank smn for |
on |
|
|
|
consist of |
frown at |
reconcile oneself to |
think about/of |
content oneself |
insist on |
refer to |
threaten smn with |
with |
|
|
|
contribute to |
interfere with |
refrain from |
warn smn against |
cooperate in |
laugh at |
rejoice at |
work at |
99

AFTER ADJECTIVES AND ADJECTIVIZED
PARTICIPLES
absorbed in |
|
dismayed at |
intent on |
prompt in |
|
||
|
|
|
|
|
|
|
|
accustomed to |
|
(in)efficient in/at |
interested in |
puzzled at/about |
|
||
|
|
|
|
|
|
|
|
addicted to |
|
engaged in |
involved in |
quick in |
|
||
|
|
|
|
|
|
|
|
amazed at |
|
entrusted with |
keen on |
renowned for |
|
||
angry at/about |
|
excited about/over |
(well-)known for |
responsible for |
|
||
|
|
|
|
|
|
|
|
annoyed |
|
(in)experienced in |
lazy about/in |
satisfied with |
|
||
at/about |
|
|
|
|
|
|
|
anxious about |
|
expert at |
long in |
serious about/in |
|
||
|
|
|
|
|
|
|
|
astonished at |
|
famous for |
miserable at/about |
sorry for/about |
|
||
|
|
|
|
|
|
(past) |
|
attached to |
|
flabbergasted at |
mistaken in |
skillful at |
|
||
|
|
|
|
|
|
|
|
bored with |
|
frightened at/of |
modest about |
smart at |
|
||
|
|
|
|
|
|
|
|
charged with |
|
frustrated in |
notorious for |
stubborn in |
|
||
close to |
|
furious at/about |
obstinate in |
stupid at |
|
||
|
|
|
|
|
|
|
|
committed to |
|
good at |
offended |
thrilled at/about/by |
|
||
|
|
|
|
at/with/by |
|
|
|
conducive to |
|
impervious to |
opposed to |
upset about/at/by |
|
||
correct in |
|
implicated in |
optimistic |
useful in |
|
||
|
|
|
|
in/about |
|
|
|
dense at |
|
impressed at/by |
pleased |
vexed at/about |
|
||
|
|
|
|
at/with/by |
|
|
|
diligent in/about |
|
inclined to |
preoccupied with |
worried about |
|
||
|
|
|
AFTER NOUNS |
|
|
||
|
|
|
|
|
|
|
|
act of |
|
drawback of |
|
notion of |
responsibility of |
||
advantage of |
|
excuse for |
|
pain of |
risk of |
||
allusion to |
|
feeling at |
|
pleasure of |
skill in/at |
||
answer to |
|
fun of |
|
point of |
system of |
||
anxiety of |
|
hope of |
|
possibility of |
talent for |
||
chance of |
|
idea of |
|
probability of |
task of |
||
choice of |
|
impression of |
|
problem of |
thought of |
||
danger of |
|
job of |
|
prospect of |
temptation of |
||
difficulty of |
|
opportunity of |
|
reason for |
weakness for |
||
disadvantage of |
|
object of |
|
reference to |
worry of |
||
100