

Книги фарма 2 / Bertram G. Katzung-Basic & Clinical Pharmacology(9th Edition)
.pdf
|
Ampicillin |
62 |
|
82 |
|
18 |
|
16.2 |
|
20 |
|
1.3 |
|
. . . |
|
. . . |
|
|
|||||||||
|
|
|
|
|
|
|
|
|
|
|
|
|
|
|
|
|
|
|
|
|
|
|
|
|
|
|
|
|
Aspirin |
|
|
68 |
|
|
1 |
|
|
49 |
|
|
39 |
|
|
11 |
|
|
0.25 |
|
|
. . . |
|
|
. . . |
|
|
|
|
|
|
|
|
|
|
|
|
|
|
|
|
|
|
|
|
|
|
|
|
|
|
|
|
|
|
|
Atenolol |
|
|
56 |
|
|
94 |
|
|
5 |
|
|
10.2 |
|
|
67 |
|
|
6.1 |
|
|
1 mg/L |
|
|
. . . |
|
|
|
Atropine |
|
|
50 |
|
|
57 |
|
|
18 |
|
|
24.6 |
|
|
120 |
|
|
4.3 |
|
|
. . . |
|
|
. . . |
|
|
|
|
|
|
|
|
|
|
|
|
|
|
|
|
|
|
|
|
|
|||||||||
|
|
|
|
|
|
|
|
|
|
|
|
|
|
|
|
|
|
|
|
|
|
|
|
|
|
|
|
|
Captopril |
|
|
65 |
|
|
38 |
|
|
30 |
|
|
50.4 |
|
|
57 |
|
|
2.2 |
|
|
50 ng/mL |
|
|
. . . |
|
|
|
|
|
|
|
|
|
|
|
|
|
|
|
|
|
|
|
|
|
|
|
|
|
|
|
|
|
|
|
Carbamazepi |
|
|
70 |
|
|
1 |
|
|
74 |
|
|
5.34 |
|
|
98 |
|
|
15 |
|
|
6 mg/L |
|
|
>9 mg/L |
|
|
|
ne |
|
|
|
|
|
|
|
|
|
|
|
|
|
|
|
|
|
|
|
|
|
|
|
|
|
|
|
Cephalexin |
|
|
90 |
|
|
91 |
|
|
14 |
|
|
18 |
|
|
18 |
|
|
0.9 |
|
|
. . . |
|
|
. . . |
|
|
|
|
|
|
|
|
|
|
|
|
|
|
|
|
|
|
|
|
|
|
|
|
|
|
|
|
|
|
|
Cephalothin |
|
|
. . . |
|
|
52 |
|
|
71 |
|
|
28.2 |
|
|
18 |
|
|
0.57 |
|
|
. . . |
|
|
. . . |
|
|
|
Chloramphen |
|
|
80 |
|
|
25 |
|
|
53 |
|
|
10.2 |
|
|
66 |
|
|
2.7 |
|
|
. . . |
|
|
. . . |
|
|
|
icol |
|
|
|
|
|
|
|
|
|
|
|
|
|
|
|
|
|
|
|
|
|
|
|
|
|
|
|
Chlordiazepo |
|
|
100 |
|
|
1 |
|
|
97 |
|
|
2.28 |
|
|
21 |
|
|
10 |
|
|
1 mg/L |
|
|
. . . |
|
|
|
xide |
|
|
|
|
|
|
|
|
|
|
|
|
|
|
|
|
|
|
|
|
|
|
|
|
|
|
|
Chloroquine |
|
|
89 |
|
|
61 |
|
|
61 |
|
|
45 |
|
|
13000 |
|
|
214 |
|
|
20 ng/mL |
|
|
250 ng/mL |
|
|
|
Chlorpropam |
|
|
90 |
|
|
20 |
|
|
96 |
|
|
0.126 |
|
|
6.8 |
|
|
33 |
|
|
. . . |
|
|
. . . |
|
|
|
ide |
|
|
|
|
|
|
|
|
|
|
|
|
|
|
|
|
|
|
|
|
|
|
|
|
|
|
|
Cimetidine |
|
|
62 |
|
|
62 |
|
|
19 |
|
|
32.4 |
|
|
70 |
|
|
1.9 |
|
|
0.8 mg/L |
|
|
. . . |
|
|
|
Ciprofloxaci |
|
|
60 |
|
|
65 |
|
|
40 |
|
|
25.2 |
|
|
130 |
|
|
4.1 |
|
|
. . . |
|
|
. . . |
|
|
|
n |
|
|
|
|
|
|
|
|
|
|
|
|
|
|
|
|
|
|
|
|
|
|
|
|
|
|
|
Clonidine |
|
|
95 |
|
|
62 |
|
|
20 |
|
|
12.6 |
|
|
150 |
|
|
12 |
|
|
1 ng/mL |
|
|
. . . |
|
|
|
Cyclosporine |
|
|
23 |
|
|
1 |
|
|
93 |
|
|
24.6 |
|
|
85 |
|
|
5.6 |
|
|
200 ng/mL |
|
|
>400 ng/mL |
|
|
|
|
|
|
|
|
|
|
|
|
|
|
|
|
|
|
|
|
|
|
|
|
|
|
|
|
|
|
|
Diazepam |
|
|
100 |
|
|
1 |
|
|
99 |
|
|
1.62 |
|
|
77 |
|
|
43 |
|
|
300 ng/mL |
|
|
. . . |
|
|
|
|
|
|
|
|
|
|
|
|
|
|
|
|
|
|
|
|
|
|
|
|
|
|
|
|
|
|
|
Digitoxin |
|
|
90 |
|
|
32 |
|
|
97 |
|
|
0.234 |
|
|
38 |
|
|
161 |
|
|
10 ng/mL |
|
|
>35 ng/mL |
|
|
|
Digoxin |
|
|
70 |
|
|
60 |
|
|
25 |
|
|
7 |
|
|
500 |
|
|
50 |
|
|
1 ng/mL |
|
|
>2 ng/mL |
|
|
|
|
|
|
|
|
|
|
|
|
|
|
|
|
|
|
|
|
|
|
|
|
|
|
|
|
|
|
|
Diltiazem |
|
|
44 |
|
|
4 |
|
|
78 |
|
|
50.4 |
|
|
220 |
|
|
3.7 |
|
|
. . . |
|
|
. . . |
|
|
|
|
|
|
|
|
|
|
|
|
|
|
|
|
|
|
|
|
|
|
|
|
|
|
|
|
|
|
|
Disopyramid |
|
|
83 |
|
|
55 |
|
|
2 |
|
|
5.04 |
|
|
41 |
|
|
6 |
|
|
3 mg/L |
|
|
>8 mg/L |
|
|
|
|
|
|
|
|
|
|
|
|
|
|
|
|
|
|
|
|
|
|
||||||||
|
e |
|
|
|
|
|
|
|
|
|
|
|
|
|
|
|
|
|
|
|
|
|
|
|
|
|
|
|
Enalapril |
|
|
95 |
|
|
90 |
|
|
55 |
|
|
9 |
|
|
40 |
|
|
3 |
|
|
> 0.5 ng/mL |
|
|
. . . |
|
|
|
|
|
|
|
|
|
|
|
|
|
|
|
|
|
|
|
|
|
|
|
|
|
|
|
|
|
|
|
Erythromyci |
|
|
35 |
|
|
12 |
|
|
84 |
|
|
38.4 |
|
|
55 |
|
|
1.6 |
|
|
. . . |
|
|
. . . |
|
|
|
n |
|
|
|
|
|
|
|
|
|
|
|
|
|
|
|
|
|
|
|
|
|
|
|
|
|
|
|
Ethambutol |
|
|
77 |
|
|
79 |
|
|
5 |
|
|
36 |
|
|
110 |
|
|
3.1 |
|
|
. . . |
|
|
>10 mg/L |
|
|
|
|
|
|
|
|
|
|
|
|
|
|
|
|
|
|
|
|
|
|
|
|
|
|
|
|
|
|
|
Fluoxetine |
|
|
60 |
|
|
3 |
|
|
94 |
|
|
40.2 |
|
|
2500 |
|
|
53 |
|
|
. . . |
|
|
. . . |
|
|
|
|
|
|
|
|
|
|
|
|
|
|
|
|
|
|
|
|
|
|||||||||
|
Furosemide |
|
|
61 |
|
|
66 |
|
|
99 |
|
|
8.4 |
|
|
7.7 |
|
|
1.5 |
|
|
. . . |
|
|
>25 mg/L |
|
|
|
|
|
|
|
|
|
|
|
|
|
|
|
|
|
|
|
|
|
|
|
|
|
|
|
|
|
|
|
Gentamicin |
|
|
. . . |
|
|
90 |
|
|
10 |
|
|
5.4 |
|
|
18 |
|
|
2.5 |
|
|
. . . |
|
|
. . . |
|
|
|
|
|
|
|
|
|
|
|
|
|
|
|
|
|
|
|
|
|
|
|
|
|
|
|
|
|
|
|
Hydralazine |
|
|
40 |
|
|
10 |
|
|
87 |
|
|
234 |
|
|
105 |
|
|
1 |
|
|
100 ng/mL |
|
|
. . . |
|
|
|
|
|
|
|
|
|
|
|
|
|
|
|
|
|
|
|
|
|
|||||||||
|
Imipramine |
|
|
40 |
|
|
2 |
|
|
90 |
|
|
63 |
|
|
1600 |
|
|
18 |
|
|
200 ng/mL |
|
|
>1 mg/L |
|
|
|
|
|
|
|
|
|
|
|
|
|
|
|
|
|
|
|
|
|
|
|
|
|
|
|
|
|
|
|
Indomethacin |
|
|
98 |
|
|
15 |
|
|
90 |
|
|
8.4 |
|
|
18 |
|
|
2.4 |
|
|
1 mg/L |
|
|
>5 mg/L |
|
|
|
|
|
|
|
|
|
|
|
|
|
|
|
|
|
|
|
|
|
|
|
|
|
|
|
|
|
|
|
Labetalol |
|
|
18 |
|
|
5 |
|
|
50 |
|
|
105 |
|
|
660 |
|
|
4.9 |
|
|
0.1 mg/L |
|
|
. . . |
|
|
|
Lidocaine |
|
|
35 |
|
|
2 |
|
|
70 |
|
|
38.4 |
|
|
77 |
|
|
1.8 |
|
|
3 mg/L |
|
|
>6 mg/L |
|
|
|
|
|
|
|
|
|
|
|
|
|
|
|
|
|
|
|
|
|
|
|
|
|
|
|
|
|
|

|
Lithium |
100 |
|
95 |
|
0 |
|
1.5 |
|
55 |
|
22 |
|
|
0.7 mEq/L |
|
>2 mEq/L |
|
||||||||||
|
|
|
|
|
|
|
|
|
|
|
|
|
|
|
|
|
|
|
|
|
|
|
|
|
|
|
|
|
|
Meperidine |
|
|
52 |
|
|
12 |
|
|
58 |
|
|
72 |
|
|
310 |
|
|
3.2 |
|
|
0.5 mg/L |
|
|
. . . |
|
|
|
|
|
|
|
|
|
|
|
|
|
|
|
|
|
|
|
|
|
|
|
|
|
|
|
|
|
|
|
|
|
Methotrexate |
|
|
70 |
|
|
48 |
|
|
34 |
|
|
9 |
|
|
39 |
|
|
7.2 |
|
|
750 M-h3 |
|
|
>950 M-h |
|
|
|
|
|
|
|
|
|
|
|
|
|
|
|
|
|
|
|
|
|
|
|
|
|
|
|
|
|
|
|
|
|
Metoprolol |
|
|
38 |
|
|
10 |
|
|
11 |
|
|
63 |
|
|
290 |
|
|
3.2 |
|
|
25 ng/mL |
|
|
. . . |
|
|
|
|
|
|
|
|
|
|
|
|
|
|
|
|
|
|
|
|
|
|
|
|
|
|
|
|
|
|
|
|
|
Metronidazol |
|
|
99 |
|
|
10 |
|
|
10 |
|
|
5.4 |
|
|
52 |
|
|
8.5 |
|
|
4 mg/L |
|
|
. . . |
|
|
|
|
e |
|
|
|
|
|
|
|
|
|
|
|
|
|
|
|
|
|
|
|
|
|
|
|
|
|
|
|
|
Midazolam |
|
|
44 |
|
|
56 |
|
|
95 |
|
|
27.6 |
|
|
77 |
|
|
1.9 |
|
|
. . . |
|
|
. . . |
|
|
|
|
Morphine |
|
|
24 |
|
|
8 |
|
|
35 |
|
|
60 |
|
|
230 |
|
|
1.9 |
|
|
60 ng/mL |
|
|
. . . |
|
|
|
|
Nifedipine |
|
|
50 |
|
|
0 |
|
|
96 |
|
|
29.4 |
|
|
55 |
|
|
1.8 |
|
|
50 ng/mL |
|
|
. . . |
|
|
|
|
|
|
|
|
|
|
|
|
|
|
|
|
|
|
|
|
|
|
|
|
|
|
|
|
|
|
|
|
|
Nortriptyline |
|
|
51 |
|
|
2 |
|
|
92 |
|
|
30 |
|
|
1300 |
|
|
31 |
|
|
100 ng/mL |
|
|
>500 ng/mL |
|
|
|
|
Phenobarbita |
|
|
100 |
|
|
24 |
|
|
51 |
|
|
0.258 |
|
|
38 |
|
|
98 |
|
|
15 mg/L |
|
|
>30 mg/L |
|
|
|
|
l |
|
|
|
|
|
|
|
|
|
|
|
|
|
|
|
|
|
|
|
|
|
|
|
|
|
|
|
|
Phenytoin |
|
|
90 |
|
|
2 |
|
|
89 |
|
|
Conc- |
|
|
45 |
|
|
Conc- |
|
|
10 mg/L |
|
|
>20 mg/L |
|
|
|
|
|
|
|
|
|
|
|
|
|
|
|
|
depende |
|
|
|
|
|
depende |
|
|
|
|
|
|
|
|
|
|
|
|
|
|
|
|
|
|
|
|
|
|
nt4 |
|
|
|
|
|
nt5 |
|
|
|
|
|
|
|
|
|
|
|
|
|
|
|
|
|
|
|
|
|
|
|
|
|
|
|
|
|
|
|
|
|
|
|
|
|
|
|
Prazosin |
|
|
68 |
|
|
1 |
|
|
95 |
|
|
12.6 |
|
|
42 |
|
|
2.9 |
|
|
. . . |
|
|
. . . |
|
|
|
|
|
|
|
|
|
|
|
|
|
|
|
|
|
|
|
|
|
|
|
|
|
|
|
|
|
|
|
|
|
Procainamide |
|
|
83 |
|
|
67 |
|
|
16 |
|
|
36 |
|
|
130 |
|
|
3 |
|
|
5 mg/L |
|
|
>14 mg/L |
|
|
|
|
|
|
|
|
|
|
|
|
|
|
|
|
|
|
|
|
|
|
|
|
|
|
|
|
|
|
|
|
|
Propranolol |
|
|
26 |
|
|
1 |
|
|
87 |
|
|
50.4 |
|
|
270 |
|
|
3.9 |
|
|
20 ng/mL |
|
|
. . . |
|
|
|
|
Pyridostigmi |
|
|
14 |
|
|
85 |
|
|
. . . |
|
|
36 |
|
|
77 |
|
|
1.9 |
|
|
75 ng/mL |
|
|
. . . |
|
|
|
|
ne |
|
|
|
|
|
|
|
|
|
|
|
|
|
|
|
|
|
|
|
|
|
|
|
|
|
|
|
|
Quinidine |
|
|
80 |
|
|
18 |
|
|
87 |
|
|
19.8 |
|
|
190 |
|
|
6.2 |
|
|
3 mg/L |
|
|
>8 mg/L |
|
|
|
|
Ranitidine |
|
|
52 |
|
|
69 |
|
|
15 |
|
|
43.8 |
|
|
91 |
|
|
2.1 |
|
|
100 ng/mL |
|
|
. . . |
|
|
|
|
|
|
|
|
|
|
|
|
|
|
|
|
|
|
|
|
|
|
|
|
|
|
|
|
|
|
|
|
|
Rifampin |
|
|
? |
|
|
7 |
|
|
89 |
|
|
14.4 |
|
|
68 |
|
|
3.5 |
|
|
. . . |
|
|
. . . |
|
|
|
|
|
|
|
|
|
|
|
|
|
|
|
|
|
|
|
|
|
|
|
|
|
|
|
|
|
|
|
|
|
Salicylic acid |
|
|
100 |
|
|
15 |
|
|
85 |
|
|
0.84 |
|
|
12 |
|
|
13 |
|
|
200 mg/L |
|
|
>200 mg/L |
|
|
|
|
Sulfamethox |
|
|
100 |
|
|
14 |
|
|
62 |
|
|
1.32 |
|
|
15 |
|
|
10 |
|
|
. . . |
|
|
. . . |
|
|
|
|
azole |
|
|
|
|
|
|
|
|
|
|
|
|
|
|
|
|
|
|
|
|
|
|
|
|
|
|
|
|
Terbutaline |
|
|
14 |
|
|
56 |
|
|
20 |
|
|
14.4 |
|
|
125 |
|
|
14 |
|
|
2 ng/mL |
|
|
. . . |
|
|
|
|
Tetracycline |
|
|
77 |
|
|
58 |
|
|
65 |
|
|
7.2 |
|
|
105 |
|
|
11 |
|
|
. . . |
|
|
. . . |
|
|
|
|
|
|
|
|
|
|
|
|
|
|
|
|
|
|
|
|
|
|
|
|
|
|
|
|
|
|
|
|
|
Theophylline |
|
|
96 |
|
|
18 |
|
|
56 |
|
|
2.8 |
|
|
35 |
|
|
8.1 |
|
|
10 mg/L |
|
|
>20 mg/L |
|
|
|
|
Tobramycin |
|
|
. . . |
|
|
90 |
|
|
10 |
|
|
4.62 |
|
|
18 |
|
|
2.2 |
|
|
. . . |
|
|
. . . |
|
|
|
|
Tocainide |
|
|
89 |
|
|
38 |
|
|
10 |
|
|
10.8 |
|
|
210 |
|
|
14 |
|
|
10 mg/L |
|
|
. . . |
|
|
|
|
|
|
|
|
|
|
|
|
|
|
|
|
|
|
|
|
|
|
|
|
|
|
|
|
|
|
|
|
|
Tolbutamide |
|
|
93 |
|
|
0 |
|
|
96 |
|
|
1.02 |
|
|
7 |
|
|
5.9 |
|
|
100 mg/L |
|
|
. . . |
|
|
|
|
Trimethopri |
|
|
100 |
|
|
69 |
|
|
44 |
|
|
9 |
|
|
130 |
|
|
11 |
|
|
. . . |
|
|
. . . |
|
|
|
|
m |
|
|
|
|
|
|
|
|
|
|
|
|
|
|
|
|
|
|
|
|
|
|
|
|
|
|
|
|
Tubocurarine |
|
|
. . . |
|
|
63 |
|
|
50 |
|
|
8.1 |
|
|
27 |
|
|
2 |
|
|
0.6 mg/L |
|
|
. . . |
|
|
|
|
Valproic acid |
|
|
100 |
|
|
2 |
|
|
93 |
|
|
0.462 |
|
|
9.1 |
|
|
14 |
|
|
75 mg/L |
|
|
>150 mg/L |
|
|
|
|
|
|
|
|
|
|
|
|
|
|
|
|
|
|
|
|
|
|
|
|
|
|
|
|
|
|
|
|
|
Vancomycin |
|
|
. . . |
|
|
79 |
|
|
30 |
|
|
5.88 |
|
|
27 |
|
|
5.6 |
|
|
. . . |
|
|
. . . |
|
|
|
|
|
|
|
|
|
|
|
|
|
|
|
|
|
|
|
|
|
|
|
|
|
|
|
|
|
|
|
|
|
Verapamil |
|
|
22 |
|
|
3 |
|
|
90 |
|
|
63 |
|
|
350 |
|
|
4 |
|
|
. . . |
|
|
. . . |
|
|
|

Warfarin |
93 |
3 |
99 |
0.192 |
9.8 |
37 |
. . . |
. . . |
|
|
|
|
|
|
|
|
|
|
|
Zidovudine |
63 |
18 |
25 |
61.8 |
98 |
1.1 |
. . . |
. . . |
|
|
|
|
|
|
|
|
|
|
|
1Convert to mL/min by multiplying the number given by 16.6.
2Varies with concentration.
3Target area under the concentration time curve after a single dose.
4Can be estimated from measured Cp using CL = Vmax/(Km + Cp); Vmax = 415 mg/d, Km = 5 mg/L. See text.
5Varies because of concentration-dependent clearance.
Knowing the relationship between dose, drug concentration and effects allows the clinician to take into account the various pathologic and physiologic features of a particular patient that make him or her different from the average individual in responding to a drug. The importance of pharmacokinetics and pharmacodynamics in patient care thus rests upon the improvement in therapeutic benefit and reduction in toxicity that can be achieved by application of these principles.
Pharmacokinetics
The "standard" dose of a drug is based on trials in healthy volunteers and patients with average ability to absorb, distribute, and eliminate the drug (see Clinical Trials: The IND and NDA in Chapter 5: Basic & Clinical Evaluation of New Drugs). This dose will not be suitable for every patient. Several physiologic processes (eg, maturation of organ function in infants) and pathologic processes (eg, heart failure, renal failure) dictate dosage adjustment in individual patients. These processes modify specific pharmacokinetic parameters. The two basic parameters are clearance, the measure of the ability of the body to eliminate the drug; and volume of distribution, the measure of the apparent space in the body available to contain the drug. These parameters are illustrated schematically in Figure 3–2, where the volume of the compartments into which the drugs diffuse represents the volume of distribution and the size of the outflow "drain" in Figures 3–2 B and D represents the clearance.
Figure 3–2.


Models of drug distribution and elimination. The effect of adding drug to the blood by rapid intravenous injection is represented by expelling a known amount of the agent into a beaker. The time course of the amount of drug in the beaker is shown in the graphs at the right. In the first example (A), there is no movement of drug out of the beaker, so the graph shows only a steep rise to maximum followed by a plateau. In the second example (B), a route of elimination is present, and the graph shows a slow decay after a sharp rise to a maximum. Because the level of material in the beaker falls, the "pressure" driving the elimination process also falls, and the slope of the curve decreases. This is an exponential decay curve. In the third model (C), drug placed in the first compartment ("blood") equilibrates rapidly with the second compartment ("extravascular volume") and the amount of drug in "blood" declines exponentially to a new steady state. The fourth model (D) illustrates a more realistic combination of elimination mechanism and extravascular equilibration. The resulting graph shows an early distribution phase followed by the slower elimination phase.
Volume of Distribution
Volume of distribution (Vd) relates the amount of drug in the body to the concentration of drug (C) in blood or plasma:
The volume of distribution may be defined with respect to blood, plasma, or water (unbound drug), depending on the concentration used in equation (1) (C = Cb, Cp, or Cu).
That the Vd calculated from equation (1) is an apparent volume may be appreciated by comparing the volumes of distribution of drugs such as digoxin or chloroquine (Table 3–1) with some of the physical volumes of the body (Table 3–2). Volume of distribution can vastly exceed any physical volume in the body because it is the volume apparently necessary to contain the amount of drug homogeneously at the concentration found in the blood, plasma, or water. Drugs with very high volumes of distribution have much higher concentrations in extravascular tissue than in the vascular compartment, ie, they are not homogeneously distributed. Drugs that are completely retained within the vascular compartment, on the other hand, have a minimum possible volume of distribution equal to the blood component in which they are distributed, eg, 0.04 L/kg body weight or 2.8 L/70 kg (Table 3–2) for a drug that is restricted to the plasma compartment.
Table 3–2. Physical Volumes (in L/Kg Body Weight) of Some Body Compartments into Which Drugs May Be Distributed.
Compartment and Volume |
Examples of Drugs |
|
|
Water |
|
|
|
Total body water (0.6 L/kg1) |
Small water-soluble molecules: eg, ethanol. |
|
|
|
|
Extracellular water (0.2 L/kg) |
Larger water-soluble molecules: eg, gentamicin. |
|
|
Blood (0.08 L/kg); plasma (0.04 |
Strongly plasma protein-bound molecules and very large |
L/kg) |
molecules: eg, heparin. |
|
|
Fat (0.2–0.35 L/kg) |
Highly lipid-soluble molecules: eg, DDT. |
|
|
Bone (0.07 L/kg) |
Certain ions: eg, lead, fluoride. |
|
|
1An average figure. Total body water in a young lean man might be 0.7 L/kg; in an obese woman, 0.5 L/kg.
Clearance
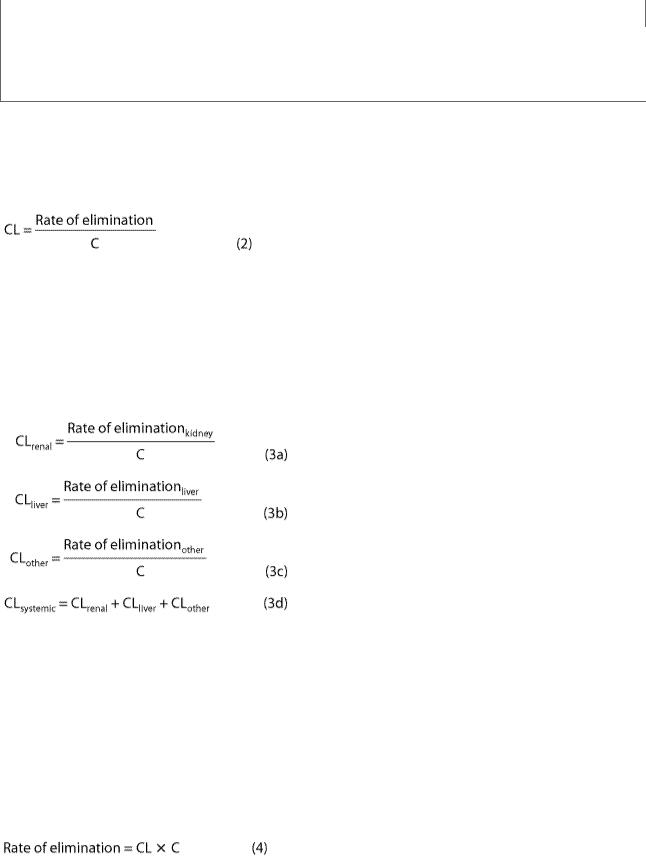
Drug clearance principles are similar to the clearance concepts of renal physiology. Clearance of a drug is the factor that predicts the rate of elimination in relation to the drug concentration:
Clearance, like volume of distribution, may be defined with respect to blood (CLb), plasma (CLp), or unbound in water (CLu), depending on the concentration measured.
It is important to note the additive character of clearance. Elimination of drug from the body may involve processes occurring in the kidney, the lung, the liver, and other organs. Dividing the rate of elimination at each organ by the concentration of drug presented to it yields the respective clearance at that organ. Added together, these separate clearances equal total systemic clearance:
"Other" tissues of elimination could include the lungs and additional sites of metabolism, eg, blood or muscle.
The two major sites of drug elimination are the kidneys and the liver. Clearance of unchanged drug in the urine represents renal clearance. Within the liver, drug elimination occurs via biotransformation of parent drug to one or more metabolites, or excretion of unchanged drug into the bile, or both. The pathways of biotransformation are discussed in Chapter 4: Drug Biotransformation. For most drugs, clearance is constant over the concentration range encountered in clinical settings, ie, elimination is not saturable, and the rate of drug elimination is directly proportional to concentration (rearranging equation [2]):
This is usually referred to as first-order elimination. When clearance is first-order, it can be estimated by calculating the area under the curve (AUC) of the time-concentration profile after a dose. Clearance is calculated from the dose divided by the AUC.

Capacity-Limited Elimination
For drugs that exhibit capacity-limited elimination (eg, phenytoin, ethanol), clearance will vary depending on the concentration of drug that is achieved (Table 3–1). Capacity-limited elimination is also known as saturable, doseor concentration-dependent, nonlinear, and Michaelis-Menten elimination.
Most drug elimination pathways will become saturated if the dose is high enough. When blood flow to an organ does not limit elimination (see below), the relation between elimination rate and concentration (C) is expressed mathematically in equation (5):
The maximum elimination capacity is Vmax, and Km is the drug concentration at which the rate of elimination is 50% of Vmax. At concentrations that are high relative to the Km, the elimination rate is almost independent of concentration—a state of "pseudo-zero order" elimination. If dosing rate exceeds elimination capacity, steady state cannot be achieved: The concentration will keep on rising as long as dosing continues. This pattern of capacity-limited elimination is important for three drugs in common use: ethanol, phenytoin, and aspirin. Clearance has no real meaning for drugs with capacity-limited elimination, and AUC cannot be used to describe the elimination of such drugs.
Flow-Dependent Elimination
In contrast to capacity-limited drug elimination, some drugs are cleared very readily by the organ of elimination, so that at any clinically realistic concentration of the drug, most of the drug in the blood perfusing the organ is eliminated on the first pass of the drug through it. The elimination of these drugs will thus depend primarily on the rate of drug delivery to the organ of elimination. Such drugs (see Table 4–7) can be called "high-extraction" drugs since they are almost completely extracted from the blood by the organ. Blood flow to the organ is the main determinant of drug delivery, but plasma protein binding and blood cell partitioning may also be important for extensively bound drugs that are highly extracted.
Half-Life
Half-life (t1/2) is the time required to change the amount of drug in the body by one-half during elimination (or during a constant infusion). In the simplest case—and the most useful in designing drug dosage regimens—the body may be considered as a single compartment (as illustrated in Figure 3–2 B) of a size equal to the volume of distribution (Vd). The time course of drug in the body will depend on both the volume of distribution and the clearance:
* The constant 0.7 in equation (6) is an approximation to the natural logarithm of 2. Because drug elimination can be described by an exponential process, the time taken for a twofold decrease can be shown to be proportional to ln(2).
Half-life is useful because it indicates the time required to attain 50% of steady state—or to decay 50% from steady-state conditions—after a change in the rate of drug administration. Figure 3–3

shows the time course of drug accumulation during a constant-rate drug infusion and the time course of drug elimination after stopping an infusion that has reached steady state.
Figure 3–3.
The time course of drug accumulation and elimination. Solid line: Plasma concentrations reflecting drug accumulation during a constant rate infusion of a drug. Fifty percent of the steadystate concentration is reached after one half-life, 75% after two half-lives, and over 90% after four half-lives. Dashed line: Plasma concentrations reflecting drug elimination after a constant rate infusion of a drug had reached steady state. Fifty percent of the drug is lost after one half-life, 75% after two half-lives, etc. The "rule of thumb" that four half-lives must elapse after starting a drugdosing regimen before full effects will be seen is based on the approach of the accumulation curve to over 90% of the final steady-state concentration.
Disease states can affect both of the physiologically related primary pharmacokinetic parameters: volume of distribution and clearance. A change in half-life will not necessarily reflect a change in drug elimination. For example, patients with chronic renal failure have decreased renal clearance of digoxin but also a decreased volume of distribution; the increase in digoxin half-life is not as great as might be expected based on the change in renal function. The decrease in volume of distribution is due to the decreased renal and skeletal muscle mass and consequent decreased tissue binding of digoxin to Na+/K+ ATPase.
Many drugs will exhibit multicompartment pharmacokinetics (as illustrated in Figures 3–2 C and D). Under these conditions, the "true" terminal half-life, as given in Table 3–1, will be greater than that calculated from equation (6).
Drug Accumulation
Whenever drug doses are repeated, the drug will accumulate in the body until dosing stops. This is because it takes an infinite time (in theory) to eliminate all of a given dose. In practical terms, this means that if the dosing interval is shorter than four half-lives, accumulation will be detectable.
Accumulation is inversely proportional to the fraction of the dose lost in each dosing interval. The fraction lost is 1 minus the fraction remaining just before the next dose. The fraction remaining can be predicted from the dosing interval and the half-life. A convenient index of accumulation is the accumulation factor.

For a drug given once every half-life, the accumulation factor is 1/0.5, or 2. The accumulation factor predicts the ratio of the steady-state concentration to that seen at the same time following the first dose. Thus, the peak concentrations after intermittent doses at steady state will be equal to the peak concentration after the first dose multiplied by the accumulation factor.
Bioavailability
Bioavailability is defined as the fraction of unchanged drug reaching the systemic circulation following administration by any route (Table 3–3). The area under the blood concentration-time curve (area under the curve, AUC) is a common measure of the extent of bioavailability for a drug given by a particular route (Figure 3–4). For an intravenous dose of the drug, bioavailability is assumed to be equal to unity. For a drug administered orally, bioavailability may be less than 100% for two main reasons—incomplete extent of absorption and first-pass elimination.
Table 3–3. Routes of Administration, Bioavailability, and General Characteristics.
Route |
Bioavailability |
Characteristics |
|
(%) |
|
|
|
|
Intravenous (IV) |
100 (by |
Most rapid onset |
|
definition) |
|
|
|
|
Intramuscular |
75 to 100 |
Large volumes often feasible; may be painful |
(IM) |
|
|
|
|
|
Subcutaneous |
75 to 100 |
Smaller volumes than IM; may be painful |
(SC) |
|
|
|
|
|
Oral (PO) |
5 to <100 |
Most convenient; first-pass effect may be significant |
|
|
|
Rectal (PR) |
30 to <100 |
Less first-pass effect than oral |
|
|
|
Inhalation |
5 to <100 |
Often very rapid onset |
|
|
|
Transdermal |
80 to 100 |
Usually very slow absorption; used for lack of first-pass |
|
|
effect; prolonged duration of action |
|
|
|
|
|
|
Figure 3–4. |
|
|
|
|
|

Blood concentration-time curves, illustrating how changes in the rate of absorption and extent of bioavailability can influence both the duration of action and the effectiveness of the same total dose of a drug administered in three different formulations. The dashed line indicates the target concentration (TC) of the drug in the blood.
Extent of Absorption
After oral administration, a drug may be incompletely absorbed, eg, only 70% of a dose of digoxin reaches the systemic circulation. This is mainly due to lack of absorption from the gut. Other drugs are either too hydrophilic (eg, atenolol) or too lipophilic (eg, acyclovir) to be absorbed easily, and their low bioavailability is also due to incomplete absorption. If too hydrophilic, the drug cannot cross the lipid cell membrane; if too lipophilic, the drug is not soluble enough to cross the water layer adjacent to the cell. Drugs may not be absorbed because of a reverse transporter associated with P-glycoprotein. This process actively pumps drug out of gut wall cells back into the gut lumen. Inhibition of P-glycoprotein and gut wall metabolism, eg, by grapefruit juice, may be associated with substantially increased drug absorption.
First-Pass Elimination
Following absorption across the gut wall, the portal blood delivers the drug to the liver prior to entry into the systemic circulation. A drug can be metabolized in the gut wall (eg, by the CYP3A4 enzyme system) or even in the portal blood, but most commonly it is the liver that is responsible for metabolism before the drug reaches the systemic circulation. In addition, the liver can excrete the drug into the bile. Any of these sites can contribute to this reduction in bioavailability, and the overall process is known as first-pass elimination. The effect of first-pass hepatic elimination on bioavailability is expressed as the extraction ratio (ER):
where Q is hepatic blood flow, normally about 90 L/h in a person weighing 70 kg.