

ПОСОБИЕ_English_for_economists_посл
..PDFFINAL TASKS
1. Translate the following sentences using the vocabulary of Units 1 and 2.
Part I.
1. Цены на молочные продукты снова вырастут. 2. Мы ожидаем рост цен на продукты питания (a rise in food prices) этой осенью. 3. Люди не ожидали, что темпы инфляции будут такими высокими. 4. Цены на потребительские товары постоянно растут. 5. Потребители выбирают качественные товары по доступной цене. 6. По понедельникам рынок не работает. 7. На мировом рынке представлено огромное количество различных брендов. 8. Газ вырос в цене. 9. Население уменьшилось с 1,9 млн. до 1,3 млн. 10. Нам следует сократить потребление жирного и сладкого.
Part II.
1. 90-е годы 20 века были временем массовой безработицы. 2. В этом магазине предлагают 50% скидку на летнюю коллекцию (to offer a discount). 3. У нас нет свободных ресурсов, чтобы обновить техническое обеспечение лаборатории. 4. Из-за кризиса компания была вынуждена сократить трудовые издержки (costs). 5. Капитальные расходы
(expenditures) в этом году составили 37 млн. рублей. 6. Нашей компании нужно изыскать все доступные ресурсы для запуска (start up) нового направления производства. 7. Их больше интересовало, как было одето общество, нежели речь докладчика. 8. Эта компания применяет новые технологии в производстве строительных деталей. 9. Из-за недостатка практического опыта его не взяли на престижную работу. 10. У вас есть опыт работы в сфере экономики?
2.Speaking. Make a presentation on the following topic:
Choose any product you like and describe it, speak about technological process used in its production.
31
3. Find all the words and give their translation.
p |
r |
o |
d |
u |
c |
t |
c |
b |
a |
|
|
|
|
|
|
|
|
|
|
e |
e |
d |
c |
o |
n |
s |
u |
m |
e |
|
|
|
|
|
|
|
|
|
|
c |
d |
e |
m |
a |
n |
d |
j |
m |
s |
|
|
|
|
|
|
|
|
|
|
o |
t |
s |
u |
p |
p |
l |
y |
a |
e |
|
|
|
|
|
|
|
|
|
|
n |
r |
s |
m |
o |
n |
e |
y |
r |
r |
|
|
|
|
|
|
|
|
|
|
o |
a |
g |
o |
o |
d |
s |
b |
k |
v |
|
|
|
|
|
|
|
|
|
|
m |
d |
f |
s |
a |
l |
e |
u |
e |
i |
|
|
|
|
|
|
|
|
|
|
y |
e |
s |
e |
l |
l |
m |
y |
t |
c |
|
|
|
|
|
|
|
|
|
|
x |
y |
p |
r |
o |
d |
u |
c |
e |
e |
|
|
|
|
|
|
|
|
|
|
a |
z |
b |
u |
s |
i |
n |
e |
s |
s |
|
|
|
|
|
|
|
|
|
|
1.__________ |
6.__________ |
11._________ |
2.__________ |
7.__________ |
12._________ |
3.__________ |
8.__________ |
13._________ |
4.__________ |
9.__________ |
14._________ |
5.__________ |
10._________ |
15._________ |
4. Fill in the gaps using the words below:
Resource, capital, application, unemployment, skills, available, manufacturing, experience, labour, discount.
1. Our government carries out special measures to help reduce ______. 2. Do you give any
______ on this car? 3. Time is our most valuable _____ . You should use it deliberately. 4. Some employers use immigrants as cheap _____ . 5. The starting _____ of the business was estimated as $100.000. 6. The pop star was not _____ for taking photos, autographing and giving comments. 7. _____ of this cream will help you to reduce pain in your legs. 8. We all learn by
_____ . 9. We need people with practical _____ . 10. Jobs in _____ are not very popular now.
32

Unit 3.
Demand and Supply
Text 3A
1.Before you start.
How do you understand the term demand?
What factors can influence demand?
2.Read the words and learn them by heart. Make up your own
sentences with them.
1.Demand – спрос (на товары)
2.Supply – предложение, обеспечение
3.Variables – переменные факторы, переменные величины
4.Determinant – решающий фактор, детерминант, определитель
5.Related goods and services – соответствующие товары и услуги
6.To vary – меняться, изменяться, варьировать, колебаться
7.Income – доход, прибыль
8.To tend – иметь тенденцию, стремиться
9.Demand curve – кривая спроса
10.Roast – обжарка (о кофе)
11.To range from smth. to smth. – колебаться в пределах (от … до …)
12.To plot on smth. – наносить на (график), картировать
13.Representation – изображение, представление
14.Preference – предпочтение, преимущество
15.Bagel – баранка, бублик
16.To induce – побуждать, склонять, воздействовать (на кого-либо)
17.Shift – перемещение, изменение, сдвиг
18.Schedule – список, план, таблица
33

3. Read the text 3A, translate it and compare your ideas in ex.1 with the
facts.
Demand
How many pizzas will people eat this year? How many doctor visits will people make? How many houses will people buy?
Each good or service has its own special characteristics that determine the quantity people are willing and able to consume. One is the price of the good or service itself. Other independent variables that are important
determinants of demand include consumer preferences, prices of related goods and services, income, demographic characteristics such as population size, and buyer expectations. The number of pizzas people will purchase, for example, depends very much on whether they
like pizza. It also depends on the prices for alternatives such as
hamburgers or spaghetti. The number of doctor visits is likely to vary with income – people with higher incomes are likely to see a doctor more often than people with lower incomes. The demands for pizza, for doctor visits, and for housing are certainly affected by the age distribution of the population and its size.
While different variables play different roles in influencing the demands for different goods and services, economists pay special attention to one: the price of the good or service. Given the values of all the other variables that affect demand, a higher price tends to reduce the quantity people demand, and a lower price tends to increase it. A medium pizza typically sells for $5 to $10. Suppose the price were $30. Chances are, you would buy fewer pizzas at that price than you do now. Suppose pizzas typically sold for $2 each. At that price, people would be likely to buy more pizzas than they do now.
We will discuss first how price affects the quantity demanded of a good or service and then how other variables affect demand.
Price and the Demand Curve. The quantity demanded of a good or service is the quantity buyers are willing and able to buy at a particular price during a particular period, all other things unchanged.
A demand schedule is a table that shows the quantities of a good or service demanded at different prices during a particular period, all other things unchanged. To introduce the concept
34

of a demand schedule, let us consider the demand for coffee in the United States. We will ignore differences among types of coffee beans and roasts, and speak simply of coffee. The table in Figure 3.1 "A Demand Schedule and a Demand Curve" shows quantities of coffee that will be demanded each month at prices ranging from $9 to $4 per pound; the table is a demand schedule. We see that the higher the price, the lower the quantity demanded.
Figure 3.1 A Demand Schedule
and a Demand Curve
The table is a demand schedule; it shows quantities of coffee demanded per month in the United States at particular prices, all other things unchanged. These data are then plotted on the demand curve. At point A on the curve, 25 million pounds of coffee per month are demanded at a price of $6 per pound. At point B, 30 million pounds of coffee per month are demanded at a price of $5 per pound.
The information given in a demand schedule can be presented with a demand curve, which is a graphical representation of a demand schedule. A demand curve thus shows the relationship between the price and quantity demanded of a good or service during a particular period, all other things unchanged (such as income or population).
Changes in Demand. Of course, price alone does not determine the quantity of a good or service that people consume. Coffee consumption, for example, will be affected by such variables as income and population. Preferences also play a role. We also expect other prices to affect coffee consumption. People often eat doughnuts or bagels with their coffee, so a reduction in the price of doughnuts or bagels might induce people to drink more coffee. An alternative to coffee is tea, so a reduction in the price of tea might result in the consumption of more tea and less coffee. Thus, a change in any one of the variables held constant in constructing a demand schedule will change the quantities demanded at each price. The result will be a shift in the entire demand curve rather than a movement along the demand curve. A shift in a demand curve is called a change in demand.
35

Just as demand can increase, it can decrease. In the case of coffee, demand might fall as a result of events such as a reduction in population, a reduction in the price of tea, or a change in preferences. For example, a definitive finding that the caffeine in coffee contributes to heart disease, which is currently being debated in the scientific community, could change preferences and reduce the demand for coffee.
Demand Shifters. Different goods and services may have different demand shifters, the demand shifters are likely to include (1) consumer preferences, (2) the prices of related goods and services, (3) income, (4) demographic characteristics, and (5) buyer expectations.
(Source: Principles of Microeconomics; http://www.saylor.org)
4.Say if the sentences concerning Text 3A are true or false.
1.The price of the good or service itself determine the quantity people are willing and able to consume.
2.Other variables that determine the demand are season of the year, our mood and physical condition.
3.People with higher incomes are likely to purchase goods and services more often than people with lower incomes.
4.A lower price tends to reduce the quantity people demand, and a higher price tends to increase it.
5.A demand curve shows the relationship between the price and quantity demanded of a good or service.
6.Prices of other goods and services do not affect demand and consumption of the particular product.
5.Answer the following questions.
1.What characteristics determine the quantity people are willing and able to consume?
2.Which of them is the most important one?
3.How does price affect the quantity demanded of a good or service?
4.How do you understand the notion ―the quantity demanded of a good or service‖?
5.What do a demand schedule and a demand curve show?
6.What can cause changes in demand? What variables affect consumption of goods and services?
7.Speak about alternative products.
36
8.Different goods and services may have different demand shifters; what are they?
6.Study, translate into Russian the following economic terms and match them with their definitions.
Word |
Definition |
|
|
1. peak |
a. a period when there is little economic activity and many people are |
|
poor or without jobs. |
|
|
2. boom |
b. a difficult time for the economy of a country, when there is less |
|
trade and industrial activity than usual and more people are |
|
unemployed. |
|
|
3. expansion |
c. a situation in which smth. improves or increases over a period of |
|
time. |
|
|
4. depression |
d. a fall in the amount of business that is done; a time when the |
|
economy becomes weaker. |
|
|
5. recession |
e. a period of time when the level of smth. is low, especially a time |
|
when a business or the economy is nor growing. |
|
|
6. downturn |
f. the point when smb. or smth. is best, most successful, strongest, etc. |
|
|
7. upturn |
g. an act of increasing or making smth. increase in size, amount or |
|
importance. |
|
|
8. trough |
h. a sudden increase in trade and economic activity; a period of wealth |
|
and success. |
|
|
7. Give English equivalents of the following words and word combinations from Text 3A.
Особые характеристики, предпочтения покупателя, соответствующие товары и услуги, демографические параметры, показатели, цены на альтернативные товары,
варьироваться в зависимости от дохода, возрастной состав, экономисты обращают особое внимание, принимая во внимание ценность других переменных, обычно продается, шкала спроса, кривая спроса, потребление кофе, может побудить людей пить больше кофе,
понижение чая в цене, сдвиг кривой спроса, изменение спроса, сокращение численности населения.
37

8. Discuss with the group the following topic and solve the problem:
All other things unchanged, what happens to the demand curve for car rentals if there is
(a) an increase in the price of fuel, (b) a decrease in family income, or (c) an increase in the price of car rentals? In answering this problem, draw and carefully label a set of axes. On the horizontal axis of your graph, show the quantity of car rentals. It is necessary to specify the time period to which your quantity pertains (e.g., ―per period,‖ ―per week,‖ or ―per year‖). On the vertical axis show the price per car rental. Since you do not have specific data on prices and quantities demanded, make a ―free-hand‖ drawing of the curve or curves you are asked to examine. Focus on the general shape and position of the curve(s) before and after events occur. Draw new curve(s) to show what happens in each of the circumstances given. The curves could shift to the left or to the right, or stay where they are.
Text 3B
1.Before you start.
How do you understand the term supply?
What factors can influence supply?
2.Read the words and learn them by heart. Make up your own
sentences with them.
1.Production cost – стоимость производства,
производственные затраты
2.Returns – прибыльность
3.Expectation – ожидание, надежда, вероятность
4.Refer to – ссылаться на, относиться к
5.Profit – польза, выгода, прибыль, доход
6.To earn profit – приносить прибыль, давать прибыль
7.To make profit – извлекать прибыль, получать прибыль
8.Exception – исключение, несоответствие
9.Reduction – снижение, понижение, уменьшение
10.Upward sloping – наклонѐнный вверх
11.Movement – движение, перемещение
38

3. Read the text 3B, translate it and compare your ideas in ex.1 with the
facts.
Supply
What determines the quantity of a good or service sellers are willing to offer for sale? Price is one factor; ceteris paribus, a
higher price is likely to induce sellers to offer a greater quantity of a good or service. Production cost is another determinant of supply. Variables that affect production cost include the prices of factors used to produce the good or service, returns from alternative activities, technology, the expectations of sellers, and natural events such as weather changes. Still another factor affecting the
quantity of a good that will be offered for sale is the |
http://www.greekshares.com/uploads/image |
|
number of sellers – the greater the number of sellers of a particular good or service, the greater will be the quantity offered at any price per time period.
Price and the Supply Curve
The quantity supplied of a good or service is the quantity sellers are willing to sell at a particular price during a particular period, all other things unchanged. Ceteris paribus, the receipt of a higher price increases profits and induces sellers to increase the quantity they supply.
In general, when there are many sellers of a good, an increase in price results in an increase in quantity supplied, and this relationship is often referred to as the law of supply. Though there are a number of exceptions to this relationship. There are cases in which a higher price will not induce an increase in quantity supplied. Goods that cannot be produced, such as additional land on the corner of Park Avenue and 56th Street in Manhattan, are fixed in supply – a higher price cannot induce an increase in the quantity supplied. There are even cases, in which a higher price induces a reduction in the quantity supplied.
Generally speaking, however, when there are many sellers of a good, an increase in price results in a greater quantity supplied. The relationship between price and quantity supplied is suggested in a supply schedule, a table that shows quantities supplied at different prices during a particular period, all other things unchanged. Figure 3.2 "A Supply Schedule and a Supply Curve" gives a supply schedule for the quantities of coffee that will be supplied per month at various prices, ceteris paribus. At a price of $4 per pound, for example, producers are willing to
39
supply 15 million pounds of coffee per month. A higher price, say $6 per pound, induces sellers to supply a greater quantity – 25 million pounds of coffee per month.
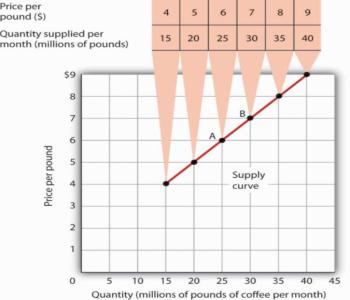
Figure 3.2 A Supply Schedule and a Supply Curve
The supply schedule shows the quantity of coffee that will be supplied in the United States each month at particular prices, all other things unchanged. The same information is given graphically in the supply curve. The values given here suggest a positive relationship between price and quantity supplied.
A supply curve is a graphical representation of a supply schedule. It shows the relationship between price
and quantity supplied during a particular period, all other things unchanged. Because the relationship between price and quantity supplied is generally positive, supply curves are generally upward sloping. The supply curve for coffee in Figure 3.2 "A Supply Schedule and a Supply Curve" shows graphically the values given in the supply schedule.
A change in price causes a movement along the supply curve; such a movement is called a change in quantity supplied. As is the case with a change in quantity demanded, a change in quantity supplied does not shift the supply curve. By definition, it is a movement along the supply curve. For example, if the price rises from $6 per pound to $7 per pound, the quantity supplied rises from 25 million pounds per month to 30 million pounds per month. That‘s a movement from point A to point B along the supply curve in Figure 3.2 "A Supply Schedule and a Supply Curve".
(Source: Principles of Microeconomics; http://www.saylor.org)
4.Say if the sentences concerning Text 3B are true or false.
1.A higher price induces sellers to offer a lesser quantity of goods and services.
2.Price and production cost are the main determinants (factors) that influence supply.
3.The higher the price, the more will be the sellers on the market.
4.Sometimes a higher price may induce a reduction in the quantity supplied.
40