
Molecular Heterogeneous Catalysis, Wiley (2006), 352729662X
.pdf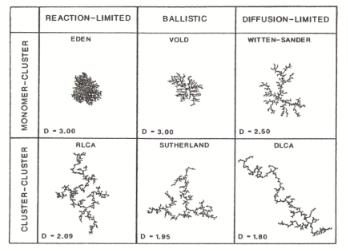
396 Chapter 9
Another form of aging may be due to crosslinking processes, where adjacent hydroxyl groups or hydroxyl groups from adjacent gel branches will polymerize into siloxane bonds. During this process the gel may contract and with shrinkage of the gel will take place expulsion of reaction liquid from the pores. This form of aging is called syneresis.
Coarsening or ripening is a third form of aging where dissolution and reprecipitation of silica particles occur, driven by the di erences in solubility between surfaces with di erent radii of curvature. Redissolution will occur from surfaces with positive curvature and will precipitate in regions with a negative curvature, causing growth of necks between aggregated particles, increasing the strength and sti ness of the entire gel.
Aging results in a reinforcement of the structure, originated during aggregation (and gelation). The average pore radius of the gel will increase by these reorganization reactions and the specific surface area will decrease owing to the transport of material to energetic more favorable positions. If the gels are not aged, the pores are very likely to collapse during drying owing to the minimal strength of the backbone and strain forces due to the surface tension of liquid droplets. Aging of the gels, prepared as described above, is a necessity in order to obtain mesoporous materials from them.
9.7.2 Fractals
The aggregates formed during silica gel preparation often tend to exhibit fractal properties. This implies a powerlaw distribution of particle or micropore sizes. Power law kinetics appear to be the consequence of processes where objects grow and/or decompose. The growth rates are typically random and independent of the particle size.
A large number of computer growth models which produce fractal structures have been published[47]. Six basic models can be distinguished and are di erentiated by two main factors: transport or di usion and reaction or sticking probability. In Fig. 9.22 a survey of these six basic models is presented.
Figure 9.22. Models of kinetic growth. The mass fractal dimensions of the three-dimensional simulations
are shown but for clarity reasons the corresponding two-dimensional clusters are shown. Adapted from R. Julien and R. Botet[47].
Heterogeneous catalysis the origin of life, biomineralization 397
Clusters approach each other by Brownian motion in the di usion-imited regime. Because of the di usive nature of the transport, few particles ever penetrate into the interior of the structure that is formed and most growth takes place at the tips of the cluster. In ballistic growth, the trajectories of the particles are linear and large compared with the size of the growing clusters. As a result, the monomers are more likely to penetrate into the interior of a cluster than in di usion-limited growth, resulting in more compact structures having a larger fractal dimension. In the case of reaction-limited growth, transport is considered facile with respect to reaction. The sticking probability between particles becomes important here. Numerous contacts are required before a bond is succesfully formed, permitting monomers to penetrate deeper into the interior of the growing clusters, resulting in compact aggregates. As is illustrated in Fig. 9.22, it is important to distinguish aggregation processes with growth through monomer–cluster reaction from systems that aggregate through cluster–cluster reactions. The interpretation of dimension D is given in the next paragraph.
Mass fractal structures are characterized by a mass gradient in the cluster according to: M RDf where M the mass of the cluster, R the radius of the cluster and Df the mass fractal dimension. This relation represents self similarity. Self similarity means that a similar dimensionality, that reflects the connectivity of a network, is found when di erent length scales of a material are probed. The self similarity of a cluster is defined between Rg , the radius of gyration of the cluster, and R0, the radius of gyration of the primary building unit. Systems with Euclidean, non-fractal dimensions such as a rod, a disc and a sphere-like structure, have mass fractal dimensions of Df = 1, 2 and 3, respectively, consistent with the common characterization of these objects. For mass fractal objects the fractal dimension Df is a non-integer and varies between 1 and 2 in two-dimensional space and between 1 and 3 in three-dimensional space. The fractal dimension is defined
by the formula M RDf , implying |
|
|
|
|
|
log |
Mi+1 |
|
|
Df = |
Mi |
|
(9.2) |
|
|
|
|||
log |
Ri+1 |
|
||
|
|
|
||
|
Ri |
|
|
|
|
|
|
|
|
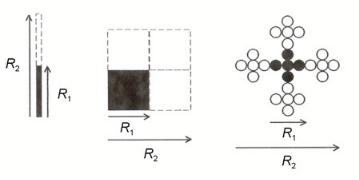
In a particle growing by iteration, in each iteration step, when increasing the radius of the object from Ri to Ri+1, the mass of the object will increase from Mi to Mi+1. This is illustrated in Fig. 9.23.
Figure 9.23. Increase in mass of some common objects and a fractal object with increasing radius. The mass fractal dimensions are discussed in the text.

398 Chapter 9
Rod: M increases by a factor of 2 if R increases by a factor of 2
M Rlog 2/ log 2 R1
Plane: M increases by a factor of 4 if R increases by a factor of 2
M Rlog 4/ log 2 R2
Fractal object: M increases by a factor of 5 if R increases by a factor of 3
M Rlog 5/ log 3 R1.465
In principle, the same approach is followed when dealing with other objects in threedimensional space. In this way, the dimensionality of the structure of silica gels is determined. As illustrated in Fig. 9.24, when zooming in on smaller length scales, initially the internal structure is determined by the primary building. Further magnification measures the surface structure or internal structures of the primary building unit. The dimensionalities can now be di erent.
Figure 9.24. The structure of a mass fractal object on several length scales.
The surface roughness can be described in a fashion analogous to that for the mass fractal structure according to
S aDs |
(9.3) |
The variable a can be considererd a measure of the surface of the rough particle. It is a ruler. If a ruler is large a lot of small cavities will not be noticed and the resulting surface area is small. When the length of a ruler decreases, more and more surface irregularities will be found, contributing to an exponential increase in surface area. The power-law exponent of the relation between length of the ruler and the corresponding surface is termed the surface fractal dimension (Ds).
For Ds = 2, the particles have a smooth surface and the surface is two-dimensional. When the surface roughness increases, Ds can vary between 2 and 3. The surface fractal dimension will approach three for an exceedingly rough surface that also may be described as a structure with a homogeneous distribution of mass and voids. The surface area will then be proportional to the mass: D → 3. It has become three-dimensional.
9.7.3 Simulation of Aggregation Processes
The concentration of monomers plays a very important role in aggregation models. We discussed this earlier in Section 9.4.2, where we noted that percolation through a network becomes realized only when a limit concentration of connections is exceeded.
Here we will analyze the behavior of cluster–cluster aggregation as a function of the momomer volume fraction[48]. We will recognize features that relate to the behavior of percolation. A particular aim of the simulations is to analyze not only the aggregation but also the aging processes. Simulations on aging will be presented in Section 9.7.4.
Heterogeneous catalysis the origin of life, biomineralization |
399 |
The interesting aspect of concentration-dependent modeling is that at high concentrations through aging processes a microporous network is formed. The two-dimensional simulations are analyzed with an analytical model that permits the determination of the critical volume fraction φc for crossover from a non–percolating to a percolating system. Beyond the percolation point the concentration of the fractal–dimensional structure becomes initially local, and at high concentration the local fractal structures disappear.
The results of o -lattice di usion limited cluster–cluster aggregation (DLCA) simulations in two dimensions are presented in Fig. 9.26. Simulations are limited to two dimensions because it enables one to use large unit cells with many particles. Brownian trajectories are followed. Larger aggregates are generated as a result of bond formation between overlapping aggregates. One finds crossover from fractal to Euclidean behavior when a particular monomer concentration is exceeded.
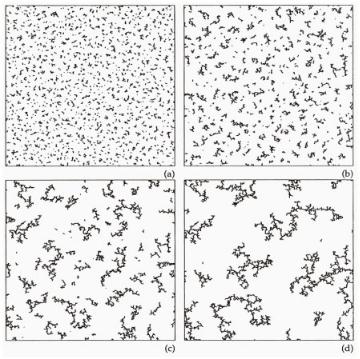
In the DLCA, reaction limitations are ignored and instantaneous bond formation is assumed. Figure 9.25 depicts resulting snapshots of the aggregation process for a low monomer concentration at successive moments in time. The onset of the formation of a fractal aggregate is visible after 729 moves (Fig. 9.25b). Both small and large aggregates are present, the latter being more anisotropic (less circular). Figure 9.25c shows continuing growth after 2187 moves, which has now resulted in the formation of some large fractal aggregates. The mass is now much less homogeneously distributed over the available space. The snapshot for move 6561 in Fig. 9.25d shows the system just before final aggregate formation. The final aggregate formed is shown in Fig. 9.26a. Only a few large aggregates remain. One of these will soon dominate the aggregate mass distribution. The aggregation process stops when one aggregate has been formed.
The aggregation process depicted in Fig. 9.25 clearly shows a wide variety of aggregates. The aggregate mass distribution, n, as found in aggregation models such as the DLCA model used here, is polydisperse. For a theoretical description that includes ζ, the correlation length associated with the length scale over which the structures exhibit fractal properties, it is convenient to approximate n as a delta function. This process defines the hierachical DLCA model. N aggregates are assigned mass M , while N M = N0M0 to ensure mass conservation during aggregation. The aggregates formed are fractal on a length scale between L0 and L1. The mass M of the aggregates as a function of length scale L between L0 and L1 is
M0 |
= |
L0 |
Df |
(9.4) |
|
|
|||||
M |
|
|
L |
|
|
The lower limit of fractality L0 is assumed to be the monomer radius R0. For distances L shorter than L0, the density ρ0 of the initial primary scatterer is set to unity. The density ρ of the fractal region can be expressed in analogy to Eq. (9.4) as
ρ |
= |
L |
|
Df −D |
|
|
|
(Df ≤ D) |
(9.5) |
||
ρ0 |
L0 |
Hence, for the e ective volume fraction φe, one finds
φe |
= |
L |
|
D−Df |
|
|
(9.6) |
||
φ0 |
L0 |
400 Chapter 9
Figure 9.25. Various stages of growth processes of DLCA aggregates in 2D at φ0 = 0.05: (a) move 243,
(b) 729, (c) 2187 and (d) 6561.
In this idealized model, the aggregates grow in time until finally one aggregate is formed. It is necessary to distinguish between two situations for the formation of the final single aggregate and the upper length scale L1 of fractality. In the first case (situation a), for high volume fractions, the growing aggregates touch at a certain stage of the simulation (see Fig. 9.26b). At this moment the total e ective volume of the aggregates has become equal to LDs , which is the volume of the simulation space where the aggregates can no longer perform their Brownian movements independently. The e ective volume fraction of the aggregates, φe, has reached 1.0 (percolation) before the final aggregate has been formed (gelation). For these high volume fractions one might say that percolation is faster than gelation: φae = 1 and Na > 1. This limits the development of fractal properties, leading to a change in L1. It then follows from Eq. (9.6) that for L1 = La
La |
= φ1/(Df −D) |
(9.7) |
|
||
0 |
|
|
L0 |
|
|
The upper length scale of fractality depends on φ0 and is smaller for high volume fractions. In the second case (see Fig. 9.26a), at low φ0, even the final aggregate is too small to span the box. The system does not percolate and that only gelation occurs: φbe < 1 and
Nb = 1. It then follows from Eq. 9.4
Lb |
= N |
1/Df |
(9.8) |
|
L0 |
0 |
|||
|
|
|||
|
|
|
Heterogeneous catalysis the origin of life, biomineralization |
401 |
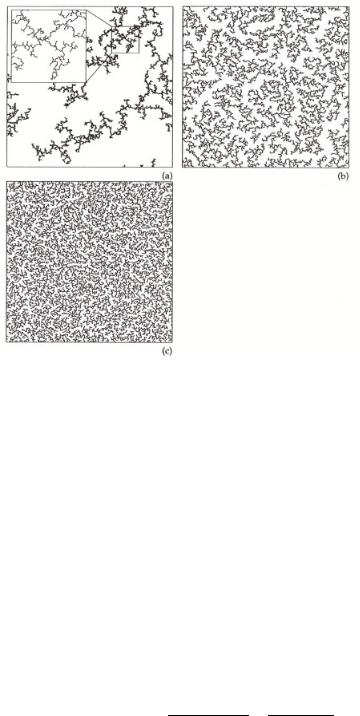
Figure 9.26. Aggregate formation at di erent particle volume fractions: (a) φ0 = 0.05, (b) 0.25 and
(c) 0.50. The aggregates are built using periodic boundary conditions and consequently some of the connecting bonds reach over the boundaries.
For low volume fractions the aggregate growth is not limited due to percolation. Intrinsic fractal bahavior is observed so that Lb depends only on the number of monomers in the system and the fractal dimension of the aggregatin process.
The critical volume fraction φc for the crossover situation can be calculated by combining Eqs. (9.7) and (9.8):
Lc |
1/(Df −D) |
1/Df |
(Df −D)/Df |
|
|
= φc |
= N0 |
φc = N0 |
(9.9) |
L0 |
The results are typical for percolating systems[29] . Equation (9.9) shows that the occurrence of percolation depends on the value of N0 used in the simulation. Equation (9.7) indicates that the upper length scale of fractal behavior does not depend on N0 for
φ0 > φc.
It should be realized that the upper length limit of fractal behavior, L1, is related to, but not identical with, the correlation length, ζ. L1 is the radius of the fractal regions while ζ must be related to the radius of gyration of the fractal regions. The correlation length can be calculated by combining the definition of the radius of gyration and eq. (9.5):
|
|
L1 ρ(L)L2 dL |
|
2 |
D + Df |
|
|
||
ζ2 = |
|
L1 |
ρ(L)dL |
= |
4 |
− |
L12 |
(9.10) |
|
|
D + Df |
||||||||
|
|
|
|
|
|
− |
|
|
|
402 Chapter 9
L1 can be calculated using Eqs. (9.7)–(9.9) depending on φ0. For Df = 1.45 and D = 2, the following relation between L1 and ζ is found:
ζ = |
|
2 + Df L1 |
0.65L1 |
(9.11) |
|
|
Df |
|
|
The essential features of cluster–cluster aggregation as a function of concentration are shown in Fig. 9.26 at volume fractions 0.05 (a), 0.25 (b) and 0.50 (c). At φ0 = 0.05, the mass-fractal properties are well developed and the aggregate has a very ramified structure. At φ0 = 0.25, the mass-fractal properties are only present at short length scales. The long–range structure seems almost homogeneous. At φ0 = 0.50, no mass-fractal structure is visible and the morphology resembles a high volume fraction 2D random network. The structure looks homogeneous at all length scales.
9.7.4 Expressions for Aging of Fractal Systems
Results are reviewed here that describe morphology changes by aging of aggregates formed by the di usion-limited aggregation process as described in the previous section. As we noted before in Section 9.7.1, the aging process creates larger, stable micropores in initially fragile and narrow pore gels. We saw in the previous section for a high monomer content (high volume fraction) that the development of fractal properties is limited during percolation and consequently the correlation length at high volume fractions is smaller than the size of the aggregate. For low volume fraction the aggregates can grow unrestricted by the size of the space constraints and the correlation length can be identified as the radius of gyration of the resulting aggregate. A crossover between these situations is present at the critical volume fraction. For this volume fraction the final aggregate size equals the size of the space (either the simulation space or the silica gel container) in which it is grown in. Aging processes are responsible for the formation of stable and larger micropores in systems prepared through sol–gel processes.
Aging processes such as random bond breaking and ring formation induce changes in the (fractal) properties of the system such as:
–Formation of new primary particles of radius R0 with density ρ0.
–Shrinking of the aggregates, due to sintering or resolvation, thereby inducing changes in the correlation length ζ, the system size and the aggregate density ρ and the volume fraction φ0.
–Changes in the fractal dimension Df .
Often, several changes in the fractal properties appear simultaneously. Using the modified system parameters, an expression equivalent to Eq. (9.5) can be written down for the aged system:
ρ |
|
L |
Df −D |
|
|
= |
|
|
(9.12) |
ρ0 |
L0 |
|||
Equations (9.5) and (9.12) allow us to relate the fractal properties of non-aged and agedaggregates.
When a fractal system shrinks homogeneously, the upper length scale of fractality L will decrease to L . The density of the aggregate will increase from ρ to ρ . The lower
Heterogeneous catalysis the origin of life, biomineralization |
403 |
limit of fractal behavior, L0, and consequently the density, ρ0, of the primary building unit of the system are not a ected by the homogeneous shrinking process.
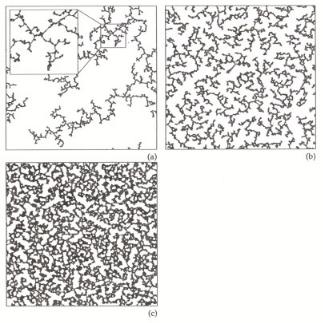
We will analyze simulation results of one particular kind of aging, called shaking. Bond breaking and monomer fusion are not allowed for. The monomers within an aggregate are moved (shaken) with respect to each other. When monomers overlap, an additional bond is formed.
Figure 9.27. The same aggregates as in Fig. 9.27 after 25,000 shaking moves. (a) φ0 = 0.05, (b) 0.25 and (c) 0.50.
The e ect of shaking on the aggregates of Fig. 9.26 is shown in Fig. 9.27. The short side-chains of the aggregate of Fig. 9.27a have folded on to the backbone forming chains of 3-monomer rings. The disappearance of side-chains causes a more sparse appearance. Long chains have been deformed only slightly so that the long-range mass-fractal structure has been preserved. In the aggregate of Fig. 9.27c the short side-chains have also disappeared, but because of the absence of mass-fractal behavior the system has become more compact instead of open. For the aggregate of Fig. 9.27b the two e ects are visible at low and high φ0 are combined. Both sparse and dense regions have been formed. So for all volume fractions short side chains have been folded into chains of 3-monomer rings or larger structures built of 3-monomer rings.
One notes especially from the comparison of Figs. 9.26c and 9.27c, above the critical volume fraction φc the creation of large micropores due to the aging processes.
9.8 In Conclusion; Self Organization and Self Assembly
The design of catalytic systems requires the ability to synthesize specific material architectures and the atomic control of the catalytically active reaction centers. The biomin-
404 Chapter 9
eralization part of this chapter illustrated how preorganization of lipophilic molecules in an ordered phase controls the synthesis of crystalline microporous crystals with dimensions on the order of several nanometers. Polymers with hydrophilic and hydrophobic subunits can be used to synthesize a wide variety of structured materials. The polymer– silica ratio, temperature and solution phase conditions can be tuned in order to create mesoporous systems with ordered pore structures, fractal particles or hollow particles of large dimensions. The membrane of the latter contains well-defined nanopores. A fractal pore surface optimizes the surface area and at the same time contains wide channels. The great challenge in the design of the catalyst architecture is to design materials that allow for ready access of catalytic centers in high-density material. Ready access requires wide pore channels of high connectivity, implying low density. A high concentration of catalytic sites, on the other hand, requires a high-density material. Materials with channels that could feed the catalytic centers independently are highly desirable.
For example, in oxidation catalysis the introduction of separate channels for the oxidant, the reactant and the product would result in significantly improved selectivity. The catalytically active component should reside in the wall of one of the channels and the pore dimensions of the channel should be such as to allow only migration of one of the reaction components.
When liquids are used, the channels should be at least 1 µm in diameter; the catalytic centers can still exist as nanometer-size cavities, to be connected through thin walls with well-defined molecular-sized micropores. Channels or micro cavities could be hydrophilic or hydrophobic and thus tuned by the needs of the particular reaction studied. The architecture of a catalytic system aims to reduce mass transport limitations and optimize the mixing of components at least near catalytically active centers. Second, for highly exothermic or endothermic reactions, the design should also include heat transfer considerations. Clearly this is a topic where there is a need for extensive catalytic process modeling and innovative catalyst synthesis.
In this chapter, the siliceous framework of the diatoms has been introduced as an example of a system that has micropores and channels that vary over many dimensions. Synthetic design approaches that allow for the self assembly of amphiphilic molecules into large units and phase separation provide a way to make such multi-scaled ordered porous materials.
In the biomimetic biomineralization approach, such materials with ordered porosity of varying size and connectivity are made through conversion of structure-directing organic phases converted into a solid catalyst by fixation through hydrolysis of co-mixed or attached siloxy fragments (see review by Zhao et al.[33a]). This approach can be generalized to produce microporous materials of other elements such as Al, Ti and V with widely varying composition[33a].
The first part of the chapter dealing with the chemistry of evolutionary protocell formation discussed new strategies for the design of self assembling catalytic systems that can self adapt in order to control activity or selectivity for a particular conversion reaction. Biomimetic biomineralization processes are successful catalyst synthesis strategies to produce structured microporous systems. Mineral fixation as exemplified in this chemistry can also be of use to convert the protocell-type catalytic system into a practical heterogeneous catalyst. The aim of the exposition of theories of artificial life and chemistry was to establish the fundamental elements necessary to synthesize a catalytically active center by evolutionary synthesis design. In Chapter 7 we discussed that the catalytically active site in an enzyme provides an optimum arrangement of functional groups around the reacting
Heterogeneous catalysis the origin of life, biomineralization 405
molecules where matching the shape and size of a reaction cavity are key to generating high selectivity and activity. The evolutionary adaptive systems, discussed in the earlier part of the chapter on the origin of life, were based on the philosophy that the predictive capabilities of the relation between catalyst structure and function are still imperfect. In addition, well-defined synthesis strategies are often not available or possible. Hence rational catalyst design should employ an approach in which the catalytic center configures itself. Molecular recognition chemistry of a template, that relates to the transition state of a kinetically important catalytic reaction intermediate, is the link between the catalytic reaction and the catalytic system. Evolutionary adaptive synthesis the implies formation of a catalytic system that proceeds in stages. After each synthesis stage the system is tested. Systems survive and multiply when the test is positive. Intrinsic to the evolutionary process after each stage, protocells grow and multiply. In the multiplication process there is a possibility of mutation of building or replication units.
A protocellular system requires a membrane to separate it from the environment. The chemical machinery has to be in place that can synthesize the membrane and the catalytically active system. We discussed especially in detail the W¨achtersh¨auser proposal in which FeS, which acts as a catalyst, is coupled with an energy source to provide for the evolutionary formation of protocells. The energy-providing source in this system is the pyrite formation reaction from FeS itself. A necessity for multiplication and self organization is an autocatalytic reaction system that can be induced to reproduce the cell machinery when the cell membrane can no longer support internal growth and starts to divide. Once the optimum catalytic system has evolved, a fixation step as in biomineralization has to be added to convert the preorganized protocellular system to a heterogeneous solid catalyst. Succesful protocellular systems are becoming within reach. Rasmussen et al.[49] and Szostak et al.[50] have discussed liposome systems with self dividing walls. In their system the liposome interior contains a replicating chemical reaction system and employs light as an energy source. Once a molecular recognition system has been added and the chemistry of its replication has been implemented, an evolutionary adaptive design process can be made operational. Interestingly, adaptation implies, as in the immunoresponse system, that the molecular recognition system has to improve in the di erent synthesis stages and should be able to operate against a range of test molecules. The molecular recognition site therefore has to assemble itself from molecular building units, that can mutate.
Although so far the ultimate goal of evolutionary adaptive catalyst self assembly has not been realized, there are many uses of parts of the system that are within close reach. For instance, there is a need to assemble catalysts based on the replication of atomic rearrangement patterns in two dimensions. The predicted alloy configurations, discussed in previous chapters, which are optimal for particular catalytic reactions have to be translated into three-dimensional layered materials. Molecular recognition, combined with chemical amplification, could be the basis of the design of sensors. Adaptive design could make them biocompatible. Rational design will likely require the close combination of theory, modeling and experimental exploration.
In this book we have provided an overview of the physical chemistry of catalytic systems with a focus on molecular mechanistic aspects. Theories, concepts and techniques to describe the relevant chemistry have advanced to a state that the reaction mechanism in heterogeneous catalysis is becoming well understood. Clearly, similar advances relevant to the practice of catalyst synthesis and design are now on the near horizon. The foundation of theoretical molecular heterogeneous catalysis provides a firm basis towards these future endeavors.
