

Molecular Heterogeneous Catalysis, Wiley (2006), 352729662X
.pdf196 Chapter 4
Figure 4.30. The catalytic cycle of a zeolite-catalyzed reaction.
activation or desorption is rate limiting. In the absence of di usional constraints, the rate of product desorption competes with that of reactant activation. The elementary reaction steps of the latter processes proceed through steps with transition-state barriers that are typically between 50 and 150 kJ/mol.
As mentioned earlier, the interaction between hydrocarbons and the zeolite micropore depends upon a weak van der Waals attraction between the polarizable zeolite frameworkoxygen atoms and the hydrocarbon units such as aromatic, CH2 or CH3 groups. These interactions are too weak to be described e ectively by density functional theory. Although higher level CI calculations can more accurately model van der Waals interactions, they typically cannot model a large enough portion of the zeolite to provide an approriate model for a mesoporeous system. Empirical force fields, however, are e ective in accurately describing these van der Waals interactions. Adsorption properties are, therefore, typically computed from force field calculations rather than from quantum mechanics. The use of such force fields in combination with the application of statistical mechanical techniques in Monte Carlo methods[45] allows the prediction of the chemical potential of adsorbed molecules as a function of temperature and pressure. This is very important since adsorption appears to be controlled not only by the adsorption enthalpy, but also by entropy e ects that may depend strongly on the micropore filling with adsorbed molecules. For alkanes, the adsorption enthalpy is strongly dependent on their chain length which is incremental in the number of CH2 units. The van der Waals interaction energy may vary between 5 and 15 kJ/mol per CHx unit. The interaction energy increases when the pore dimension and the hydrocarbon chain dimension better match one another[46].
The implication is that the adsorption energies of hydrocarbons can be of the same order of magnitude or even larger than the activation barriers of the intrinsic rate constants. In this section we will discuss expressions for the overall rate when the intrinsic reaction rate (e.g. proton activation) is rate determining. In the next section we will discuss the consequences especially for selectivities of a reaction when the desorption rates are rate limiting. To introduce the subject, we first present some simple expressions used in modeling monomolecular reactions.
For a monomolecular reaction, the rate of the reaction normalized per reaction center
is:
r = |
Roverall |
= kact · θads |
(4.1) |
Nact.site |

Shape-Selective Microporous Catalysts, the Zeolites |
197 |
where θads is the equilibrium concentration of reactant adsorbed at the reaction center and kact is the elementary rate constant for the conversion of the molecule adsorbed at the reaction center. In general, the expression for θads is complex. It not only depends upon the many equilibrated intermediate reaction steps, but may also depend upon the micropore concentrations of adsorbed reactants and products. On the other hand, expression (4.1) is very general and, as we will discuss more extensively in Chapter 7, is used in heterogeneous, homogeneous and biocatalysis. In the last two cases, θads is replaced by the concentration of the reaction complex formed by the interaction of the reactant with the organometallic complex or the biocatalyst (enzyme). Expression (4.1) is the equivalent of the Michaelis–Menten expression for the catalytic reaction rate in biochemistry.
As we will discuss in the next section, it is of interest to analyze the meaning of the expression when the Langmuir adsorption expression for θ is used. For a monomolecular gas-phase reaction, the expression for the catalytic reaction rate is
r = kact. |
Keqads.p |
|
(4.2) |
1 + Kads |
.p |
||
|
eq |
|
|
where Keqads is the adsorption equilibrium constant for the reactant at the reaction center and p is the gas phase pressure of the reactant. Note that expression (4.2) is also simplified since the adsorption of the product molecule is ignored.
Expression (4.2) illustrates an important kinetic feature: the order of a catalytic reaction depends strongly on the reaction concentration. At low pressure, the rate is first order in reactant and at high pressure the rate is zero order in reactant. Second, the overall rate depends on the intrinsic rate constant of an elementary reaction step, kact, and also on the adsorption constants. Expression (4.2) is valid only under the ideal conditions that all catalytic centers are similar and there are no interactions between reactant and (or) product molecules. These conditions are rarely satisfied and, for this reason, practical rate-expressions are often more complicated than Eq. (4.2). Expression (4.2) illustrates, however, that the interplay between surface coverage and elementary rate constants is very important, so that for an overall prediction of the reaction rate one needs to integrate intrinsic reaction rate predictions with surface state predictions. As mentioned earlier, the equilibrium constants for adsorption can be calculated using either statistical or dynamical Monte Carlo methods[45,46].
To illustrate the use of Eq. (4.1) in zeolite catalysis, we will discuss the results of theoretical and experimental studies of the hydroisomerization reaction of hexane[47]. In order to exclude di usion limitation, two conditions have to be met. First, the Biot condition must be satisfied when the rate of desorption is limiting:
D |
(4.3) |
kdes R2 |
where R is the radius of a crystallite particle and D the rate of di usion. If kdes is rate limiting,both di usion and the elementary reaction rates within the zeolite micropore are fast compared with desorption.
More generally, the rate of di usion should be much faster than the intrinsic rate of a chemical reaction:
R |
D |
1 |
(4.4) |
|
Roverall |
|
|

198 Chapter 4
where Roverall is the rate constant defined in Eq. (4.1), D the rate of di usion and R the radius of the crystallite. This expression is derived from the classical Thiele modulus
expression where the intrinsic rate is thought to be controlling.
Zeolites used in the hydroisomerization of alkanes typically contain small transitionmetal clusters such as Pt or Pd[47]. The hydrogenhydrocarbon ratio in these systems is typically 30 and the reaction occurs at around 250 ◦C. Hydroisomerization typically proceeds by alkane dehydrogenation over the metal. The alkene intermediate that forms can subsequently undergo isomerization at an acid site before it is rehydrogenated over the metal. The transition metal is necessary here to establish the alkane–alkene equilibrium which implies a very low hexene equilibrium concentration. At this low concentration of alkene, catalyst deactivation reactions which are the result of acid-catalyzed oligomerization are suppressed. The elementary isomerization step that is rate limiting involves the activation of the alkene. The isomerization of the branched alkene proceeds through a cyclopropyl-type transition state (see Fig. 4.9). When the alkene adsorbs to the proton, only the π bond interacts with the proton. The CH2 and CH3 groups of the molecule experience van der Waals interactions with the siliceous part of the zeolite lattice. The interaction between the zeolite micropore and the hydrocarbon is hydrophobic. For a molecule such as hexene, this implies that the adsorption energy and the activation energy for desorption may vary between 30 and 90 kJ/mol for di erent zeolites. This variation in the interaction energy arises from the di erence in match between the radius of the alkyl portion of the molecule and the dimensions of the micropore, which results in a significant di erence in the van der Waals interactions. The interaction of the π-bond of the hydrocarbon with the zeolitic proton is of the order of 30 kJ/mol. For Mordenite, a medium-sized pore zeolite, this results in the overall reaction energy scheme presented in Fig. 4.31.
Figure 4.31. Reaction energy diagram for the isomerization of hexene in mordenite. The π-complex denotes hydrogen-bonded alkene whereas the σ-complex denotes the corresponding alkoxy intermediate (schematic).
The solvation of ionic complexes by the zeolite cavity is very limited, hence the protonation of an alkene and also the alkene isomerization require relatively high barriers. The shape of the protonated intermediate, its positive charge distribution, the zeolite microcavity size and shape and the negative charge distribution on the zeolite lattice determine the relative energy of the protonated intermediate. The zeolite lattice has very limited

Shape-Selective Microporous Catalysts, the Zeolites |
199 |
flexibility and, hence, the main additional stabilization derives from the polarization of the oxygen atoms by the positive charge of the protonated reaction intermediate. Clearly, the activation energy for isomerization and the desorption energy are close to being competitive and would be even more competitive for hydrocarbons with longer hydrocarbon chain lengths.
The importance of the entropy of adsorption is illustrated by experimental and calculated adsorption free energies for hexane in the 12-ring one-dimensional channel mordenite (MOR) and 10-ring one-dimensional channel of ferrierite (TON). Table 4.4 compares the simulated values for the heats of adsorption from configurationally biased Monte Carlo calculations valid at low micropore filling. The corresponding adsorption equilibrium constants are also compared in Table 4.4. One notes the increase in the energy of adsorption for the narrow-pore zeolite. However, at the temperature of reaction, the equilibrium adsorption constant is also a factor 10 lower for the narrow-pore zeolite.
Table 4.4. Calculated heats of adsorption and adsorption constants for various hydrocarbons in zeolites with di erent channel dimensions
|
∆Hads |
Kads(T = 513K) |
|
|
kJ/mol |
mmol/g Pa |
|
|
simulation |
simulation |
|
|
|
|
|
n-pentane/TON |
–63.6 |
4.8 |
x 10−6 |
n-pentane/MOR |
–61.5 |
4.8 |
x 10−5 |
n-hexane/TON |
–76.3 |
1.25 |
x 10−5 |
n-hexane/MOR |
–69.5 |
1.25 |
x 10−4 |
The overall result at this temperature is a higher micropore filling in the wide pore material, notwithstanding its lower heat of adsorption. The loss in entropy that the molecules experience when their motion becomes more constrained in the micropore compared to their motion in the gas phase is less in the wide-pore zeolite than in the narrow-pore zeolite. This e ect dominates, and as a result the coverage, θ, is largest in the zeolite in which the reacting molecule experiences the smallest entropy loss compared to the gas phase. Comparing the overall rates of reaction for di erent zeolites, the question arises, which of the two parameters is most sensitive to the pore size dimensions, the free energies of adsorption or the activation free energies of the elementary rate constant of isomerization.
Table 4.5. Results of activity measurements of the hydroisomerization of hexane (temp. = 240 ◦C, pnC6 = 779 Pa)
|
TOF (sec−1) |
Kads,nC6 (Pa−1) |
kisom(sec−1) |
||||||
H-Beta |
5.0 |
x 10−3 |
6.4 |
x 10−5 |
1.7 |
x 10−2 |
|||
H-Mor |
1.1 |
x 10−2 |
3.3 |
x 10−4 |
2.7 |
x 10−2 |
|||
H-ZSM-5 |
4.1 |
x |
10−3 |
3.3 |
x |
10−5 |
2.8 |
x |
10−2 |
H-ZSM-22 |
1.6 |
x |
10−3 |
1.4 |
x |
10−5 |
1.7 |
x |
10−2 |
200 Chapter 4
The results of experimental measurements[48] which were analyzed with expressions analogous to, but more sophisticated than, Eq. (4.2), are presented in Table 4.5. Zeolite β and ZSM-5 contain three-dimensional 10-ring channels. Mordenite has a one-dimensional 12-ring channel. H-ZSM22 has the ferrierite structure with a one-dimensional 10-ring channel. By comparing the overall rate normalized per protonic site (turn over frequency, TOF), one notes the large di erence in overall rate with changes in the pore dimensions. In contrast, the elementary rate constants, kiso, are basically the same.
The large di erence in reactivity of the zeolites arises primarily from the large di erence in micropore occupancy in the di erent zeolites. The large variation in micropore occupancy is deduced from the large di erences in adsorption equilibrium constants shown in Table 4.5. The similarity of the elementary rate constants for isomerization implies that there is little variation in the corresponding activation energies. The overall rate of the reaction is found to be a maximum for the zeolite in which the adsorption concentration of the reactant is a maximum.
For a medium-sized pore zeolite such as mordenite, the match of reactant size and shape with the micropore cavity size and shape is not an optimum since smaller pore sizes would increase the enthalpy of the adsorbed state. The entropy of the adsorbed state in medium-pore zeolite, however, is larger than that found in the smaller pore zeolite. For wider pore zeolites, heats of adsorption are decreased so much that the entropy gain no longer compensates for its decrease. The maximum concentrations of molecules therefore tend to be found in the medium-micropore zeolites.
We have illustrated that for a catalytic reaction in a zeolite to have a maximum rate, the adsorption free energy should be a maximum. Zeolites with medium-sized cavities are preferred over zeolites with small cavities because in the latter entropy loss dominates the gain in enthalpy. This compares with the anti-lock-and-key behavior of some enantiomeric catalytic systems discussed in the final section of Chapter 2. The catalytic systems that have an optimal misfit with their cavity perform the best, again demonstrating that the occupation is maximized while minimizing the entropy loss.
For a monomolecular reaction one deduces from Eq. (4.2) that when θ = 1, the apparent activation energy of the reaction is equal to its intrinsic activation barrier of the elementary reaction step (Eactiso ). Another important result that can be derived from Eq. (4.2), is the behavior of this system at low micropore occupation (θ 1) where the overall rate is linear in pressure. The apparent activation energy under these conditions is
Eactapp = Eactivation + Eads |
(4.5) |
At low site occupancy, the measured apparent activation energy is linear in the heat of adsorption of the hydrocarbon. This agrees with experimental observations. Narbeshuber et al.[49], studied the conversion of di erent linear alkanes all catalyzed by H-ZSM-5. This cracking reaction proceeds via an intermediate carbonium ion, as was discussed in Section 4.2.1. The site occupancy is low and, therefore, Eq. (4.1) applies. The intrinsic activation energy controlled by the proton donation is essentially independent of chain length. Narbeshuber et al.[49] found a linear decrease in the apparent activation barrier with an increase in the chain length of the hydrocarbon. Since the heat of n-alkane adsorption is linear in the chain length, this implies that the apparent activation energy is linear in the adsorption energy. At comparable conversions, the temperature of the reaction decreases with increasing hydrocarbon chain length.

Shape-Selective Microporous Catalysts, the Zeolites |
201 |
The relative independence of the elementary rate constant for proton-activated hydrocarbon conversion reactions carried out in di erent zeolite structures would indicate that the di erences in the overall rate for di erent zeolites are not determined by the small differences in the reactivity of the protons (intrinsic acidity) but rather by a variation in the concentration of reactant molecules adsorbed on the zeolitic reaction centers. The higher apparent reactivity of the longer hydrocarbon chains in zeolite-catalyzed hydrocarbon conversion reactions can be likely ascribed to the increased concentration of hydrocarbon adsorbed at the reactive centers and not to a higher intrinsic reactivity of the hydrocarbon molecules.
A very important concept to consider in designing zeolites for specific activity and/or selectivity is that the zeolite cavities can be considered as nano-size reactors. This view we discussed earlier when we presented the Labinger interpretation[28] of selective oxidation in zeolitic micropores. Hydrocarbon conversion processes also include oligomerization, cracking and aromatization reactions. As a consequence, carbonaceous residues will form even when the reactions are carried out in the presence of hydrogen. The size of the micropore cavities will limit the size of the residue molecules that can form and in this way will suppress coke formation in high-temperature reactions such as catalytic cracking. This dramatically increases the yield of desired alkenens or aromatic molecules and decreases the rate of catalyst deactivation. Interestingly, the precursors for coke formation can catalyze carbon–carbon bond-forming reactions. Such reactions may even overcome the sometimes more di cult direct initial activation reactions catalyzed by the zeolitic protons.
Figure 4.32. Ethyl ethyl ether formation via associative mechanism. Energies in kJ/mol[51].
An interesting example is the conversion of methanol to hydrocarbons catalyzed by the zeolitic SAPO-34 material[50]. This microporous AlPO4-based material has the structure of chabazite. The protonic sites are similar to those in the zeolite, but of slightly less intrinsic acidity because of their embedding in the AlPO4 structure. The formation of a C–C
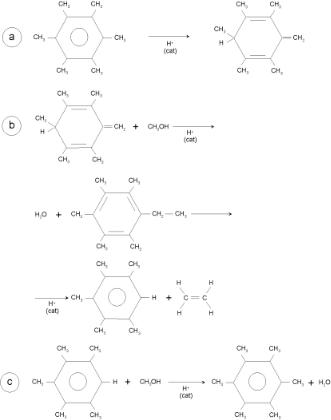
202 Chapter 4
bond directly from two or three methanol molecules activated at the zeolitic proton site is possible, but requires higher temperatures to overcome the larger activation barriers. The most preferred reaction path was predicted based on cluster calculations to involve an associative reaction of a methanol molecule with dimethyl ether (see Fig. 4.32). An activation energy of 270 kJ/mol was predicted for this reaction over small clusters. The formation of ethylene by the decomposition of ethyl methyl ether requires an activation barrier of 140 kJ/mol. Ethylene can then easily oligomerize towards aromatics. The cavities of SAPO-34 are connected through cavity openings too small for aromatic molecules. Hence, when these aromatics are formed by consecutive reaction of ethylene, they will not leave the cavities. When such aromatic intermediates are present in the cavities, the direct ethylene-forming reaction from methanol is replaced by reaction sequences in which hexamethylbenzene and other related methyl-substituted benzenes play important roles. Propylene formation is favored by methylbenzenes with four to six methyl groups but ethylene is the predominant product from those with two or three methyl groups[46]. Smaller micropores favor the latter reaction. The reaction sequence given in Fig. 4.33 is proposed when hexamethylbenzene is the major reaction intermediate.
Figure 4.33. A detailed side-chain reaction route to ethylene.
Shape-Selective Microporous Catalysts, the Zeolites |
203 |
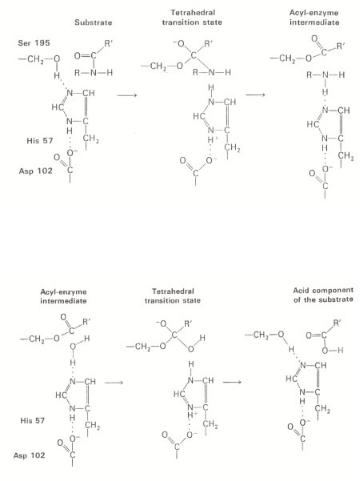
Figure 4.34a. First stage in the hydrolysis of a peptide by chymotrypsin: acylation. A tetrahedral transition state is formed, in which the peptide bond is cleaved. The amine component then rapidly di uses away, leaving an acyl–enzyme intermediate, adapted from L. Stryer[53].
Figure 4.34b. Second stage in the hydrolysis of a peptide by chymotrypsin: deacylation. The acyl–
enzyme intermediate is hydrolyzed by water. Note that deacylation is essentially the reverse of acylation, with water in the role of the amine component of the original substrate, adapted from L. Stryer[53].
The reaction path shown in Fig. 4.33 involves a fascinating sequence of reaction steps, with some similarity to enzyme catalytic steps, but is much less controlled. For example, in the hydrolysis of peptides catalyzed by the chymotrypsin enzyme, the peptide bond ruptures via the intermediate attachment of the acyl functional group to the activating –CH2–OH group of a serine peptide unit, near the catalytically reactive site that is part of the enzyme protein framework. The reaction steps that occur are sketched in Fig. 4.34. The OH group of serine is activated by a nearby imidizole group and proton transfer is stabilized by a negative charge on the carbonyl group of its next-neighboring aspartase unit. The free energies of activation of this reaction sequence are low because of the optimized locations of interacting acid and base groups around the reaction center.
This refinement is absent in the chabazite cavity where the location of the protonic center, negative charge on the zeolite wall and methylated benzene molecule all interact

204 Chapter 4
with one annother. Nonetheless, the combination of protonation, transition-state formation and cleavage and formation of covalent bonds has some similarity to the enzyme-type events.
The presence of reactive aromatic intermediates has also been invoked as catalysts
for other hydrocarbon conversion reactions, such as the isomerization of n-butene to isobutene[54].
A positive e ect of the presence of carbonaceous deposits on the skeletal isomerization of n-butene over a protonic ferrierite zeolite could also be related to a possible reaction mechanism in which the tertiary carbenium ions, which are located in the zeolite pores, act as catalytically active sites. Catalysis was found initially to proceed via oligomerization and cracking reactions.
Figure 4.35. Bimolecular reaction scheme for isobutene formation from n-butene. Formation of intermediate primary carbenium ions is circumvented.
Figure 4.36. Formation of isobutene from n-butene through a tertiary carbon on coke aromatics[54].
As we discussed in Section 4.2.1, monomolecular n-butene to isobutene isomerization requires a relatively high activation energy because isomerization via the propyl cationic intermediate generates a primary carbenium ion in the transition state.
Isomerization initially proceeds through an intermediate bimolecular reaction as shown in Fig. 4.35, where the formation of carbonaceous deposits occurs in parallel. Over the course of time, isobutene results as the only product, but is now produced solely through the monomolecular path. A reaction sequence for the formation of isobutene as shown in Fig. 4.36 occurs at the tertiary carbon of a substituent alkyl group of the aromatic coke. The size of the microcavity inhibits further oligomerization reactions.

Shape-Selective Microporous Catalysts, the Zeolites |
205 |
4.5 Adsorption Equilibria and Catalytic Selectivity
Figure 4.37 illustrates the sensitivity dependence of the molecular product distribution on zeolite micropore dimensions for the cracking of n-C16. The product ratio of branched dimethylbutane (DMB) versus n-C6 is taken as a measure of the selectivity. A maximum in selectivity towards the bulky branched molecule is found for the intermediate pore-size zeolite AFI. This result is curious since one would have expected the wide-pore zeolite Fau to lead to the maximum yield for the more bulky molecule. The di erences from expectation appear to be related again to the adsorption properties of hydrocarbons.
Figure 4.37. Experimental and simulated normalized DMB/n-C6 yield ratios (y) for various zeolite structures at T = 577 K and P = 3000 kPa. The ratios were normalized by setting the value for FAU– type zeolite at one. The catalytic ratios were determined from n–C6 hydroconversion experiments,
the calculated ratios were taken from simulated adsorption isotherms of 2,2–DMB/n–C6 (|−−|) and 2,3–
DMB/n–C6 ( ) or from Henry coe cients (•). The numbers in parentheses are the average pore sizes in ˚angstrom[55].
The adsorption energy of an n-C16 molecule is at least 150 kJ/mol for a wide-pore zeolite and even greater for the smaller pore zeolites. This implies nearly complete filling of the zeolite micropore at the temperature and pressure of the cracking process. At such a high micropore filling, the di usion of molecules becomes inhibited and, hence, becomes the rate-limiting step. Molecules in the micropore have a long residence time, thus allowing the product molecules to equilibrate in the micropore. The product distribution therefore reflects the di erences in free energies of the adsorbed product molecules at high micropore filling. Three e ects appear to play a role[55]:
–At high pore fillings the adsorption of small molecules is preferred over large molecules owing to entropic considerations[56].
–Linear molecules tend to stretch in narrow pores. This makes them larger and, hence at high pore filling their adsorption is suppressed compared with adsorption of smaller molecules.
–In small micropores the adsorption of branched molecules is suppressed.
The observed optimum in selectivity for the branched product relates strongly to the change in shape of the linear molecule and its larger e ective volume at intermediate micropore sizes. In an analogous fashion, the di erent responses observed between the MFI