

Molecular Sieves - Science and Technology - Vol. 6 - Characterization II / 06-Isomorphous Substitution in Zeolites
.pdfIsomorphous Substitution in Zeolites |
435 |
Table 22 Chemical analysis, morphology and crystal dimensions of MFI, MTW and TON zeolites
Sample |
Zeolite |
Si/Fegel |
Si/Fezeolite |
C7 |
MTW |
200 |
210.7 |
C1 |
MTW |
100 |
102.5 |
C3 |
MTW |
50 |
47.4 |
C5 |
MTW |
33.3 |
31.5 |
D2 |
TON |
100 |
132.0 |
D3 |
TON |
66.6 |
67.6 |
D4 |
TON |
33.3 |
35.4 |
D5 |
TON |
25 |
27.2 |
|
|
|
|
zeolite samples. The results of the sample characterizations are reported in Table 22. It can be observed that for the two zeolite types the incorporation of iron is related to its content in the starting hydrogel. Hence, with this preparation procedure it is possible to incorporate different amounts of iron related to the initial reaction mixture. The only limitation in the incorporation is the range of the Si/Fe ratio that each type of zeolite is able to accommodate in its framework as described in the comments of Table 21. The differences between the three zeolite types are also in the morphology and in the crystal size. The [Fe]-MFI crystals show spherical morphology with inhomogeneous crystal size distribution varying from 2 to 20 µm. The [Fe]-MTW samples present rice-like shape morphology with a length of about 1.6 µm and a width of about 1 µm, and finally, the [Fe]-TON-type crystals show needle agglomerates with a linear dimension smaller than 1 µm. In all cases the iron zeolites present morphologies similar to those of the corresponding Al forms.
3.8 [Fe,Al]-MCM-22
The X-ray powder diffraction shows clearly that the as-synthesized solid has the structure of MCM-22 zeolite (Fig. 28). Tables 23 and 24 show the comparison between the line positions and the relative intensities for the sample [Fe,Al]-MCM-22 and the literature data [253]. Before calcination most lines are broad and overlap. The calcined [Fe,Al]-MCM-22 sample also shows the characteristics of calcined MCM-22 [256] (Fig. 28 and Tables 23 and 24).
SEM photographs of the as-synthesized [Fe,Al]-MCM-22 samples 2, 3 and 5 are shown in Fig. 29. They are very similar to those reported for the MCM-22 samples [254, 255]. The thin platelets of ca. 1–2 µm diameter frequently form spherical aggregates of ca. 10–15 µm, and the morphology does not depend on the Fe content. Calcination of the samples did not affect the morphology of the crystals.

436 |
J. B.Nagy et al. |
Fig. 28 XRD patterns of the as-made [Fe,Al]-MCM-22 sample 3 and of the calcined [Fe]- MCM-22 sample 5
Table 23 Comparison between X-ray powder diffraction patterns of as-made sample 3 and precursor MCM-22
As-made |
|
MCM-22 a |
|
d(hkl) |
Irel |
d(hkl) |
Irel |
13.63 |
57.6 |
13.53 |
36 |
12.51 |
70.9 |
12.38 |
100 |
11.30 |
51.9 |
11.13 |
34 |
9.17 |
48.4 |
9.14 |
20 |
6.94 |
34.7 |
6.89 |
6 |
6.76 |
29.7 |
6.68 |
4 |
6.08 |
28.3 |
6.02 |
5 |
4.44 |
53.5 |
4.47 |
22 |
4.08 |
57.4 |
4.05 |
19 |
3.95 |
58.8 |
3.95 |
21 |
3.79 |
48.0 |
3.77 |
13 |
3.58 |
48.2 |
3.57 |
20 |
3.44 |
100 |
3.43 |
55 |
3.39 |
53.8 |
3.36 |
23 |
3.07 |
31.2 |
3.06 |
4 |
2.69 |
29.8 |
2.68 |
5 |
2.38 |
29.7 |
2.38 |
5 |
2.34 |
27.3 |
— |
— |
a From [160]

Isomorphous Substitution in Zeolites |
437 |
Table 24 Comparison between X-ray powder diffraction patterns of calcined sample 5 and calcined MCM-22
Calcined |
|
MCM-22 calcined a |
|
d(hkl) |
Irel |
d(hkl) |
Irel |
12.34 |
71.0 |
12.34 |
100 |
11.07 |
50.3 |
11.02 |
51 |
8.85 |
58.5 |
8.90 |
46 |
6.16 |
55.8 |
6.17 |
35 |
5.54 |
37.7 |
5.55 |
13 |
4.38 |
36.5 |
4.38 |
10 |
4.10 |
39.9 |
4.11 |
10 |
4.05 |
47.6 |
4.06 |
20 |
3.91 |
61.3 |
3.82 |
29 |
3.75 |
45.9 |
3.75 |
15 |
3.56 |
40.4 |
3.56 |
14 |
3.42 |
100 |
3.42 |
61 |
3.30 |
43.6 |
3.30 |
13 |
3.21 |
40.5 |
3.21 |
9 |
3.06 |
28.2 |
3.12 |
6 |
2.68 |
28.4 |
2.68 |
6 |
2.37 |
26.4 |
2.37 |
4 |
2.34 |
25.2 |
— |
— |
a From [160]
Fig. 29 Scanning electron micrographs of [Fe, Al]-MCM-22 samples 2 (a) and 3 (b) and of [Fe]-MCM-22 sample 5 (c)
The iron content, aluminum and sodium determined by atomic absorption and the content of the organic molecule trapped in the zeolite channels determined by thermogravimetric analysis are reported in Table 25.
The values are expressed in moles per 100 g of activated samples, i.e., the sample from which the water and the organic molecules were removed. The sum of iron and aluminum incorporated into the MCM-22 structure is quite constant and the Fe/Al ratio is always larger than in the reaction mixture (4.6, 1.3 and 0.5 for samples 2, 3 and 4, respectively). The sodium content is

438
Table 25 Chemical analysis of the as-made [Fe,Al]-MCM-22 and [Fe]-MCM-22 samples a,b and ion exchange capacities of the corresponding calcined samples
Sample |
Fe a |
Al a |
Si/ |
Na a |
K/ |
Fetetr |
HMI b |
DSC peaks |
HMI b |
|
[×102 mol%] |
[×102 mol%] |
Al+Fe |
[×102 mol%] |
Al+Fe |
[%] |
[×102 mol%] |
(◦ C) |
[×102 mol%] |
1 |
7.8 |
— |
19.9 |
0.28 |
0.40 |
40 |
19 |
377.6 |
8 |
|
|
|
|
|
|
|
|
466.3 |
11 |
2 |
7.4 |
1.6 |
17.1 |
0.56 |
0.48 |
36 |
20 |
384.1 |
10 |
|
|
|
|
|
|
|
|
479.4 |
10 |
3 |
5.3 |
4.1 |
16.4 |
0.91 |
0.71 |
49 |
20 |
385.7 |
9 |
|
|
|
|
|
|
|
|
490.8 |
11 |
4 |
3.5 |
6.3 |
15.8 |
0.30 |
0.83 |
80 |
20 |
384.4 |
11 |
|
|
|
|
|
|
|
|
502.8 |
9 |
5 |
9.3 |
— |
16.5 |
0.69 |
0 |
0 |
20 |
376.7 |
8 |
|
|
|
|
|
|
|
|
464.6 |
12 |
a Atomic absorption spectroscopy b Thermal gravimetry
.al et Nagy.B .J
Isomorphous Substitution in Zeolites |
439 |
very low compared to the trivalent atom content. The amount of HMI is equal to 0.20 mol % and is not dependent on the trivalent atoms in the structure. As the amount of (Fe + Al) is equal to ca. 0.09 mol % and the Na amount is much smaller than this value (it varies from 0.003 to 0.009 mol %) (Table 25), some 0.081 mol % of protonated HMI has to neutralize the framework negative charges linked to both Al and Fe (see below).
The two different HMI species cannot be shown by the 13C NMR spectrum, because it is not well resolved due to the presence of the paramagnetic Fe(III) in the framework. Note that only the 13C NMR spectrum of sample 4 containing a low amount of Fe could be measured. The Al atoms are well introduced into the structure in a tetrahedral form. Indeed, the chemical shift of 54 ppm characterizes tetrahedral species of Al(OSi)4 configuration (Table 26). It is not possible to detect different Al species in the structure, as was the case for MCM-22 zeolite [256, 257], because of the line broadening due to the Fe(III) species, although some asymmetry can be recognized in the spectra.
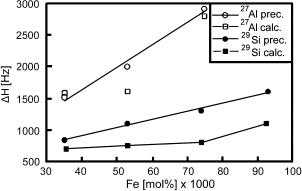
The 27Al NMR linewidth increases with increasing Fe(III) content in the samples (Fig. 30). The linewidths do not differ very much for the calcined samples (Table 26). However, for samples 2 and 3 with higher Fe contents a new broad NMR line appears at ca. 30 ppm, which could be either due to extra-framework Al species (very much broadened due to extra-framework Fe species), or due to deformed Al species in the structure. Work is in progress to identify the various Al species in the [Fe]-MCM-22 samples. While the Fe/u.c. value increases from 1.7 to 4.5, that of Al/u.c. decreases from 3.0 to 0.8 and their sum remains constant for the different samples. This means that the Fe species and the Al species are in competition and the introduction of a total of 4.3 = (Fe + Al)/u.c. is favored under our reaction conditions.
Fig. 30 Variation of the 27Al and 29Si NMR linewidths as a function of Fe content of the [Fe,Al]-MCM-22 samples

440 |
J. B.Nagy et al. |
Table 26 27Al NMR data of precursor [Fe]-MCM-22 samples (a) and calcined [Fe]-MCM- 22 samples (b)
|
(a) |
|
(b) |
|
Sample |
δ [ppm] |
∆H [Hz] |
δ [ppm] |
∆H [Hz] |
|
|
|
|
|
1 |
— |
— |
— |
— |
2 |
54 |
2930 |
55.6 ( 30) |
2800 (7000) |
3 |
53.4 |
2000 |
55.6 ( 30) |
1600 (7000) |
4 |
55.0 |
1520 |
55.0 |
1550 |
5 |
— |
— |
— |
— |
|
|
|
|
|
EPR results were used to characterize the Fe species in the zeolite samples. One typical spectrum (sample 3) is recorded in Fig. 31, and Table 27 shows the g values of the various Fe-containing species. Despite the great importance of the EPR technique in characterizing the various paramagnetic species, no clear-cut interpretation has been given until now. For example, species characterized by a g factor of 2.0 are considered octahedral [258, 259], while such species are described as tetrahedral framework species in [260]. The signal at g = 2.3 is considered as the g|| contribution of the octahedral species [258, 259]. Finally, at g = 4.3 can be found the tetrahedral framework species, the intensity of which is higher at low temperatures [259]. This
Fig. 31 Room temperature EPR spectrum of as-made [Fe,Al]-MCM-22 sample 3
Table 27 EPR results of as-made [Fe,Al]-MCM-22 zeolite samples taken at room temperature
Sample |
g values |
|
|
|
|
|
|
1 |
4.263 |
2.307 |
1.985 |
2 |
4.559 |
2.440 |
2.017 |
3 |
4.497 |
2.449 |
2.011 |
4 |
4.381 |
2.437 |
2.012 |
5 |
4.446 |
2.451 |
2.169 |
|
|
|
|

Isomorphous Substitution in Zeolites |
441 |
species can be included in the EPR signal observed at low magnetic field, where only the middle of the spectrum was computed to be between 4.23 and 4.56. The latter species are considered as deformed tetrahedral species. However, the correct interpretation is the one given above for the [Fe]-MFI samples. That way, the iron species with g ≈ 2.0 is attributed to tetrahedral framework iron, and the g ≈ 4.3 value is characteristic of iron in rhombic configuration. The Mössbauer spectra of the as-made [Fe]-MCM-22 samples confirm the presence of tetrahedral Fe(III) ions. The spectra of samples 1 and 5 were decomposed by attempting to use two doublets, one for the tetrahedral configuration of Fe and one for the octahedral configuration. The isomer shift of tetrahedrally coordinated Fe(III) is equal to 0.18 mm s–1 for both samples. Octahedrally coordinated Fe(III) is detected in sample 5 and is characterized by higher isomer shift (0.32 mm s–1) and quadrupolar splitting (0.93 mm s–1). These values are in good agreement with those reported in the first genuine publication by Meagher et al. [261] and later confirmed by others [262, 263]. It is interesting to note that despite the brownish color of sample 5, the amount of tetrahedral Fe(III) is still high (some 87%).
3.9 [Co]-MFI
Figure 32 illustrates the XRD patterns of three samples (see Table 28) [196, 197]. It can be seen that sample 1 shows a well-crystallized MFI structure
Fig. 32 XRD patterns of samples Nos. 1, 8 and 17 (see Table 28)

442 |
J. B.Nagy et al. |
Table 28 |
Chemical composition of the as-made Co-containing MFI samples. a) Sam- |
ples obtained from gels A of composition 35SiO2 – xNa2O – yCo(CH3COO)2 – 3.4TPABr – 8.4H2 OSO4 – 808H2 O at 170 ◦C after two days of synthesis. b) Samples obtained from gels B of composition: 35SiO2 – Co(CH3COO)2 – xNa2O – 3.4TPABr – 808H2 O at 170 ◦ C after two days of synthesis
No |
x |
y |
Co/u.c. |
Na/u.c. |
H2O/u.c. TPA/u.c. |
TPA/u.c. – T [◦C] |
|||
|
|
|
|
|
|
|
|
LT a |
HT b |
|
|
|
|
|
|
|
|
|
|
a) |
|
|
|
|
|
|
|
|
|
|
1 |
11 |
0.5 |
2.7 |
8.3 |
0 |
3.6 |
1.8–402 |
1.8–456 |
|
3 |
11 |
1.5 |
5.0 |
18.7 |
3.5 |
3.7 |
2.0–398 |
1.7–468 |
|
5 |
12.9 |
0.5 |
6.3 |
12.9 |
3.5 |
4.0 |
2.1–407 |
1.9–456 |
|
8 |
12.9 |
2 |
12.7 |
16.5 |
7.0 |
3.4 |
1.8–398 |
1.6–456 |
|
9 |
15 |
0.5 |
7.0 |
18.3 |
3.0 |
3.7 |
3.7–406 (450 c ) |
|
12 |
15 |
2 |
10 |
15.6 |
8.3 |
3.1 |
3.1–406 (450 c ) |
||
b) |
|
|
|
|
|
|
|
|
|
14 |
3 |
|
2.7 |
4.3 |
5 |
4.2 |
1.9–404 |
2.3–438 |
|
15 |
6 |
|
5.6 |
10 |
10.8 |
3.8 |
1.8–406 |
2.0–459 |
|
16 |
9 |
|
7.2 |
8.4 |
11.2 |
4.0 |
1.7–410 |
2.3–459 |
|
17 |
12 |
|
6.7 |
8.4 |
11.4 |
3.6 |
3.6–451 |
||
|
|
|
|
|
|
|
|||
a |
LT: low temperature peak; |
|
|
|
|
|
|||
b |
HT: high temperature peak; |
|
|
|
|
|
|||
c |
shoulder |
|
|
|
|
|
|
|
|
of orthorhombic symmetry, while sample 8 shows the presence of some amorphous phase as well. In the first series A, where the [Co]-MFI samples were obtained from a sodium silicate source, the crystallinity of the samples decreases both with the increase of alkalinity (x) and the Co-content (y) in the gel. The decrease in crystallinity with increasing alkalinity is also observed in series B, where colloidal silica was used as a silica source.
Note that high alkalinity is required for the [Co]-ZSM-5 synthesis. Indeed, when no NaOH was added to the reaction mixture, no crystalline material was obtained after 2 days of synthesis. In addition, the initial gel was pink showing the presence of octahedrally coordinated Co, while for the gels prepared with high Na2O content, the gels were all blue having the characteristic color of Co(OH)–4 ions. The chemical analysis by atomic absorption spectroscopy (AAS) yielded the values of Co/u.c. and Na/u.c., while thermal analysis led to the TPA/u.c. and H2O/u.c. values (Table 28). The Co/u.c. values are rather high and suggest that the larger part of the cobalt is in extraframework positions. These values increase with increasing Co-content of the gel, and they also increase with increasing alkalinity (Table 28a and b). The Na/u.c. values are also rather high and suggest that most of the Co(II) ions are in extra-framework species. The H2O/u.c. varies in a random manner and does not seem to be linked to any Co/u.c. or Na/u.c. variation. The DSC

Isomorphous Substitution in Zeolites |
443 |
Fig. 33 DSC curves of samples Nos. 1, 8, and 17 (see Table 28)
results are very revealing with respect to the possible incorporation of Co into the tetrahedral framework. Figure 33 illustrates the DSC curves of three samples. When the framework Co content is low (sample 1), two peaks characterize the decomposition of the occluded TPA+ ions: the low temperature peak (LT) at ca. 400 ◦C and the high temperature peak (HT) at ca. 455 ◦C. The temperature of decomposition is not influenced by the formal Co/u.c. values. The TPA/u.c. does not vary much as a function of Co/u.c. and is close to an average value of 3.7/u.c. Approximately half of it is decomposed at low temperature and the other half at high temperature. Only at high Co content (samples No. 8 and 12), there is some decrease in the TPA/u.c. values suggesting the incorporation of some of Co into the samples. At high alkalinities of the samples of series B (No. 17), only the high temperature peak is detected, suggesting again that some of the Co could be incorporated into the structure. Indeed, this behavior of the TPA+ ions was observed previously in the [Al]- ZSM-5 [226, 265], B-ZSM-5 (Testa F, Chiappetta R, Crea F, Aiello R, Fonseca A, Bertrand JC, Demortier G, Guth JL, Delmotte L, B.Nagy J, submitted for publication) and [Fe]-ZSM-5 [266] samples. Diffuse reflectance (DR) spectroscopy of Co2+ permits the observation of d–d transitions in the near infrared and visible region and charge transfer (CT) transitions in the ultraviolet region. Co2+ is the only common d7 ion, and because of its stereochemistry the respective spectra have been extensively studied [267]. The two representative cases: Co2+ ion in octahedral (Oh) and tetrahedral (Th) [267] crystal field can be interpreted in the same way as the octahedral d2 ion (e.g., V3+) and octahedral d3 ion (e.g., Cr3+), respectively. (The corresponding Tanabe-Sugano diagrams can be seen in [267]). As all d–d transitions for octahedral complexes possessing a symmetry center are symmetry-forbidden, these bands are exceptionally weak in the spectra. Thus, the DR spectra of zeolites, in particular
444 |
J. B.Nagy et al. |
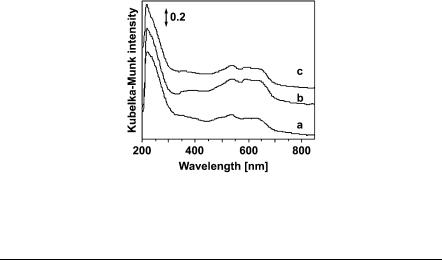
ZSM-5 zeolites, with framework (FW) and extra-framework (EFW) Co2+ content are dominated by intense O2– → Co2+ charge transfer transitions, characteristic essentially of Co2+ in Th coordination around 200–230 nm; the most intense Th transition, ν3 [corresponding to 4A2(e4t32) → 4T1(P)], appears around 590–630 nm and a weaker one, ν2, already in the near infrared (1400–1500 nm).
(The third d–d transition, ν1, is also in the infrared region [2000–3300 nm], but its examination is hindered due to overlapping vibrational bands). Even though the Th d–d transitions are symmetryand spin-allowed (no center of symmetry and ∆S = 0), the most intense ν3 band in the visible region always appears as a broad band split into three components due to symmetry perturbations, spin-orbit coupling and other reasons. Figure 34 exhibits in the 460–700 nm visible region (from blue to red) at least four poorly resolved bands (at 486, 530, 584 and 643 nm), of which the last three are Th d–d transitions. This triplet is indicative of high-spin (d7) Co2+ in a tetrahedral crystal field. The weak 486 nm band is caused by the most intense ν3 transition of high-spin Co2+ in octahedral coordination. The nearly invisible 357 nm band is supposed to be due to high-spin Co3+ in unknown coordination [268].
Fig. 34 Diffuse reflectance UV-Vis spectra of samples Nos. 1 (a), 5 (b) and 9 (c) recorded at a resolution of 2 nm (see Table 28)
Table 29 Visible diffuse reflectance spectra of selected as-made [Co]-ZSM-5 samples
|
Band intensities [a.u.] |
|
|
Sample |
480 nm |
530 + 590 + 640 nm |
340 nm |
|
Co octahedral |
Co tetrahedral |
Co(III) |
|
|
|
|
1 |
11 |
21 |
25 |
5 |
12 |
35 |
16 |
9 |
13 |
22 |
17 |
|
|
|
|