668—Chapter 37. Panel Estimation
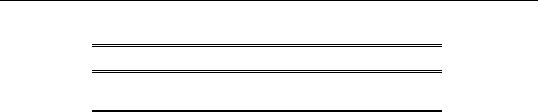
Effects Specification
Cross-section fixed (first differences)
Period fixed (dummy variables)
Mean dependent var |
-0.063168 |
S.D. dependent var |
0.137637 |
S.E. of regression |
0.116243 |
Sum squared resid |
8.080432 |
J-statistic |
30.11247 |
Instrument rank |
38.000000 |
|
|
|
|
|
|
|
|
Note in particular the results labeled “J-statistic” and “Instrument rank”. Since the reported J-statistic is simply the Sargan statistic (value of the GMM objective function at estimated parameters), and the instrument rank of 38 is greater than the number of estimated coefficients (13), we may use it to construct the Sargan test of over-identifying restrictions. It is worth noting here that the J-statistic reported by a panel equation differs from that reported by an ordinary equation by a factor equal to the number of observations. Under the null hypothesis that the over-identifying restrictions are valid, the Sargan statistic is distributed as a x(p – k), where k is the number of estimated coefficients and p is the instrument rank. The p-value of 0.22 in this example may be computed using “scalar pval = @chisq(30.11247, 25)”.
Panel Equation Testing
Omitted Variables Test
You may perform an F-test of the joint significance of variables that are presently omitted from a panel or pool equation estimated by list. Select View/Coefficient Diagnostics/Omitted Variables - Likelihood Ratio... and in the resulting dialog, enter the names of the variables you wish to add to the default specification. If estimating in a pool setting, you should enter the desired pool or ordinary series in the appropriate edit box (common, cross-section specific, period specific).
When you click on OK, EViews will first estimate the unrestricted specification, then form the usual F-test, and will display both the test results as well as the results from the unrestricted specification in the equation or pool window.
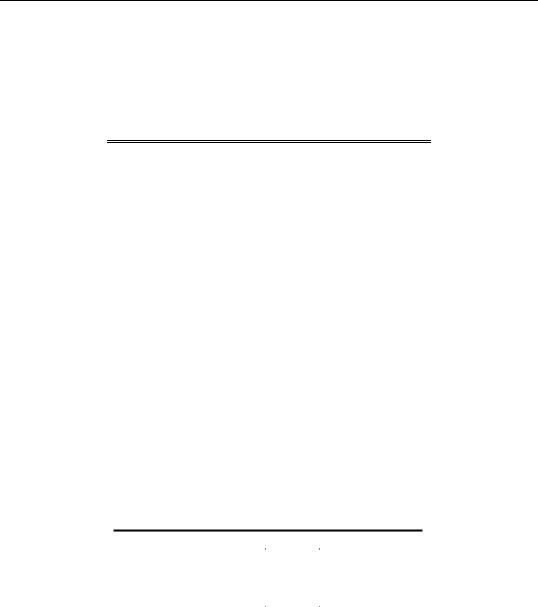
Adapting Example 10.6 from Wooldridge (2002, p. 282) slightly, we may first estimate a pooled sample equation for a model of the effect of job training grants on LSCRAP using first differencing. The restricted set of explanatory variables includes a constant and D89. The results from the restricted estimator are given by:
Panel Equation Testing—669
Dependent Variable: D(LSCRAP)
Method: Panel Least Squares
Date: 08/24/06 Time: 14:29
Sample (adjusted): 1988 1989
Periods included: 2
Cross-sections included: 54
Total panel (balanced) observations: 108
|
Coefficient |
Std. Error |
t-Statistic |
Prob. |
|
|
|
|
|
|
|
|
|
|
C |
-0.168993 |
0.078872 |
-2.142622 |
0.0344 |
D89 |
-0.104279 |
0.111542 |
-0.934881 |
0.3520 |
|
|
|
|
|
|
|
|
R-squared |
0.008178 |
Mean dependent var |
-0.221132 |
Adjusted R-squared |
-0.001179 |
S.D. dependent var |
0.579248 |
S.E. of regression |
0.579589 |
Akaike info criterion |
1.765351 |
Sum squared resid |
35.60793 |
Schwarz criterion |
1.815020 |
Log likelihood |
-93.32896 |
Hannan-Quinn criter. |
1.785490 |
F-statistic |
0.874003 |
Durbin-Watson stat |
1.445487 |
Prob(F-statistic) |
0.351974 |
|
|
|
|
|
|
|
|
|
|
|
|
|
We wish to test the significance of the first differences of the omitted job training grant variables GRANT and GRANT_1. Click on View/Coefficient Diagnostics/Omitted Variables - Likelihood Ratio... and type “D(GRANT)” and “D(GRANT_1)” to enter the two variables in differences. Click on OK to display the omitted variables test results.
The top portion of the results contains a brief description of the test, the test statistic values, and the associated significance levels:
Omitted Variables Test
Equation: UNTITLED
Specification: D(LSCRAP) C D89
Omitted Variables: GRANT GRANT_1
|
Value |
df |
Probability |
|
F-statistic |
1.529525 |
(2, 104) |
0.2215 |
|
Likelihood ratio |
3.130883 |
2 |
0.2090 |
|
Here, the test statistics do not reject, at conventional significance levels, the null hypothesis that D(GRANT) and D(GRANT_1) are jointly irrelevant.
The remainder of the results shows summary information and the test equation estimated under the unrestricted alternative:
670—Chapter 37. Panel Estimation
F-test summary:
|
|
|
Mean |
|
|
Sum of Sq. |
df |
Squares |
|
Test SSR |
1.017443 |
2 |
0.508721 |
|
Restricted SSR |
35.60793 |
106 |
0.335924 |
|
Unrestricted SSR |
34.59049 |
104 |
0.332601 |
|
Unrestricted SSR |
34.59049 |
104 |
0.332601 |
|
|
|
|
|
|
|
|
|
|
|
LR test summary: |
|
|
|
|
|
Value |
df |
|
|
Restricted LogL |
-93.32896 |
106 |
|
|
Unrestricted LogL |
-91.76352 |
104 |
|
|
|
|
|
|
|
|
|
|
|
|
Note that if appropriate, the alternative specification will be estimated using the cross-sec- tion or period GLS weights obtained from the restricted specification. If these weights were not saved with the restricted specification and are not available, you may first be asked to reestimate the original specification.
Redundant Variables Test
You may perform an F-test of the joint significance of variables that are presently included in a panel or pool equation estimated by list. Select View/Coefficient Diagnostics/Redundant Variables - Likelihood Ratio... and in the resulting dialog, enter the names of the variables in the current specification that you wish to remove in the restricted model.
When you click on OK, EViews will estimate the restricted specification, form the usual F- test, and will display the test results and restricted estimates. Note that if appropriate, the alternative specification will be estimated using the cross-section or period GLS weights obtained from the unrestricted specification. If these weights were not saved with the specification and are not available, you may first be asked to reestimate the original specification.
To illustrate the redundant variables test, consider Example 10.4 from Wooldridge (2002, p. 262), where we test for the redundancy of GRANT and GRANT_1 in a specification estimated with cross-section random effects. The top portion of the unrestricted specification is given by:
Panel Equation Testing—671
.
Dependent Variable: LSCRAP
Method: Panel EGLS (Cross-section random effects)
Date: 11/24/04 Time: 11:25
Sample: 1987 1989
Cross-sections included: 54
Total panel (balanced) observations: 162
Swamy and Arora estimator of component variances
Variable |
Coefficient |
Std. Error |
t-Statistic |
Prob. |
|
|
|
|
|
|
|
|
|
|
C |
0.414833 |
0.242965 |
1.707379 |
0.0897 |
D88 |
-0.093452 |
0.108946 |
-0.857779 |
0.3923 |
D89 |
-0.269834 |
0.131397 |
-2.053577 |
0.0417 |
UNION |
0.547802 |
0.409837 |
1.336635 |
0.1833 |
GRANT |
-0.214696 |
0.147500 |
-1.455565 |
0.1475 |
GRANT_1 |
-0.377070 |
0.204957 |
-1.839747 |
0.0677 |
|
|
|
|
|
|
|
|
|
Effects Specification |
|
|
|
|
|
S.D. |
Rho |
|
|
|
|
|
|
|
|
|
|
Cross-section random |
|
|
1.390029 |
0.8863 |
Idiosyncratic random |
|
|
0.497744 |
0.1137 |
|
|
|
|
|
|
|
|
|
|
Note in particular that our unrestricted model is a random effects specification using Swamy and Arora estimators for the component variances, and that the estimates of the cross-sec- tion and idiosyncratic random effects standard deviations are 1.390 and 0.4978, respectively.
If we select the redundant variables test, and perform a joint test on GRANT and GRANT_1, EViews displays the test results in the top of the results window:
Redundant Variables Test
Equation: UNTITLED
Specification: LSCRAP C D88 D89 UNION GRANT GRANT_1
Redundant Variables: GRANT GRANT_1
|
Value |
df |
Probability |
|
F-statistic |
1.832264 |
(2, 156) |
0.1635 |
|
|
|
|
|
|
|
|
|
|
|
F-test summary: |
|
|
Mean |
|
|
|
|
|
|
Sum of Sq. |
df |
Squares |
|
Test SSR |
0.911380 |
2 |
0.455690 |
|
Restricted SSR |
39.70907 |
158 |
0.251323 |
|
Unrestricted SSR |
38.79769 |
156 |
0.248703 |
|
Unrestricted SSR |
38.79769 |
156 |
0.248703 |
|
|
|
|
|
|
|
|
|
|
|
672—Chapter 37. Panel Estimation
Here we see that the statistic value of 1.832 does not, at conventional significance levels, lead us to reject the null hypothesis that GRANT and GRANT_1 are redundant in the unrestricted specification.
The restricted test equation results are depicted in the bottom portion of the window. Here we see the top portion of the results for the restricted equation:
Restricted Test Equation:
Dependent Variable: LSCRAP
Method: Panel EGLS (Cross-section random effects)
Date: 08/18/09 Time: 12:39
Sample: 1987 1989
Periods included: 3
Cross-sections included: 54
Total panel (balanced) observations: 162
Use pre-specified random component estimates
Swamy and Arora estimator of component variances
Variable |
Coefficient |
Std. Error |
t-Statistic |
Prob. |
|
|
|
|
|
|
|
|
|
|
C |
0.419327 |
0.242949 |
1.725987 |
0.0863 |
D88 |
-0.168993 |
0.095791 |
-1.764187 |
0.0796 |
D89 |
-0.442265 |
0.095791 |
-4.616981 |
0.0000 |
UNION |
0.534321 |
0.409752 |
1.304010 |
0.1941 |
|
|
|
|
|
|
|
|
|
Effects Specification |
S.D. |
Rho |
|
|
|
|
|
|
|
|
|
|
|
|
|
Cross-section random |
|
|
1.390029 |
0.8863 |
Idiosyncratic random |
|
|
0.497744 |
0.1137 |
|
|
|
|
|
|
|
|
|
|
The important thing to note is that the restricted specification removes the test variables GRANT and GRANT_1. Note further that the output indicates that we are using existing estimates of the random component variances (“Use pre-specified random component estimates”), and that the displayed results for the effects match those for the unrestricted specification.
Fixed Effects Testing
EViews provides built-in tools for testing the joint significance of the fixed effects estimates in least squares specifications. To test the significance of your effects you must first estimate the unrestricted specification that includes the effects of interest. Next, select View/Fixed/ Random Effects Testing/Redundant Fixed Effects – Likelihood Ratio. EViews will estimate the appropriate restricted specifications, and will display the test output as well as the results for the restricted specifications.
Note that where the unrestricted specification is a two-way fixed effects estimator, EViews will test the joint significance of all of the effects as well as the joint significance of the cross-section effects and the period effects separately.
Panel Equation Testing—673
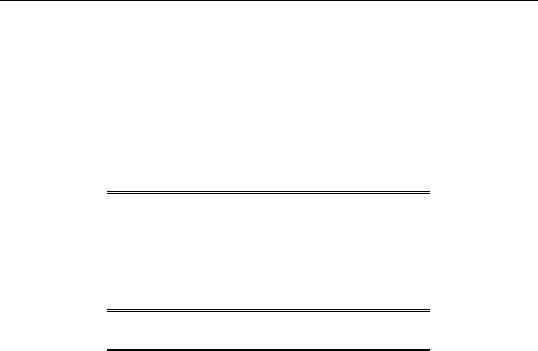
Let us consider Example 3.6.2 in Baltagi (2005), in which we estimate a two-way fixed effects model using data in “Gasoline.WF1”. The results for the unrestricted estimated gasoline demand equation are given by:
Dependent Variable: LGASPCAR
Method: Panel Least Squares
Date: 08/24/06 Time: 15:32
Sample: 1960 1978
Periods included: 19
Cross-sections included: 18
Total panel (balanced) observations: 342
|
Coefficient |
Std. Error |
t-Statistic |
Prob. |
|
|
|
|
|
|
|
|
|
|
C |
-0.855103 |
0.385169 |
-2.220073 |
0.0272 |
LINCOMEP |
0.051369 |
0.091386 |
0.562103 |
0.5745 |
LRPMG |
-0.192850 |
0.042860 |
-4.499545 |
0.0000 |
LCARPCAP |
-0.593448 |
0.027669 |
-21.44787 |
0.0000 |
|
|
|
|
|
|
|
|
|
|
Effects Specification
Cross-section fixed (dummy variables)
Period fixed (dummy variables)
R-squared |
0.980564 |
Mean dependent var |
4.296242 |
Adjusted R-squared |
0.978126 |
S.D. dependent var |
0.548907 |
S.E. of regression |
0.081183 |
Akaike info criterion |
-2.077237 |
Sum squared resid |
1.996961 |
Schwarz criterion |
-1.639934 |
Log likelihood |
394.2075 |
Hannan-Quinn criter. |
-1.903027 |
F-statistic |
402.2697 |
Durbin-Watson stat |
0.348394 |
Prob(F-statistic) |
0.000000 |
|
|
|
|
|
|
|
|
|
|
Note that the specification has both cross-section and period fixed effects. When you select the fixed effect test from the equation menu, EViews estimates three restricted specifications: one with period fixed effects only, one with cross-section fixed effects only, and one with only a common intercept. The test results are displayed at the top of the results window:
674—Chapter 37. Panel Estimation
Redundant Fixed Effects Tests
Equation: Untitled
Test cross-section and period fixed effects
Effects Test |
Statistic |
d.f. |
Prob. |
|
|
|
|
|
|
|
|
Cross-section F |
113.351303 |
(17,303) |
0.0000 |
Cross-section Chi-square |
682.635958 |
17 |
0.0000 |
Period F |
6.233849 |
(18,303) |
0.0000 |
Period Chi-square |
107.747064 |
18 |
0.0000 |
Cross-Section/Period F |
55.955615 |
(35,303) |
0.0000 |
Cross-Section/Period Chi-square |
687.429282 |
35 |
0.0000 |
|
|
|
|
|
|
|
|
Notice that there are three sets of tests. The first set consists of two tests (“Cross-section F” and “Cross-section Chi-square”) that evaluate the joint significance of the cross-section effects using sums-of-squares (F-test) and the likelihood function (Chi-square test). The corresponding restricted specification is one in which there are period effects only. The two statistic values (113.35 and 682.64) and the associated p-values strongly reject the null that the cross-section effects are redundant.
The next two tests evaluate the significance of the period dummies in the unrestricted model against a restricted specification in which there are cross-section effects only. Both forms of the statistic strongly reject the null of no period effects.
The remaining results evaluate the joint significance of all of the effects, respectively. Both of the test statistics reject the restricted model in which there is only a single intercept.
Below the test statistic results, EViews displays the results for the test equations. In this example, there are three distinct restricted equations so EViews shows three sets of estimates.
Lastly, note that this test statistic is not currently available for instrumental variables and GMM specifications.
Hausman Test for Correlated Random Effects
A central assumption in random effects estimation is the assumption that the random effects are uncorrelated with the explanatory variables. One common method for testing this assumption is to employ a Hausman (1978) test to compare the fixed and random effects estimates of coefficients (for discussion see, for example Wooldridge (2002, p. 288), and Baltagi (2005, p. 66)).
To perform the Hausman test, you must first estimate a model with your random effects specification. Next, select View/Fixed/Random Effects Testing/Correlated Random Effects - Hausman Test. EViews will automatically estimate the corresponding fixed effects specifications, compute the test statistics, and display the results and auxiliary equations.

Panel Equation Testing—675
For example, Baltagi (2005) considers an example of Hausman testing (Example 1, p. 70), in which the results for a Swamy-Arora random effects estimator for the Grunfeld data (“Grunfeld_baltagi_panel.WF1”) are compared with those obtained from the corresponding fixed effects estimator. To perform this test we must first estimate a random effects estimator, obtaining the results:
Dependent Variable: I
Method: Panel EGLS (Cross-section random effects)
Date: 08/18/09 Time: 12:50
Sample: 1935 1954
Periods included: 20
Cross-sections included: 10
Total panel (balanced) observations: 200
Swamy and Arora estimator of component variances
Variable |
Coefficient |
Std. Error |
t-Statistic |
Prob. |
|
|
|
|
|
|
|
|
|
|
C |
-57.83441 |
28.88930 |
-2.001932 |
0.0467 |
F |
0.109781 |
0.010489 |
10.46615 |
0.0000 |
C01 |
0.308113 |
0.017175 |
17.93989 |
0.0000 |
|
|
|
|
|
|
|
|
|
Effects Specification |
S.D. |
Rho |
|
|
|
|
|
|
|
|
|
|
|
|
|
Cross-section random |
|
|
84.20095 |
0.7180 |
Idiosyncratic random |
|
|
52.76797 |
0.2820 |
|
|
|
|
|
|
|
|
|
|
Next we select the Hausman test from the equation menu by clicking on View/Fixed/Random Effects Testing/Correlated Random Effects - Hausman Test. EViews estimates the corresponding fixed effects estimator, evaluates the test, and displays the results in the equation window. If the original specification is a two-way random effects model, EViews will test the two sets of effects separately as well as jointly.
There are three parts to the output. The top portion describes the test statistic and provides a summary of the results. Here we have:
Correlated Random Effects - Hausman Test
Equation: Untitled
Test cross-section random effects
|
Chi-Sq. |
|
|
Test Summary |
Statistic |
Chi-Sq. d.f. |
Prob. |
|
|
|
|
|
|
|
|
Cross-section random |
2.131366 |
2 |
0.3445 |
|
|
|
|
|
|
|
|
The statistic provides little evidence against the null hypothesis that there is no misspecification.