

Working with an Equation—243
sidered previously. The results are presented in two parts: the test specification and test results are displayed at the top of the output, and the results for the test equation (not depicted) are displayed at the bottom:
Cointegration Test - Park Added Variables
Date: 08/11/09 Time: 13:49
Equation: EQ_19_3_31
Series: LC LY
Null hypothesis: Series are cointegrated
Original trend specification: Linear trend
Added trends: Powers of trend up to 3
Added deterministics to test: @TREND^2 (@TREND/170)^3
|
Value |
df |
Probability |
|
Chi-square |
12.72578 |
2 |
0.0017 |
|
|
|
|
|
|
The null hypothesis is that the series are cointegrated. The original specification includes a constant and linear trend and the test equation will include up to a cubic trend. The Park test evaluates the statistical significance of the @TREND^2 and the (@TREND/170)^3 terms using a conventional Wald test. (You may notice that the latter cubic trend term—and any higher order trends that you may include—uses the trend scaled by the number of observations in the sample.)
The test results reject the null hypothesis of cointegration, in direct contrast to the results for the Engle-Granger, Phillips-Ouliarias, and Hansen tests (though the latter, which also tests the null of cointegration, is borderline). Note however, adding a quadratic trend to the original equation and then testing for cointegration yields results that, for all four tests, point to cointegration between LC and LY.
Working with an Equation
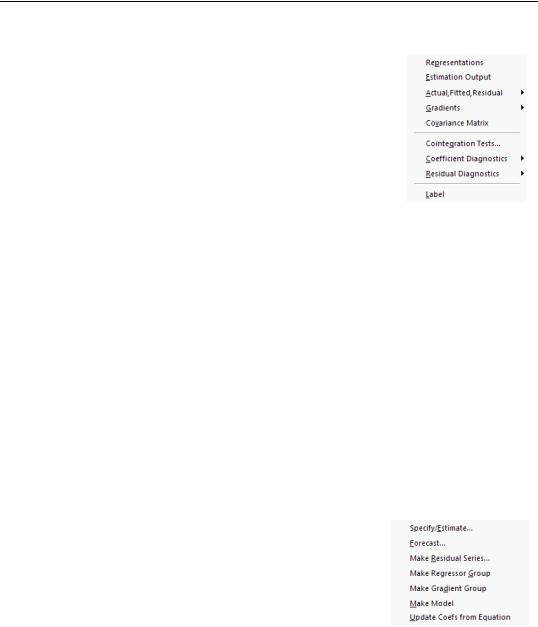
Once you estimate your equation, EViews offers a variety of views and procedures for examining the properties of the equation, testing, forecasting, and generating new data. For the most part, these views and procedures are a subset of those available in other estimation settings such as least squares estimation. (The one new view, for cointegration testing, is described in depth in “Testing for Cointegration,” beginning on page 234.) In some cases there have been modifications to account for the nature of cointegrating regression.

References—245
Data Members
The summary statistics results in the bottom of the equation output may be accessed using data member functions (see “Equation Data Members” on page 34 for a list of common data members). For equations estimated using DOLS (with default standard errors), FMOLS, or CCR, EViews computes an estimate of the long-run variance of the residuals. This statistic may be accessed using the @lrvar member function, so that if you have an equation named FMOLS,
scalar mylrvar = fmols.@lrvar
will store the desired value in the scalar MYLRVAR.
References
Engle, R. F., and C. W. J. Granger (1987). “Co-integration and Error Correction: Representation, Estimation, and Testing,” Econometrica, 55, 251-276.
Hamilton, James D. (1994). Time Series Analysis, Princeton: Princeton University Press.
Hansen, Bruce E. (1992a). “Efficient Estimation and Testing of Cointegrating Vectors in the Presence of Deterministic Trends,” Journal of Econometrics, 53, 87-121.
Hansen, Bruce E. (1992b). “Tests for Parameter Instability in Regressions with I(1) Processes,” Journal of Business and Economic Statistics, 10, 321-335.
Hayashi, Fumio (2000). Econometrics, Princeton: Princeton University Press.
MacKinnon, James G. (1996). “Numerical Distribution Functions for Unit Root and Cointegration Tests,”
Journal of Applied Econometrics, 11, 601-618.
Ogaki, Masao (1993). “Unit Roots in Macroeconometrics: A Survey,” Monetary and Economic Studies, 11, 131-154.
Park, Joon Y. (1992). “Canonical Cointegrating Regressions,” Econometrica, 60, 119-143.
Park, Joon Y. and Masao Ogaki (1991). “Inferences in Cointegrated Models Using VAR Prewhitening to Estimate Short-run Dynamics,” Rochester Center for Economic Research Working Paper No. 281.
Phillips, Peter C. B. and Bruce E. Hansen (1990). “Statistical Inference in Instrumental Variables Regression with I(1) Processes,” Review of Economics Studies, 57, 99-125.
Phillips, Peter C. B. and Hyungsik R. Moon (1999). “Linear Regression Limit Theory for Nonstationary Panel Data,” Econometrica, 67, 1057-1111.
Phillips, Peter C. B. and Mico Loretan (1991). “Estimating Long-run Economic Equilibria,” Review of Economic Studies, 59, 407-436.
Saikkonen, Pentti (1992). “Estimation and Testing of Cointegrated Systems by an Autoregressive Approximation,” Econometric Theory, 8, 1-27.
Stock, James H. (1994). “Unit Roots, Structural Breaks and Trends,” Chapter 46 in Handbook of Econometrics, Volume 4, R. F. Engle & D. McFadden (eds.), 2739-2841, Amsterdam: Elsevier Science Publishers B.V.
Stock, James H. and Mark Watson (1993). “A Simple Estimator Of Cointegrating Vectors In Higher Order Integrated Systems,” Econometrica, 61, 783-820.

246—Chapter 25. Cointegrating Regression