

EViews Guides BITCH / EViews_tutorial
.pdfA Guide to Using EViews with
Using Econometrics: A Practical Guide
Written By
R. R. Johnson
University of San Diego
Introduction
In the Introduction:
1.Purpose of this guide
2.EViews help
3.EViews basics and objects
4.Mathematical expressions in EViews
5.Areas in EViews main window
Purpose of this guide:
Econometrics is defined by A. H. Studenmund1 to be "the quantitative measurement and analysis of actual economic and business phenomena." This definition highlights the importance of learning econometrics by working through examples. This guide demonstrates how to use EViews to complete the econometric analysis illustrated in the text. EViews output can be copied and pasted into word processing files to facilitate the research report writing process.
Each chapter in this guide corresponds to a chapter in Using Econometrics: A PracticalGuide (UE), by A. H. Studenmund. All of the econometric processes examined in a chapter are reproduced in the corresponding chapter of this guide, using EViews whenever a data set is provided.2 This guide is a do-it-yourself manual and students should be able to reproduce the econometric analysis described in UE, without further assistance from the instructor. Best results are achieved when the text chapter is read first and then the operations are performed as you read the guide. Most procedures described in this guide are explained in a step-by-step manner so that even the novice user should be able to follow. The reader is advised to consult the owner's manual or the help function in EViews in cases where: a deeper understanding of EViews' functions is desired, a description of how EViews performs the calculations is desired, or references to the source of the econometric theory applied by EViews is sought.
I would like to thank A. H. Studenmund for his helpful comments and a special thanks to Pat Johnson for her superb editorial assistance and for making sure that the instructions in this guide are clear and easy to follow. Your feedback is very valuable - send your comments about this site and this guide to mailto:Johnson@acusd.edu.
1A. H. Studenmund, Using Econometrics, A PracticalGuide (fourth edition), Addison Wesley, 2000, p. 3.
2For a variety of reasons, data sets for some of the examples presented in the text are not available.
EViews help:
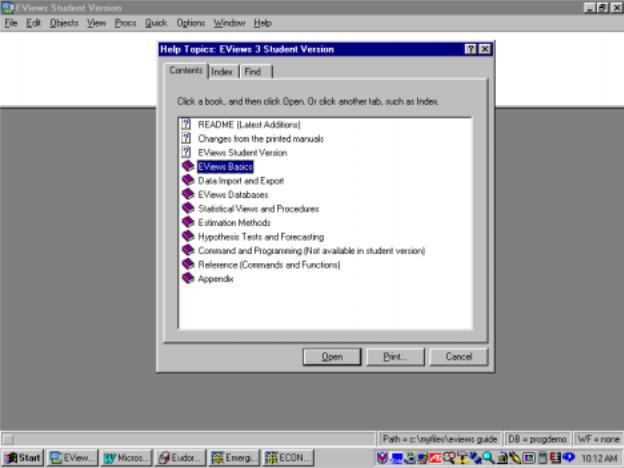
For additional information, open the EViews program and select Help/EViews Help Topics… and a list of help categories is revealed (see the graphic below). Each help category contains a list of subtopics that are revealed by double clicking the book icon in front of the category. Other topics and subtopics can be viewed by scrolling down and clicking the subject of interest. If you know the specific subject matter, you can view the Contents listed in alphabetical order or use Find to locate the topic of interest. EViews uses standard Windows Help, the on-line manual is fully searchable and hypertext linked. The Help system contains updates to the documentation that were made after the manuals went to press. In addition to the information provided in the manuals and the help system, go to http://www.eviews.com on the World Wide Web and review the Frequently Asked Questions (FAQ) section, where you can find answers to common questions about installing, using, and getting the most out of EViews.
EViews basics and objects:
The EViews program is designed around the concept of objects. Objects are collections of related information and operations that are bundled together in an easy-to-use unit. Virtually all of your work in EViews will involve using and manipulating various objects. Think of an object as a filing cabinet or organizer for the item with which you are working. The most important object in EViews is the workfile and your first step in any project will be to create a new workfile or to load an existing workfile into memory. Each object consists of a collection of information related to a particular area of analysis. Objects associated with a particular concept are said to be of a given type, where the type name is used to identify the subject of analysis. Associated with each type of object is a set of views and procedures which can be used in association with the information contained in the object. For example, a series object is a collection of information related to a set of observations on a particular variable. An equation object is a collection of information related to the relationship between a collection of variables. Since an equation object contains all of the information relevant to an estimated relationship, you can move freely between a variety of equation specifications simply by choosing to work with a different equation object. You can examine results, perform hypothesis and specification tests, or generate forecasts at any time. Managing your work is simplified since only a single object is used to work with an entire collection of data and results. Tip: Name all objects that you think you want to view later. Then the object can be recalled by double clicking the named object in the workfile.
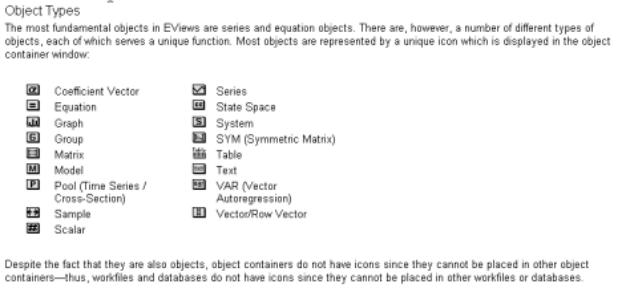
The most fundamental objects in EViews are workfiles, series, and equation objects. There are, however, a number of other objects that serve special functions. A list of EViews objects includes: Coefficient Vector, Databases, Equation, Graph, Group, Model, Pool (Time Series / Cross-Section), Sample, Series, State Space, System, SYM (Symmetric Matrix), Table, Text, VAR (Vector Autoregression), Vector/Row, and Vector Scalar. All objects, except workfiles and databases, have their own icons that are displayed in the workfile window (see object types below along with their respective icons). When a new workfile is created, two objects are displayed in the workfile window – the Coefficient Vector (filled with zeros) and the residual series (filled with NA's).
To create an object: select Objects/New Object from the main menu or workfile menu, click on the type of object that you want to create, provide a name and then click on OK. For some object types, another dialog box will open, prompting you to describe your object in more detail. For most objects, however, the object window will open immediately. A workfile must be open before an object can be created. The process of creating a workfile and objects will be explained later in this guide.
Mathematical expressions in EViews:
EViews contains an extensive library of built-in operators and functions that allow you to perform complicated mathematical operations with your data using just a few keystrokes. In addition to supporting standard mathematical and statistical operations, EViews provides a number of specialized functions for automatically handling the leads, lags, and differences that are commonly found in time series data. All of the operators described below may be used in expressions involving series and scalar values. When applied to a series expression, the operation is performed for each observation in the current sample.
EViews follows the usual order in evaluating expressions from left to right, with operator precedence order (from highest precedence to lowest):
1.^
2.*, /
3.+, subtraction (-)
4.<, >, <=, >=, =
5.and, or
For a list and description of all of the operators and special functions available in EViews, click on: Help/Function Reference.
The table below explains the function of each mathematical operator used by EViews.
Expression |
Operator |
Description |
+ |
add |
x+y adds the contents of X and Y |
– |
subtract |
x–y subtracts the contents of Y from X |
* |
multiply |
x*y multiplies the contents of X by Y |
/ |
divide |
x/y divides the contents of X by Y |
^ |
raise to the power |
x^y raises X to the power of Y |
> |
greater than |
x>y takes the value 1 if X exceeds Y, and 0 otherwise |
< |
less than |
x<y takes the value 1 if Y exceeds X, and 0 otherwise |
= |
equal to |
x=y takes the value 1 if X and Y are equal, and 0 otherwise |
<> |
not equal to |
x<>y takes the value 1 if X and Y are not equal, and 0 if they are |
|
|
equal |
<= |
less than or equal to |
x<=y takes the value 1 if X does not exceed Y, and 0 otherwise |
>= |
greater than or equal to |
x>=y takes the value 1 if Y does not exceed X, and 0 otherwise |
and |
logical and |
x and y takes the value 1 if both X and Y are nonzero, and 0 |
|
|
otherwise |
or |
logical or |
x or y takes the value 1 if either X or Y is nonzero, and 0 otherwise |
Areas in EViews main window:
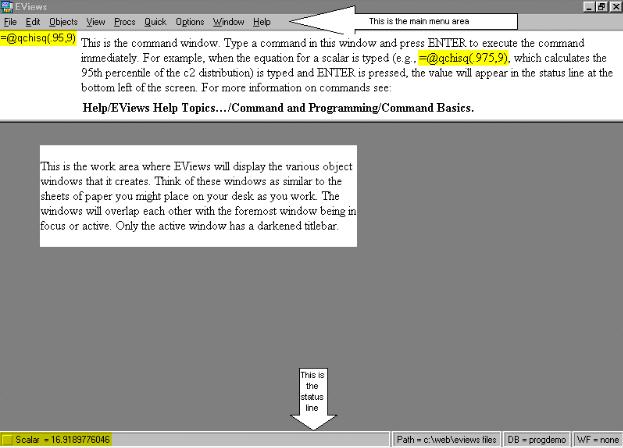
Refer to the graphic above as you read a description of the various areas of the EViews window below. References to these areas will be made throughout this guide.
The title bar: The title bar, labeled EViews Student Version, is at the very top of the main window.
The main menu: Just below the title bar is the main menu. If you move the cursor to an entry in the main menu and click on the left mouse button, a drop-down menu will appear. Clicking on an entry in the drop-down menu selects the highlighted item. Some of the items in the drop-down menu may be listed in black and others in gray. In menus, black items may be executed while the gray items are not available.
The command window: Below the main menu bar is an area called the command window where EViews commands are typed. The command is executed as soon as you hit ENTER.
The status line: At the very bottom of the window is a status line, which is divided into four sections. The left section will sometimes contain status messages sent to you by EViews. These status messages can be cleared manually by clicking on the box at the far left of the status line. The next section shows the default directory that EViews will use to look for data and programs. The last two sections display the names of the default database and workfile.
The work area: The area in the middle of the window is the work area where EViews will display the various object windows that it creates. Think of these windows as similar to the sheets of paper you might place on your desk as you work. The windows will overlap each other with the foremost window being in focus or active. Only the active window has a darkened titlebar.
Chapter 1: An Overview of Regression Analysis
In this chapter:
1.A simple example of regression analysis (UE 1.4):
a)Creating an EViews workfile
b)Entering data into an EViews workfile
c)Creating a group in EViews
d)Graphing with EViews
e)Generating new variables in EViews
2.Exercises
Section 1.4 describes how a weight guesser can use regression analysis to make better guesses about a person's weight (Y) based only on a person's height (X). The data for this example are printed in UE1, Table 1.1, p. 20, and available in the EViews workfile named htwt1.wf1.
However, since some data sets may not be in EViews file format, the process of creating an EViews workfile and entering data into the new workfile will reviewed here. The process of creating an EViews workfile and importing data into the new workfile from an Excel file will be reviewed in Chapter 2.
Creating an EViews workfile:
To create a new workfile for the weight (Y) versus height (X) data set printed in columns (2) and
(3) of (UE, Table 1.1, p. 20):
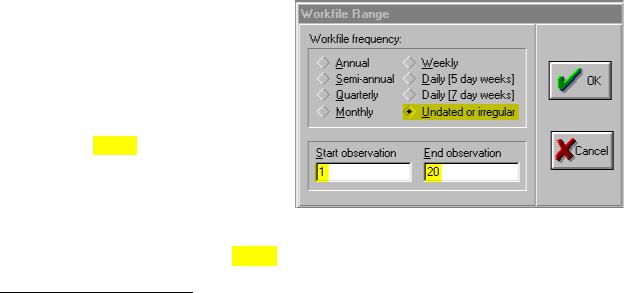
Step 1. Select File/New/Workfile on the EViews main menu bar.
Step 2. Set the Workfile frequency: to Undated or irregular.
Step 3. Since there are 20 observations in the data set, set the Start observation to 1 and End observation to 20 (refer to areas highlighted in yellow in the figure on the right).2
Step 4. Once you have selected the appropriate frequency and entered the information for
the workfile range, click OK. EViews will create an untitled workfile, and will display the workfile window in the main work area of the EViews screen. The workfile window displays two pairs of numbers highlighted in yellow: one for the Range: of data contained in the workfile, and the second for the current workfile Sample:. Both the workfile range and sample can be
1Using Econometrics, A Practical Guide (fourth edition), by A. H. Studenmund will be referred to as (UE) when referenced in this handbook.
2For monthly, quarterly, or annual time series data, with observations ranging from the beginning of 1980 to the end of 1996, select from the following options: for monthly data, set the Workfile frequency: to monthly, and specify the Start date, 1980:01, and the End date, 1996:12. For quarterly data, set the Workfile frequency: to quarterly, and specify the Start date, 1980:1, and the End date, 1996:4. For annual data, set the Workfile frequency: to annual, and specify the Start date, 1980, and the End date, 1996. See Help/Contents/EViews Basics/Workfile Basics for more information about creating and using workfiles in EViews.
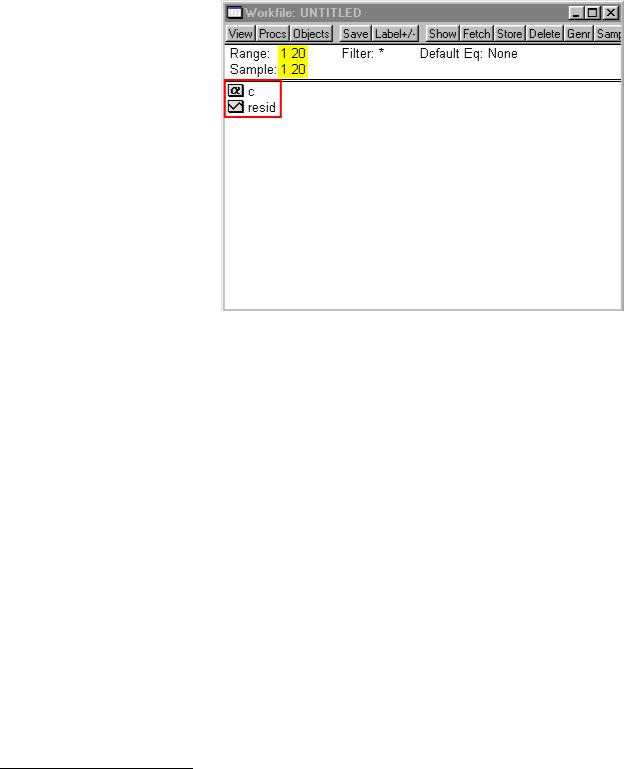
changed after the workfile has been created. Note that all new workfiles will contain two objects boxed in red: the coefficient vector named c and the residual series named resid. (see the figure below).
Step 5. To save your workfile, select Save on the workfile menu bar or File/Save or File/Save As on the main menu bar and enter htwt1.wf1 in the File name: window, select the destination drive in the Save in: window and click OK. It is advisable to save the workfile after it is created and frequently thereafter.
Entering data into an EViews workfile:
Complete the section entitled Creating an EViews workfile
before attempting this procedure. To enter the data for height (inches above 5') and weight from columns (2) and (3) of Table 1.1, (UE, p. 20) into the newly created workfile, follow the steps below.
Step 1. To create a new series for the weight (Y) variable, select Objects/New Object/Series from the main menu or the workfile menu, enter Y in the Name for Object: window and click OK. All of the observations in the series will be assigned the missing value code 'NA'.3
Step 2. To enter data into the newly created series, double click the series in the workfile window and click edit+/- on the series window menu bar. The numbers from the table can be entered to replace the NA's in the spreadsheet, pressing Enter after each entry. After the numbers have been entered, click edit+/- on the series window menu bar to save the changes and exit the edit function. The series window can be closed by clicking the  button in the upper right corner of the series window.
Step 3. Repeat the process for the height (X) variable.
Step 4. To save changes to your workfile, click Save on the workfile menu bar.
Most data are available in spreadsheet file or ASCII text file format, which can be imported directly into the workfile. The procedure for importing the weight and height data from an ASCII text file will be explained in Chapter 2. The edit procedure described above is mostly used to adjust data series after they are imported. In cases where expressions can be used to assign values for the series, click on Quick/Generate Series or click on Genr on the workfile window menu bar and enter the expression defining the series. For more information on how to generate a series using expressions, see Help/Contents/EViews Basics/Working with Series.
3 A series can also be created by clicking on Quick/Generate Series on the main menu bar or by clicking on Genr on the workfile window menu bar and enter the expression Y = NA or any other mathematical expression.
Creating a group in EViews:
EViews provides specialized tools for working with groups of series. Follow these steps to create a group object containing the Y & X series:
Step 1. Open the EViews workfile named htwt1.wf1 by selecting File/Open/Workfile on the main menu and click on the file name.
Step 2. To create a group object for the X and Y variables, hold down the Ctrl button and click on X and Y and then select Show from the workfile toolbar.
Step 3. To name a group, click Name or Object/Name on the group menu bar and enter GROUP01 in the Name to identify object: window.4 Some features of groups are described in the footnote at the bottom of this page.5
Step 4. To save changes to your workfile, click Save on the workfile menu bar.
Graphing with EViews:
The weight guesser in section 1.4 (UE) hypothesized a positive relationship between weight and height. As a first step, plot Y against X in order to visually confirm the hypothesis.
Step 1. Open the EViews workfile named htwt1.wf1.
Step 2. To plot Y against X, open the two series in a group window (enter X before Y because EViews
specifies the first variable selected in a group as the "X" axis |
|
|
|
|
|
|
|
|
|
variable and the second as the "Y" axis variable). |
|
|
|
|
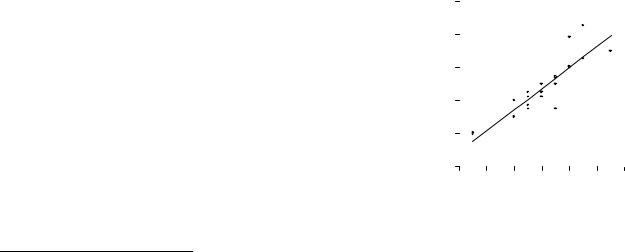
Figure 1a |
|
|
|
|
Step 3. Select View/Graph/Scatter/Scatter with Regression and |
220 |
|
|
|
|
|
|
|
|
click OK to reveal Figure 1a. EViews shows a graph with Y |
|
|
|
|
|
|
|
|
|
on the vertical axis and X on the horizontal axis as well as a |
200 |
|
|
|
|
|
|
|
|
line representing the regression equation between the two |
180 |
|
|
|
|
|
|
|
|
variables (i.e., plots UE, Equation 1.21, p. 21). As you can see |
|
|
|
|
|
|
|
|
|
Y |
|
|
|
|
|
|
|
|
|
in Figure 1a, a positive relationship between Y and X is |
|
|
|
|
|
|
|
|
|
160 |
|
|
|
|
|
|
|
|
|
visually confirmed but the relationship is distorted because |
|
|
|
|
|
|
|
|
|
|
|
|
|
|
|
|
|
|
|
EViews uses Optimal-Linear Scaling as the graph default |
140 |
|
|
|
|
|
|
|
|
setting. |
|
|
|
|
|
|
|
|
|
Step 4. To change the graph scaling, click the right mouse button |
120 |
|
|
|
|
|
|
|
|
|
|
|
|
|
|
|
|
||
anywhere in the graph and select Options. |
4 |
6 |
8 |
10 |
12 |
14 |
16 |
||
|
|
|
|
|
|
|
|
|
|
Step 5. Change the Graph Scaling option to Linear - Force
Through Zero.
4 You must name a group object if you want to keep its results. Unnamed objects are labeled “UNTITLED” and the results are lost when the object window or the workfile is closed. To name a group, click Name on the group menu bar and enter the name in the Name to identify object: window. Once named, a 'group object' is saved with the
workfile and can be viewed by double clicking its icon (i.e.,  ) in the workfile window.
5 Features of Groups: A group is simply a list of series identifiers, not a copy of the data in the series. If you change the data for one of the series in the group, you will see the changes reflected in the group. If you delete a series from the workfile, it will disappear from any group that included the series. If the deleted series is the only series in a group, the group will also be deleted. Renaming a series changes the reference in every group containing the series. Groups, like other EViews objects, contain their own views and procedures. A detailed description can be found in Help/Contents/Statistical Views and Procedures/Group Views and Procs.
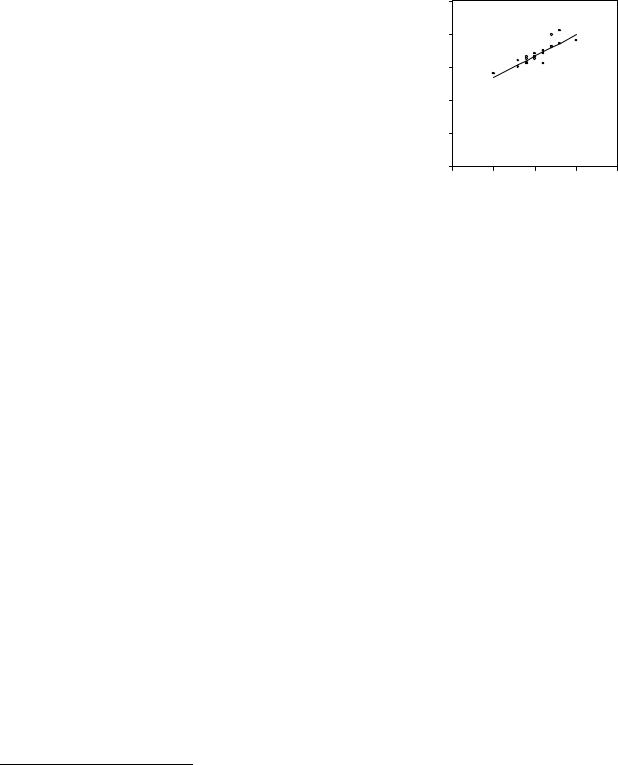
Step 6. Click OK to get the graph in Figure 1b.
Figure 1b
250
Note that the graph no longer gives a distorted view of the relationship between Y and X. The equation represented in Figures 1a & 1b has the following formula (see UE Equation 1.21, p. 21): Estimated weight (Y) = 103.40 + 6.38 * Height in inches above five feet (X)
Generating new variables in EViews:
Follow the steps below to generate the data in columns (4) through (7) of UE, Table 1.1, p. 20:
200 |
|
|
|
|
150 |
|
|
|
|
Y |
|
|
|
|
100 |
|
|
|
|
50 |
|
|
|
|
0 |
|
|
|
|
0 |
5 |
10 |
15 |
20 |
X
Step 1. Open the EViews workfile named htwt1.wf1.
Step 2. To generate a new variable named predicted, with the data printed in column (4) of UE, Table 1.1, click Genr on the workfile menu and enter the formula (predicted=103.4+6.38*X) in the Enter Equation: window. Click OK and a new variable named predicted appears in the workfile window with the values in column (4) of Table 1.1.
Step 3. To generate a new variable named residual, with the data printed in column (5) of Table 1.1, click Genr on the workfile menu and enter the formula (residual=Y-predicted) in the Enter Equation: window. Click OK and a new variable named residual will appear in the workfile window with the values in column (5) of Table 1.1.
Step 4. To generate a new variable named gainorloss, with the data printed in column (6) of Table 1.1, click Genr on the workfile menu and enter the formula gainorloss=.5*(residual>=-10 and residual<=10)-.6*(residual<-10 or residual>10) in the Enter Equation: window.6 Click OK and a new variable named gainorloss will appear in the workfile window with the values in column
(6) of Table 1.1.
Step 5. Create a group with x, y, predicted, residual, and gainorloss in order. Click
View/Spreadsheet to view the data in Table 1.1.
Step 6. Type =@sum(gainorloss) in the command window, press Enter, view the net amount gained on the status line in the lower left of the screen (i.e.,  ).
).
6 The conditional value typed within a set of parenthesis is equal to one when the condition is true and zero if the condition is false. Thus, the condition (residual>=-10 and residual<=10) is equal to one if the residual falls within the range -10 to +10 and zero if it is outside of this range. The condition (residual<-10 or residual>10) is equal to one if the residual is less than -10 or greater than +10 and zero if it falls within the range -10 to +10.