

32—Chapter 2. EViews—Meet Data
Hint: EViews uses NA to indicate “not available” for numeric series and just an empty string for a “not available” alpha value. The latter explains why the observations for DISCIPLINE are blank.
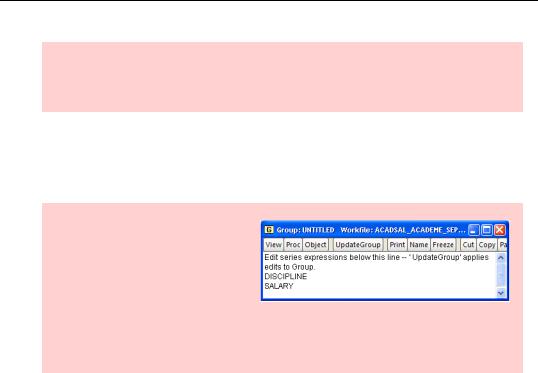
Click the  button and type away. When editing a group window, the Enter key moves across the row rather than down a column. This lets you enter a table of data an observation at a time rather than one variable after the other; the observation at a time technique is frequently more convenient.
Hint: To change the left-to-right order of series in a group use the menu View/Group Members. You’ll see a list of series in the group. Edit the text—cut-and-paste is useful here—re-arranging the
names into the desired order and click  to accept the changes. Alternatively, there’s no law against closing the group window and opening a new one. Sometimes that’s faster.
Identity Noncrisis
An important side effect of thinking of our data as being arranged in a rectangle is that each row has an observation number that identifies each observation. In a group window as above, or in a series window, the id series is called “obs” and appears on the left-hand side of the window. Obs isn’t really a series, in that you can’t access it or manipulate it. It serves to give a name to each observation.
When we set up an Unstructured/Undated workfile, EViews just numbers the observations 1, 2, 3, etc. (In dated workfiles, see below, dates are used for ids rather than sequence numbers.) Rather than calling data for dentistry “observation 1” and data for medicine “observation 2,” it might be a lot more meaningful to label them “dentistry” and “medicine.” EViews lets us specify that one of the existing series—obviously DISCIPLINE is the sensible choice— should be used as the id series.
Identity Noncrisis—33
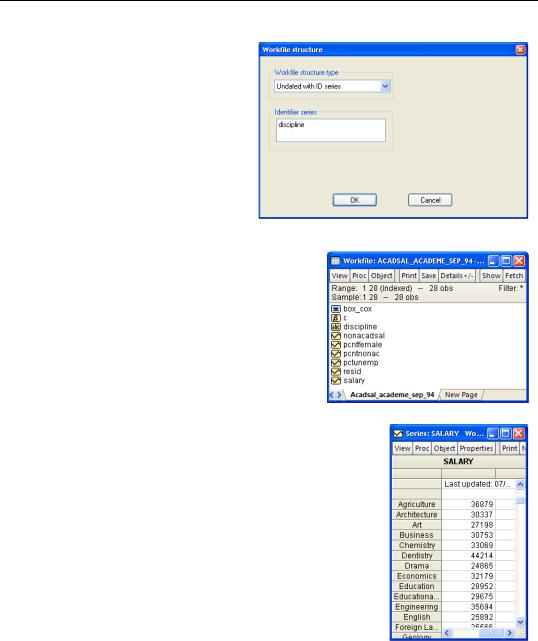
Changing the id series requires “restructuring” the workfile. This is no big deal: “restructuring” amounts essentially to telling EViews to use an id series. Double-click on Range in the upper pane of the workfile window or choose the menu item
Proc/Structure/Resize Current Page…. Then choose Undated with ID series and fill in the series you want used for the id, as illustrated here.
You’ll notice that the Range field in the workfile window is now marked “(indexed).”
Now if we look at a spreadsheet view of SALARY the rows are labeled with DISCIPLINE in place of an uninformative observation number.
34—Chapter 2. EViews—Meet Data
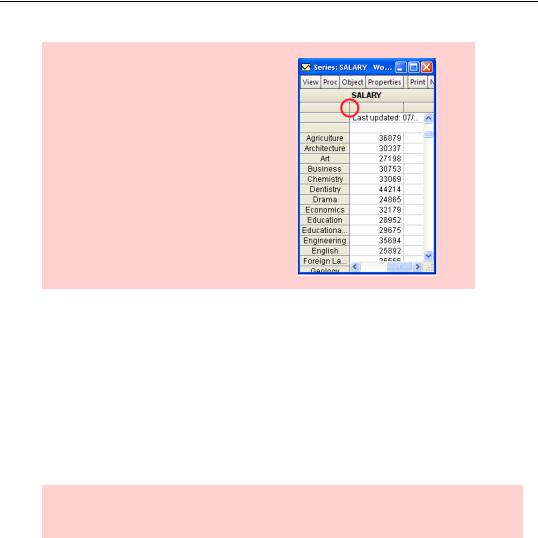
Hint: If you want to be able to see more or less of the id series in the left-hand column, just grab the column divider and drag it over to the right. All column widths are adjustable in the same way.
Counting Hint: If you want to add the observation number to the label right-click and select ObsID +/-. To return to the original display, just do it again.
Dated Series
Let’s set aside our academic salary example for a bit and talk about more options for the identification series and the parallel options for structuring a workfile.
EViews comes with a rich, built-in knowledge of the calendar. Lots of data—lots and lots of data—is dated at regular intervals. Observations are taken annually, quarterly, monthly, etc. EViews understands a variety of such frequencies. The only difference between creating an undated workfile and a dated workfile is that for an undated workfile you enter the total number of observations, while for a dated workfile you provide a beginning date and an ending date.
Hint: Even when data are measured at regular intervals, measurements are sometimes missing. Not a problem, just leave missing measurements marked NA.
Dated Series—35
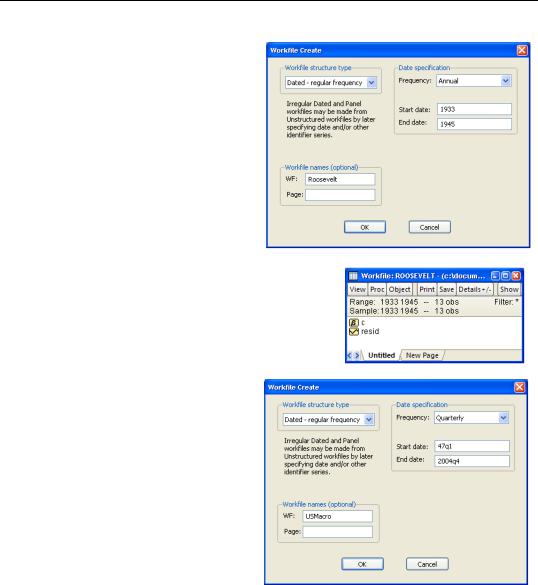
Let’s create a couple of workfiles for practice. As a first example, let’s make an annual workfile for the Roosevelt years (Franklin, not Teddy). Use the menu command File/New/Workfile… to bring up the Workfile Create dialog. Fill in the fields as shown.
Note that when the workfile window
pops open, Range shows 1933 to 1945 and that there are 13 observations in the workfile.
A second example. Most national income accounting macro data for the United States is available on a quarterly basis starting in 1947. To set up a quarterly workfile use
File/New/Workfile… and change the drop down menu Date Specification/Frequency: to Quarterly. A new issue arises: what are the formats for specifying dates? Rules for date formats are one of those boring-but-nec- essary details that we’ll put off ’til a boring-but-necessary appendix at the end of the chapter.
Why add a date structure to a workfile? One minor reason is that it saves you the trouble of figuring out that 1947q1 through 2004q4 includes exactly 232 observations. There are two more important reasons:
•An understanding of the calendar is built into many operations, so it pays to tell EViews how your information is dated. Two examples that we’ll look at later: EViews
36—Chapter 2. EViews—Meet Data
will convert between monthly and quarterly data, and will compute elapsed time between two observations in order to compute annualized rates of return.
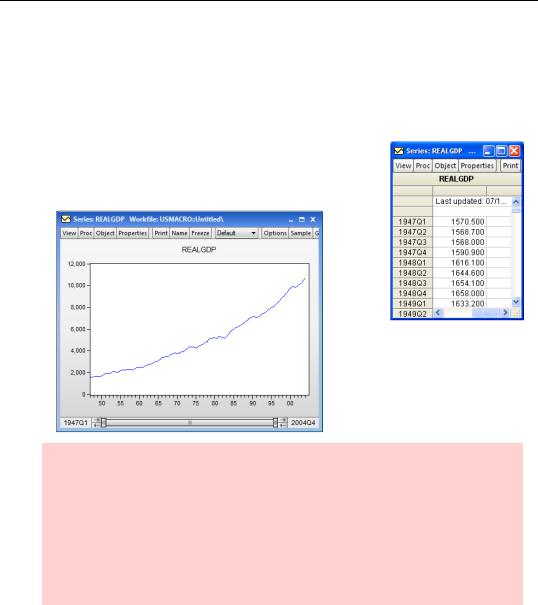
•EViews uses the id series to label all sorts of stuff, from series windows for editing data, through graphs of variables over time, to recording the sample used for statistical estimation.
Notice how much easier it is to edit data with a meaningful date label (right) and how much more meaning you get out of a plot with the x-axis labeled with a date rather than just an arbitrary observation number (below).
Tips for dating: In addition to the Annual and Quarterly frequencies that we’ve seen, EViews offers a wide range of built-in dated regular frequencies for those of you with dated data: (Multi-year, Annual, Semi-annual, Quarterly, Monthly, Bimonthly, Fortnight, Ten-day, Weekly, Daily - 5 day week, Daily - 7 day week, Daily - custom week, Intraday), and a special frequency (Integer date) which is a generalization of
Unstructured/Undated.
(The Daily – 5 day week and intra-day frequencies are especially useful for Wall Street data; the Daily – 7 day for keeping track of graduate student work hours.)
Dated Irregular
The Dated Irregular workfile structure stands in between the Dated – Regular Frequency and the Unstructured/Undated structures. Each observation has a date attached, but the observations need not be evenly spaced in time. This sort of arrangement is especially useful for financial data, where quotes are available on some days but not on others.