


Time to Type—27
Let’s look at the main window area, which is divided into a upper pane holding information about the workfile and a lower pane displaying information about the objects—series, equations, etc.—that are held in the workfile.
Range tells you the identifying numbers or dates of the first and last observation in the workfile—1 and 28 in this example—as well as the count of the number of observations. Sample describes the subset of the observations range being used for current operations. Since all we’ve done so far is to set up a workfile with 28 observations, both Range and Sample are telling us that we have 28 observations. (Later we’ll see how to change the number of observations in the workfile by double-clicking on Range, and how to change the sample by double-clicking on Sample.)
Display Filter is used to control which objects are displayed in the workfile window. Display Filter is useful if you have hundreds of objects: Otherwise it’s safely ignored.
Let’s move to the lower panel. Our brand new workfile comes with two objects preloaded:  and
and  . The series RESID is designated specially to hold the residuals from the last regression, or other statistical estimation. (See Chapter 3, “Getting the Most from Least
Squares” for a discussion of residuals.) Since we have not yet run an estimation procedure, the RESID series is empty, i.e., all values are set to NA.
An EViews workfile holds a collection of objects, each kind of object designated by its own icon. Far and away the most important object is the series (icon  ), because that’s where our data are stored. You’ll have noted that the object C has a different icon, a Greek letter b . Instead of a data series, C holds values of coefficients. Right now C is filled with zeros, but if you ran a regression and then double-clicked on C you would find it had been filled with estimated coefficients from the last regression.
Time to Type
One Series at a Time
We sit with an empty workfile. How to bring in the data? The easiest way to bring data in is to import data that someone else has already entered into a computer file. But let’s assume that we’re going to type the data in from scratch. Table 1: Academic Salary Data Excerpt displays three variables. You have a choice of entering one variable at a time or entering several in a table format. We’ll illustrate both methods.
Suppose first we’re going to enter one series at a time, starting with NONACADSAL. We want to create a new series and then fill in the appropriate values. The trick is to open a window with an empty series (and then fill it up). There are a bunch of ways to get the desired window to pop open.
These two methods pop open an Untitled series:
28—Chapter 2. EViews—Meet Data
•Type the command “series” in the command pane.
•Use the menu commands Object/New/Series
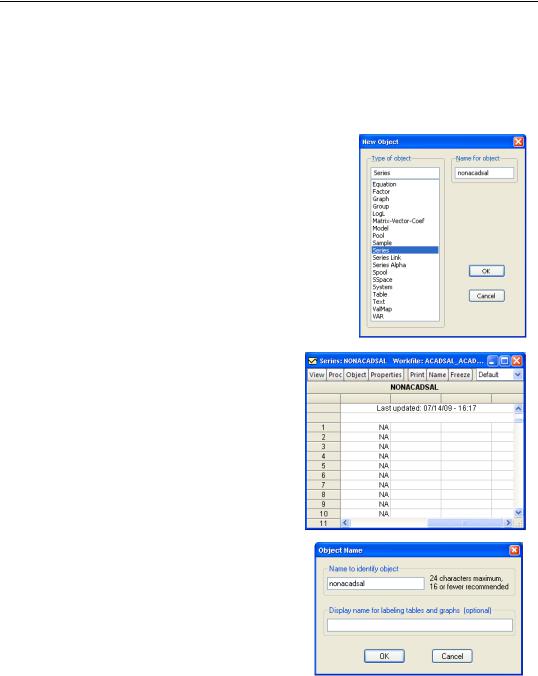
These two methods create a series named NONACADSAL and place it in the workfile:
•Type the command “series nonacadsal” in the command window.
•Use the menu commands Object/New/Series and then enter NONACADSAL in the Name for object field.
The latter two methods place  in the workfile. Double-click to open a series window. In contrast, the former two methods open a window automatically, but don’t name it. These methods open an untitled series window.
To name the untitled series, click on the  button and enter NONACADSAL.
•EViews doesn’t care about capitalization of names. NONACADSAL and nonacadsal are the same thing.
Time to Type—29
Hint: Naming a series (or other object) enters it in the workfile at the same time it attaches a moniker. In contrast, Untitled windows are not kept in the workfile. If you close an Untitled window: Poof! It’s gone. The key to remember is that named objects are saved and that Untitled ones aren’t. This design lets you try out things without cluttering the workfile.
Related hint: You can use the EViews menu item Options/General Options/Windows/Window Behavior to control whether you get a warning before closing an Untitled window. See Chapter 18, “Optional Ending.”
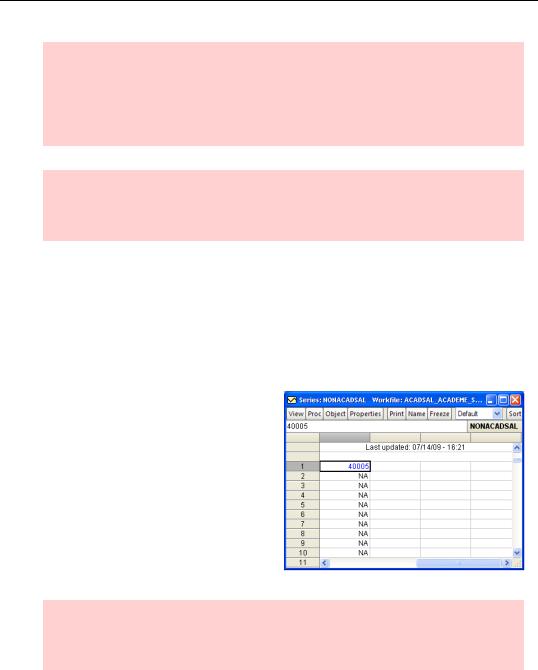
We’re ready to type numbers. But there’s a trick to entering your data. To protect against accidents, EViews locks the window so that it can’t be edited. To unlock, click on the  button. Unlocked windows, as shown below for example, have an edit field just below the button bar. One way to know that a window is locked against editing is to observe the absence of the edit field. Alternatively, if you start typing and nothing happens, you’ll remember that you meant to click on the
  button—at least that’s what usually happens to the author.
Initially all the entries in the window are NA, for not available. Click on the cell just to the right of the  and type the first data point for nonacademic salaries, 40005. Hit Enter to complete the entry.
Enter the rest of the data displayed at the beginning of the chapter. You can use all the usual arrow and tab keys as well as the mouse to move around. In addition, when a cell is selected you can edit its contents in the edit field in the upper left of the window.
Hint for the terminally obedient: For goodness sakes, don’t really enter all the data at the beginning of the chapter. You’ll be bored out of your mind. Just type in a few numbers until you’re comfortable moving around in the window.
30—Chapter 2. EViews—Meet Data
Label View
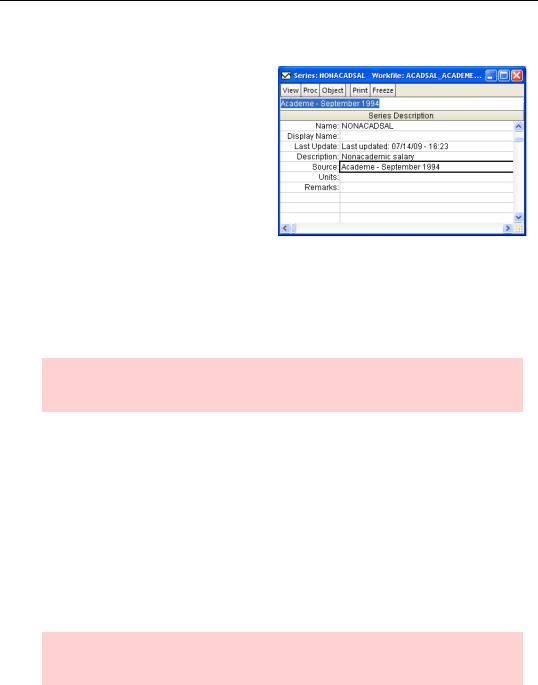
We know that EViews provides several different views for looking at a series. We enter data in the spreadsheet view and if we need to make a change we can come back to the spreadsheet view to edit existing data. Use the  button to reach the label view where space is provided for you to enter a description, source, etc.
EViews automatically fills in the name and date the series was last updated. The other fields are optional. EViews uses the
Display Name for labeling output, so it’s well worth filling out this field. Make the label long enough to be meaningful, but short enough to fit in scarce space on a graph legend. EViews will occasionally make an entry in the Remarks: field. When you start making transformations to a series, a History: field is added with notes on the last ten or so changes.
Hint: It’s worth the trouble to add as much documentation as possible in the series label. Later, you’ll be glad you did.
Typing a Table at a Time
Now let’s turn to entering data in the form of a table. As an example, we’ll enter the name of the academic discipline and the academic salary together. We begin with the same choice— do we name the series before or after we open the window? If you like to name first, do the following:
• Type the following commands in the command window:
series salary
alpha discipline
•Select DISCIPLINE and then SALARY in the workfile window (hold down the Ctrl key to select both series), double-click and choose Open Group to open a group window.
Hint: Series in a group window are displayed from left to right in the same order as you click on them in the workfile window.
Time to Type—31
Note that the series DISCIPLINE is displayed with the  icon to signal a series holding alphabetic data, as contrasted with the
  icon for ordinary numeric series.
Hint: You can name a group and store it in the workfile just as you can with a series. Internally, a group is a list of series names. It’s not a separate copy of the data. A series can be a member of as many different groups as you like.
If you like to open a window before creating a series, do the following:
•Use the menu Quick/Empty Group (Edit Series). When the window opens scroll up one line.
Then type DISCIPLINE in the cell next to the cell marked  .
.
A dialog pops up so that you can tell what sort of series this is going to be.
Since DISCIPLINE is text rather than numbers, choose Alpha series. EViews initializes DISCIPLINE with blank cells.
Move one cell to the right of DISCIPLINE and enter SALARY, this time using the radio button to indicate a numeric series. EViews fills out the series with NAs.