Window Behavior—407
Window Behavior
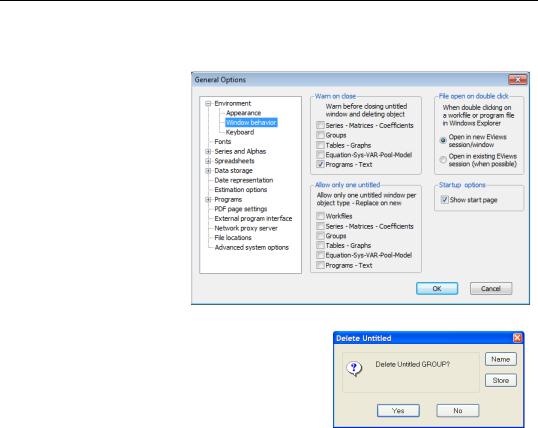
When EViews opens a new window, the window title is “Untitled”— unless you’ve explicitly given a name. Named objects are stored in the workfile; untitled objects aren’t. Commands like ls and show create untitled objects. So does freezing an object. If you do a lot of exploring, you’ll create many such untitled objects.
Unchecking Warn on close lets you close throwaways without having to deal with a delete confirmation dialog. On the other hand, once in a while you’ll delete something you meant to name and save.
As suggested earlier, you’ll probably want to
uncheck most of the options in Allow only one untitled. Doing so lets you type a sequence of ls commands, for example, without having to close windows between commands. The downside is that the screen can get awfully cluttered with accumulated untitled windows.
Keyboard Focus
The radio button Keyboard focus directs whether typed characters are “sent” by default to the command pane or to the currently active window. Most people leave this one alone, but if you find that you’re persistently typing in the command pane when you meant to be editing another window, try switching this button and see if the results are more in line with what your fingers intended.
408—Chapter 18. Optional Ending
Font Options
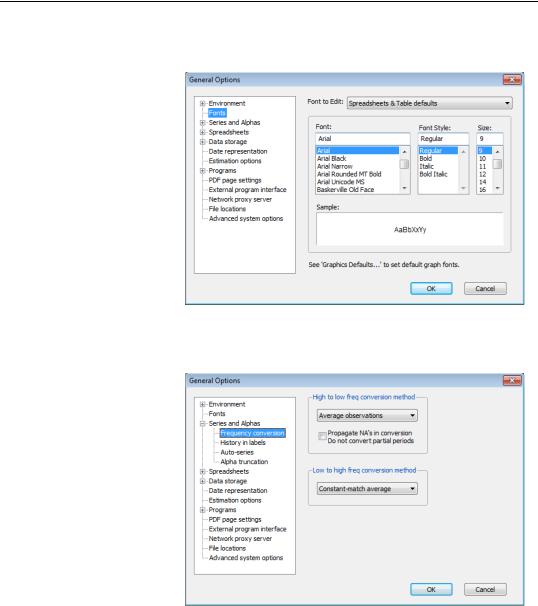
The Fonts dialog controls default fonts in the workfile display, in spreadsheets, and in tables. Font selection is an issue about what looks good to you, so turn on whatever turns you on.
Frequency Conversion
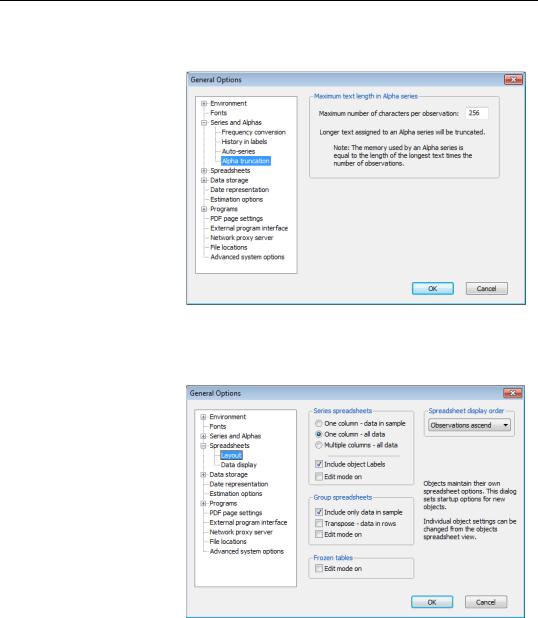
The Series and
Alphas/Frequency conversion dialog lets you reset the default frequency conversions. Usually there’s a way to control the conversion method used for individual conversions. Sometimes—copy-and- paste, for example— there isn’t.
See Multiple Frequen- cies—Multiple Pages in Chapter 9, “Page After
Page After Page” for an extended discussion of frequency conversion.
Alpha Truncation—409
Alpha Truncation
EViews sometimes truncates text in alpha series. You probably don’t want this to happen. Unless you’re storing large amounts of data in alpha series, increase the maximum number of characters so that nothing ever gets truncated. With modern computers, “large amounts of data” means on the order of 105 or 106 observations.
Spreadsheet Defaults
Aside from the comments in Option-al Recommendations above, there’s really nothing you need to change in the Spreadsheets defaults section. Looking at the Layout page, you may want to check one or more of the Edit mode on checkboxes. If you do, then the corresponding spreadsheets open with editing permitted. Leaving edit mode off gives you a
little protection against making an accidental change and economizes on screen space by suppressing the edit field in the spreadsheet. This is purely a matter of personal taste.
410—Chapter 18. Optional Ending
Workfile Storage Defaults
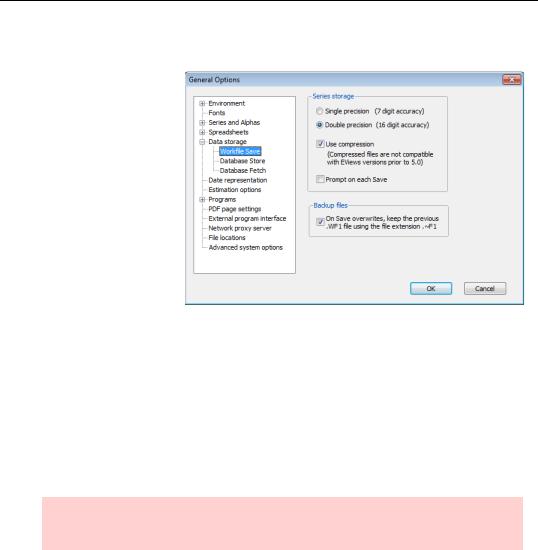
Back in the old days, computer storage was a scarce commodity. Data was often stored in “single precision,” offering about seven digits of accuracy in four bytes of storage. Today, data are usually represented in “double precision,” giving 16 digits of accuracy in eight bytes of storage. Since raw data aren’t likely to be accurate to more than seven digits,
single precision seems sufficient. However, numerical operations can introduce small errors. EViews holds all internal results in double precision for this reason. Using double precision when storing the workfile on the disk preserves this extra accuracy. Using single precision cuts file size in half, but causes some accuracy to be lost.
Internally, each observation in a series takes up eight bytes of storage. There’s no great reason you should care about this as either you have enough memory—in which case it doesn’t matter—or you don’t have enough memory—in which case your only option is to buy some more. And as a practical matter, unless you’re using millions of data points the issue will never arise.
Hint: Workfile Save Options have no effect on the amount of RAM (internal storage) required. They’re just for disk storage.
Use compression tells EViews to squish the data before storing to disk. When much of the data takes only the values 0 or 1, which is quite common, disk file size can be reduced by nearly a factor of 64. This level of compression is unusual, but shrinkage of 90 percent happens regularly. Unlike use of single precision, compression does not cause any loss of accuracy.
The truth is that disk storage is so cheap that there’s no reason to try to conserve it. While disk storage itself is rarely a limiting factor, moving around large files is sometimes a nuisance. This is especially true if you need to email a workfile.