Unsubtle Redirection—397
Unsubtle Redirection
Inside Output
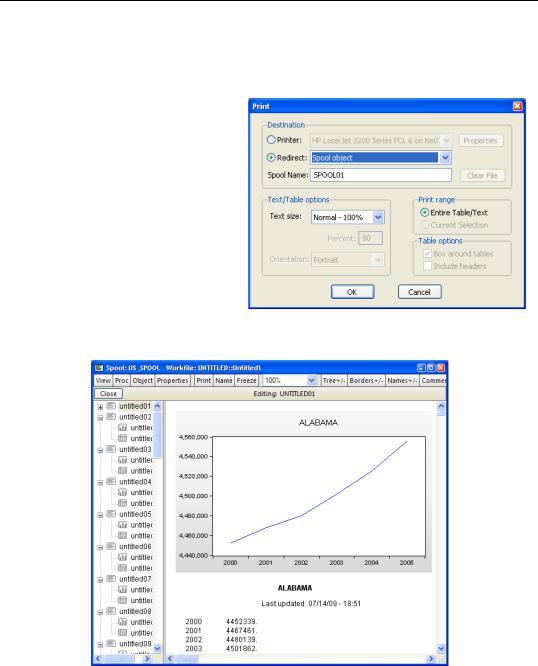
You hit  and output goes out, right? Not necessarily, as EViews provides an option that allows you to redirect printer output to an EViews spool object. The spool object collects output that would otherwise go to the printer. This gives you an editable record of the work you’ve done.
The window below is scrolled so that you can see part of a table and part of a graph, each of which had previously been redirected to this spool. Objects are listed by name in
the left pane and object contents are displayed in the right pane.
398—Chapter 17. Odds and Ends
Outside Output
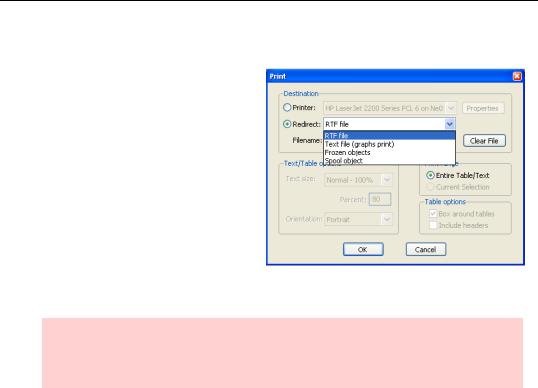
You hit  and output—at least output that doesn’t stay inside—goes to the printer, right? Not necessarily, as EViews provides an option that allows you to redirect printer output to a disk file instead. Choosing the Redirect radio button in the Print dialog leads to output destination choices. RTF file adds the output to the end of the specified file in a format that is easily read by word processing programs. Text file writes text output as a standard (unformatted) text file and sends graphic output to the printer. Frozen objects
freezes the object that you said to “print” and stores it in the active workfile.
Hint: Use the command pon in a program (see Chapter 16, “Get With the Program”) to make every window print (or get redirected) as it opens. Poff undoes pon. Unfortunately, pon and poff don’t work from the command line, only in programs.
Objects and Commands
When we type:
ls lnwage c ed
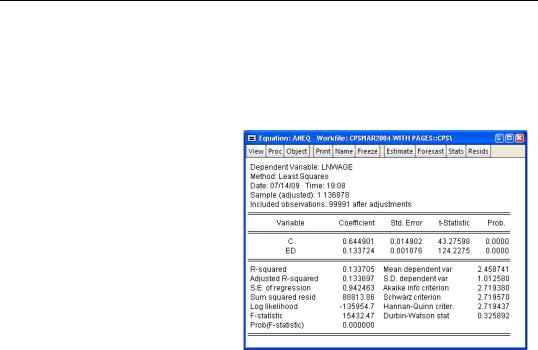
it looks like we’ve simply typed a regression command. But behind the scenes, EViews has created an equation object just like those we see stored in the workfile with the  icon. The difference is that the equation object is untitled, and so not stored in the workfile. Internally, all commands are carried out as operations applied to an object. Rather than give the ls command, we could have issued the two commands:
equation aneq
aneq.ls lnwage c ed
The first line creates a new equation object named ANEQ. The second applies the ls operation to ANEQ. The dot between ANEQ and ls is object-oriented notation connecting the object, aneq, with a particular command, ls.
The two lines could just as easily have been combined into one, as in:
equation aneq.ls lnwage c ed
Workfile Backups—399
So ls is actually an operation defined on the equation object. Similarly, output is a view of an equation object.
The command:
aneq.output
opens a view of ANEQ displaying the estimation output.
Do you need to understand the abstract concepts of objects, object commands, and object views? No, everything can be done by combining point-and- click with typing the straightforward commands that we’ve used throughout EViews Illustrated. But if you prefer doing everything via the command line, or if you want an exact record of the commands issued, you may find the fine-
grain control offered by objects helpful.
The Command and Programming Reference includes extensive tables documenting each object type and the commands and views associated with each.
Workfile Backups
When you save a workfile EViews keeps the previous copy on disk as a backup, changing the extension from “.wf1” to “.~f1”. For example, the first time you save a workfile named “foo,” the file is saved as “foo.wf1”. The second time you save foo, the name of the first file is changed to “foo.~f1” and the new version becomes “foo.wf1”. The third time you save foo, the first file disappears, the second incarnation is changed to “foo.~f1”, and the third version becomes “foo.wf1”.
It’s okay to delete backup versions if you’re short on disk space. On the other hand, if something goes wrong with your current workfile, you can recover the data in the backup version by changing the backup filename to a name with the extension “wf1”. For example, to read in “foo.~f1”. change the name to “hope_this_saves_my_donkey.wf1” and then open it from EViews.
400—Chapter 17. Odds and Ends
Etymological Hint: “Foo” is a generic name that computer-types use to mean “any file” or “any variable.” “Foo” is a shortened version of “foobar.” “Foobar” derives from the World War II term “fubar,” which itself is an acronym for “Fouled Up Beyond All Recognition” (or at least that’s the acronymization given in family oriented books such as the one you are reading). The transition from “fubar” to “foobar” is believed to have arisen from the fact that if computer types could spell they wouldn’t have had to give up their careers as English majors. (For further information, contact the Professional Organization of English MajorsTM.)
Updates—A Small Thing
Objects in workfiles are somewhere between animate and inanimate. If you open a graph view of a series and then change the data in the series, the graph will update before your very eyes. If you open an Estimation Output view of an equation and then change the data in one of the series used in the equation, nothing at all will happen.
Some views update automatically and some don’t.
Mostly, the update-or-not decision reflects design guesses as to what the typical user would like to have happen. To be sure estimates, etc., reflect the latest changes you made to your data, redo the estimates.
Updates—A Big Thing
Quantitative Micro Software (QMS) posts program updates to www.eviews.com as needed. Bug fixes are posted as soon as they become available. Serious bugs are very rare, and bugs outside the more esoteric areas of the program are very, very, rare.
QMS also posts free, minor enhancements from time to time and, once-in-a-while, posts updated documentation. On occasion, QMS releases a minor version upgrade (5.1 from 5.0, for example) free-of-charge to current users. Some of these “minor” upgrades include quite significant new features. It pays to check the EViews website.
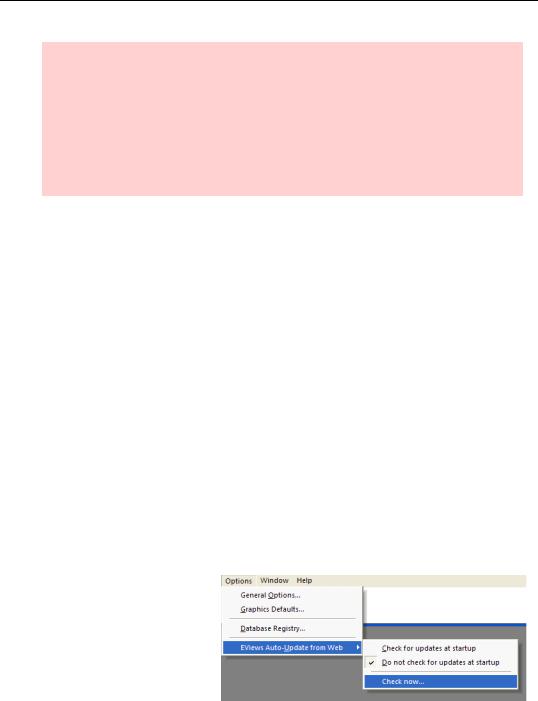
If you’d like, you can use the automatic updating feature to can check for new updates every day, and install any available updates. The automatic update feature can be enabled or disabled from the main Options menu under the