
- •Table of Contents
- •Foreword
- •Chapter 1. A Quick Walk Through
- •Workfile: The Basic EViews Document
- •Viewing an individual series
- •Looking at different samples
- •Generating a new series
- •Looking at a pair of series together
- •Estimating your first regression in EViews
- •Saving your work
- •Forecasting
- •What’s Ahead
- •Chapter 2. EViews—Meet Data
- •The Structure of Data and the Structure of a Workfile
- •Creating a New Workfile
- •Deconstructing the Workfile
- •Time to Type
- •Identity Noncrisis
- •Dated Series
- •The Import Business
- •Adding Data To An Existing Workfile—Or, Being Rectangular Doesn’t Mean Being Inflexible
- •Among the Missing
- •Quick Review
- •Appendix: Having A Good Time With Your Date
- •Chapter 3. Getting the Most from Least Squares
- •A First Regression
- •The Really Important Regression Results
- •The Pretty Important (But Not So Important As the Last Section’s) Regression Results
- •A Multiple Regression Is Simple Too
- •Hypothesis Testing
- •Representing
- •What’s Left After You’ve Gotten the Most Out of Least Squares
- •Quick Review
- •Chapter 4. Data—The Transformational Experience
- •Your Basic Elementary Algebra
- •Simple Sample Says
- •Data Types Plain and Fancy
- •Numbers and Letters
- •Can We Have A Date?
- •What Are Your Values?
- •Relative Exotica
- •Quick Review
- •Chapter 5. Picture This!
- •A Simple Soup-To-Nuts Graphing Example
- •A Graphic Description of the Creative Process
- •Picture One Series
- •Group Graphics
- •Let’s Look At This From Another Angle
- •To Summarize
- •Categorical Graphs
- •Togetherness of the Second Sort
- •Quick Review and Look Ahead
- •Chapter 6. Intimacy With Graphic Objects
- •To Freeze Or Not To Freeze Redux
- •A Touch of Text
- •Shady Areas and No-Worry Lines
- •Templates for Success
- •Point Me The Way
- •Your Data Another Sorta Way
- •Give A Graph A Fair Break
- •Options, Options, Options
- •Quick Review?
- •Chapter 7. Look At Your Data
- •Sorting Things Out
- •Describing Series—Just The Facts Please
- •Describing Series—Picturing the Distribution
- •Tests On Series
- •Describing Groups—Just the Facts—Putting It Together
- •Chapter 8. Forecasting
- •Just Push the Forecast Button
- •Theory of Forecasting
- •Dynamic Versus Static Forecasting
- •Sample Forecast Samples
- •Facing the Unknown
- •Forecast Evaluation
- •Forecasting Beneath the Surface
- •Quick Review—Forecasting
- •Chapter 9. Page After Page After Page
- •Pages Are Easy To Reach
- •Creating New Pages
- •Renaming, Deleting, and Saving Pages
- •Multi-Page Workfiles—The Most Basic Motivation
- •Multiple Frequencies—Multiple Pages
- •Links—The Live Connection
- •Unlinking
- •Have A Match?
- •Matching When The Identifiers Are Really Different
- •Contracted Data
- •Expanded Data
- •Having Contractions
- •Two Hints and A GotchYa
- •Quick Review
- •Chapter 10. Prelude to Panel and Pool
- •Pooled or Paneled Population
- •Nuances
- •So What Are the Benefits of Using Pools and Panels?
- •Quick (P)review
- •Chapter 11. Panel—What’s My Line?
- •What’s So Nifty About Panel Data?
- •Setting Up Panel Data
- •Panel Estimation
- •Pretty Panel Pictures
- •More Panel Estimation Techniques
- •One Dimensional Two-Dimensional Panels
- •Fixed Effects With and Without the Social Contrivance of Panel Structure
- •Quick Review—Panel
- •Chapter 12. Everyone Into the Pool
- •Getting Your Feet Wet
- •Playing in the Pool—Data
- •Getting Out of the Pool
- •More Pool Estimation
- •Getting Data In and Out of the Pool
- •Quick Review—Pools
- •Chapter 13. Serial Correlation—Friend or Foe?
- •Visual Checks
- •Testing for Serial Correlation
- •More General Patterns of Serial Correlation
- •Correcting for Serial Correlation
- •Forecasting
- •ARMA and ARIMA Models
- •Quick Review
- •Chapter 14. A Taste of Advanced Estimation
- •Weighted Least Squares
- •Heteroskedasticity
- •Nonlinear Least Squares
- •Generalized Method of Moments
- •Limited Dependent Variables
- •ARCH, etc.
- •Maximum Likelihood—Rolling Your Own
- •System Estimation
- •Vector Autoregressions—VAR
- •Quick Review?
- •Chapter 15. Super Models
- •Your First Homework—Bam, Taken Up A Notch!
- •Looking At Model Solutions
- •More Model Information
- •Your Second Homework
- •Simulating VARs
- •Rich Super Models
- •Quick Review
- •Chapter 16. Get With the Program
- •I Want To Do It Over and Over Again
- •You Want To Have An Argument
- •Program Variables
- •Loopy
- •Other Program Controls
- •A Rolling Example
- •Quick Review
- •Appendix: Sample Programs
- •Chapter 17. Odds and Ends
- •How Much Data Can EViews Handle?
- •How Long Does It Take To Compute An Estimate?
- •Freeze!
- •A Comment On Tables
- •Saving Tables and Almost Tables
- •Saving Graphs and Almost Graphs
- •Unsubtle Redirection
- •Objects and Commands
- •Workfile Backups
- •Updates—A Small Thing
- •Updates—A Big Thing
- •Ready To Take A Break?
- •Help!
- •Odd Ending
- •Chapter 18. Optional Ending
- •Required Options
- •Option-al Recommendations
- •More Detailed Options
- •Window Behavior
- •Font Options
- •Frequency Conversion
- •Alpha Truncation
- •Spreadsheet Defaults
- •Workfile Storage Defaults
- •Estimation Defaults
- •File Locations
- •Graphics Defaults
- •Quick Review
- •Index
- •Symbols

Pretty Panel Pictures—283
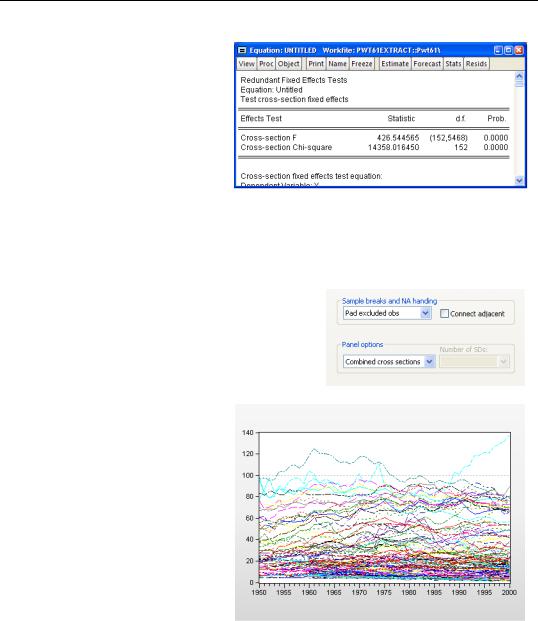
Since the results differ dramatically, it would be nice to have some assurance that the fixed effects are really there. Panel estimates include extra coefficient testing views. Choose
Fixed/Random Effects Testing/Redundant Fixed Effects - Likelihood Ratio. In this case, the statistical evidence, as shown by the p-value, is over-
whelmingly in favor of keeping fixed effects in the model.
Pretty Panel Pictures
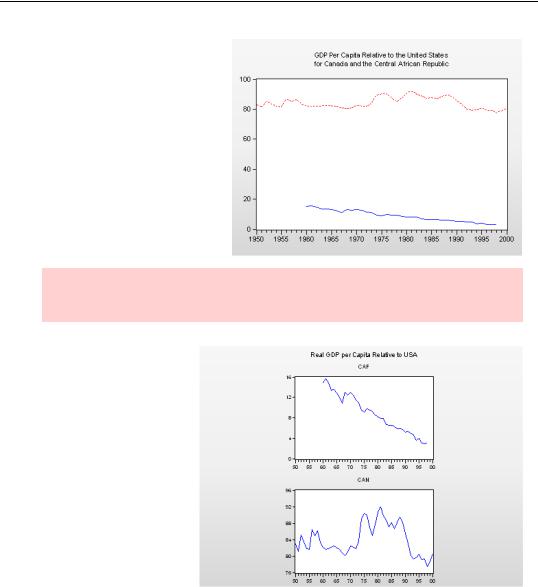
EViews offers extra ways of looking at the panel structured data—especially in graphs. When you select the Graph... view for data in a panel structured workfile, the dialog offers additional panel options in the bottom right corner.
Choosing Combined cross sections gives the figure to the right. Mean anything to you? Me neither. There are just too many darn lines in this picture.

284—Chapter 11. Panel—What’s My Line?
Looking at all possible cross sections isn’t always very informative. This is one case where too much data means too little information. Combined cross sections works much better when there are only a small number of countries. If we limit the sample to the Central African Republic and Canada, as we did above, the plot is much more informative.
Hint: EViews doesn’t produce a legend for this sort of graph by default. You can dou- ble-click on the graph, go to the legend portion of the dialog, and tell it do so.
Going through the same process, we can choose
Individual cross sections to get a different picture of the same data. Where the previous graph visually emphasized the difference in income levels between the Central African Republic and Canada, this graph is better at showing the relative trends over time.
More Panel Estimation Techniques
We’ve merely brushed the surface of the panel estimation techniques that EViews provides, discussing fixed effects models and a couple of panel-special graphing techniques. The EViews User’s Guide devotes an entire chapter to panel estimation. Here are a few items you may want to check out:

One Dimensional Two-Dimensional Panels—285
•Fixed effects in the time dimension, or in time and cross section simultaneously.
•Random effect models.
•A variety of procedures for estimating coefficient covariances.
•A variety of panel-oriented GLS (generalized least squares) techniques.
•Dynamic panel data estimation.
•Panel unit root tests.
One Dimensional Two-Dimensional Panels
Panels are designed for data that’s inherently two dimensional. Effectively, data are grouped by both cross section and time period. Grouping data is sometimes useful even when there is only one dimension to group along. In other words, sometimes it’s useful to pretend that data comes in a panel even when it doesn’t. In particular, this can be a useful trick for estimating separate intercepts for each group.
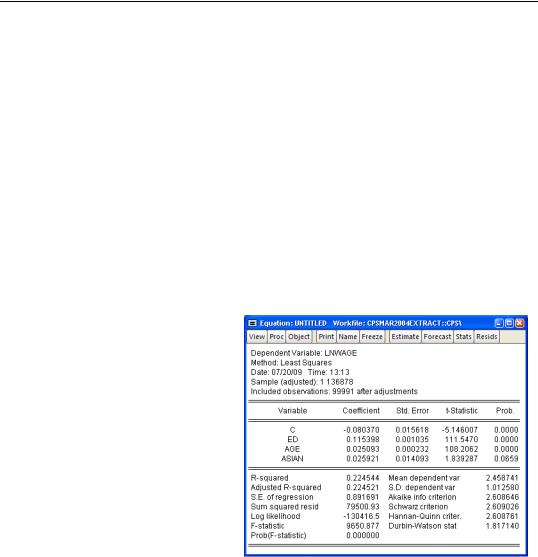
Information on wages (in logs), education (in years), age, race, and state was collected as part of the Current Population Survey (CPS) in March 2004. The workfile “CPSMAR2004extract.wf1” contains an extract with usable data for about 100,000 individuals. We can use this data to test the theory that Asians earn more than others after accounting for observable differences such as education and age. A standard method for looking at this kind of question is to regress wages on education, age and a dummy variable for being
Asian. We then ask whether the “Asian effect” is positive. Using the CPS data we get the results shown here.

286—Chapter 11. Panel—What’s My Line?
Junk science alert: Asian-Americans are an especially diverse socio-economic group. Other than the American tendency to use race to classify everything, it’s not clear why fourth and fifth generation Japanese-Americans should be lumped together with recent Hmong refugees. For a serious scientific investigation, we’d have to turn to a data source other than the CPS in order to get a more meaningful socio-economic breakdown.
Our regression results suggest that Asians earn two-and-a-half percent more than the rest of the population, after accounting for age and education (although the significance level is a smidgen short of the 5 percent gold standard). However, the Asian population isn’t distributed randomly across the United States. If Asians are relatively more likely to live in high wage areas, our regression might be unintentionally picking up a location effect rather than a race effect.
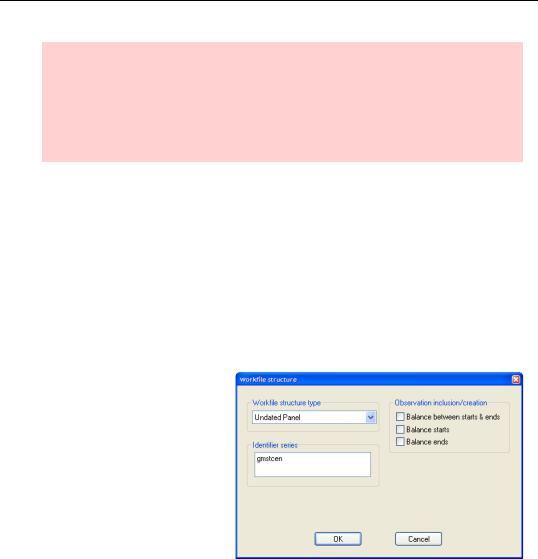
We can look at this issue by including dummy variables for the 51 states (DC too, eh?). This can be done directly (and we’ll do it directly in the next section) but it can be very convenient to pretend that each state identifies a cross section in a panel so that we can use EViews panel estimation tools. In other words, let’s fake a panel.
Double-click on Range to bring up the Workfile structure dialog. Set the dialog to Undated Panel—since there aren’t any dates—and uncheck Balance between starts and ends—since there isn’t anything to balance.
Now that we have a (pretend) panel, we can re-run the estimation and then use the estimation options to include cross section fixed effects.