


Chapter 10. Prelude to Panel and Pool
So far, our data has come in a simple, peaceful arrangement. Each series in a workfile begins at the first date in the workfile and ends at the last date in the workfile. What’s more, the existence of one series isn’t related to the existence of some other series. That is, the series may be related by economics and statistics, but EViews sees them as objects that just happen to be collected together in one place. To pick a prospicient example, we might have one annual data series on U.S. population and another on Canadian population. EViews doesn’t “understand” that the two series contain related observations on a single variable— population.
But it might be convenient if EViews did “understand,” no?
Not only does EViews have a way to tie together these sort of related series, EViews has two ways: panels and pools. Panels are discussed in depth in Chapter 11, “Panel—What’s My Line?” and we cover pools in Chapter 12, “Everyone Into the Pool.” Here we do a quick compare and contrast.
A panel can be thought of as a set of cross-sections (countries, people, etc.) where each place or person can be followed over time. Panels are widely used in econometrics.
A pool is a set of time-series on a single variable, observed for a number of places or people. Pools are very simple to use in EViews because all you need to do is be sure that series names follow a consistent pattern that tells EViews how to connect them with one another.
In other words, there’s a great deal of overlap between panels and pools. We look at an example and then discuss some of the nuances that help choose which is the better setup for a particular application.
Pooled or Paneled Population
We just happen to have annual data on U.S. and Canadian population. The workfile “Pop_Pool_Panel.wf1” contains a page named Pool with the pooled population and a page named Panel with the paneled population.
270—Chapter 10. Prelude to Panel and Pool
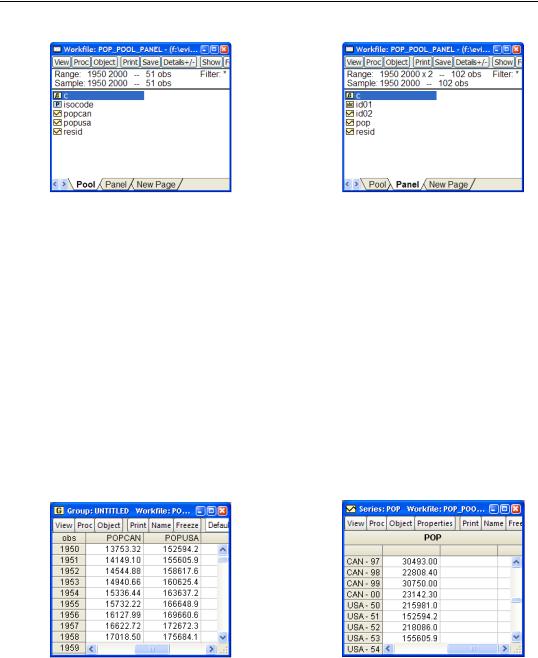
The picture on the left shows the pool approach, which is pretty straightforward. The data run for 51 years, stretching from 1950 through 2000. The two series, POPCAN and POPUSA, hold values for the Canadian and U.S. population, respectively. The object ISOCODE is called a pool. ISOCODE holds the words “CAN” and “USA,” to tell EViews that POPCAN and POPUSA are series measuring “POP” for the respective countries. In Chapter 12, “Everyone Into the Pool” we meet a variety of features accessed through the pool object that let you process POPCAN and POPUSA either jointly or separately. But if you didn’t care about the pool aspect you could treat the data as an ordinary EViews workfile. So one advantage of pools is that the learning curve is very low.
The picture on the right shows the panel approach, which introduces a kind of structure in the workfile that we haven’t seen before. The Range field now reads “1950 2000 x 2.” The data are still annual from 1950 through 2000, but the workfile is structured to contain two cross sections (Canada and the U.S.). All the population measurements are in the single series POP.
Here’s a quick peek at the data.
For the pooled data on the left, we see the first few observations for population for Canada and the U.S., each in its own series. The two series have (intentionally and usefully) similar names, but nothing is fundamentally different from what we’ve seen before.
Nuances—271
The panel on the right shows the single series, POP. But look at the row labels—they show both the country name and the year! The rows shown—we’ve scrolled to roughly the middle of the series—are the Canadian data for the end of the sample followed by the U.S. data for the early years. In a panel, the data for different countries are combined in a single series. We get the all the observations for the first country first, followed by all the observations for the second country. Unlike pools, the panels do introduce a fundamentally new data structure.
You can think of a pool as a sort of über-group. A pool isn’t a group of series, but it is a set of identifiers that can be used to bring any set of series together for processing. If our workfile had also included the series GDPCAN and GDPUSA, the same ISOCODE pool that connects POPCAN and POPUSA would also connect GDPCAN and GDPUSA. In a panel in contrast, the structure of the data applies to all series in the workfile.
One way to think about the difference between the two structures is seen in the steps needed to include a particular cross section in an analysis. For a panel, all cross sections are included—except for ones you exclude through a smpl statement. In a pool, only those cross sections identified in the pool are included and a smpl statement is used only for the time dimension. The flip side of this is that a panel has one fundamental structure built into the workfile, while in the pool setup you can define as many different pool objects as you like.
Historical hint: Pools have been part of EViews for a long time, panels are a relatively new feature.
Nuances
If you’re thinking that pools are easier to learn about, you’re absolutely right. But panels provide more powerful tools.
Hint: Pools are designed for handling a modest number of time series bundled together, while panels are better for repeated observations on large cross sections. One rule of thumb is that data in which an individual time series has an “interesting” identity (Canada, for example) is likely to be a candidate to be treated as a pool, while large, anonymous (e.g., survey respondent #17529) cross sections may be better analyzed as a panel.
Here’s another rule of thumb:
•If you think of yourself as a “time-series person” you’ll probably find pools the more natural concept, but if you’re a “cross-section type” then try out a panel first.
Here’s a practical rule:
272—Chapter 10. Prelude to Panel and Pool
•If the number of cross sections is really large, you pretty much have to use a panel. What’s “really large?” Remember that in a pool each cross-section element has a series for every variable. If the cross section is large enough that typing the names of all the countries (people, etc.) is painful, you should probably use a panel.
Hint: The similarities between pools and panels are greater than the differences, and in any event, it’s not hard to move back-and-forth between the two forms of organization.
So What Are the Benefits of Using Pools and Panels?
We’ll spend the next two chapters answering this question. The big answer is that you can control for common elements across observations—or not—as you choose. The smaller answer is that all sorts of data manipulation are made easier because EViews understands how different observations are tied together.
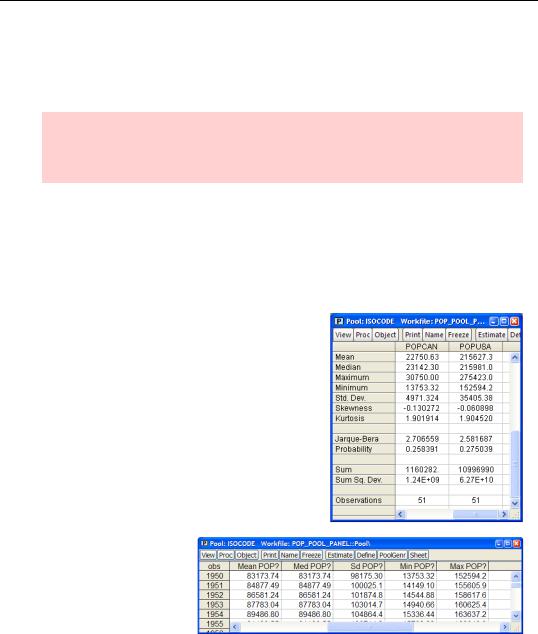
As a quick example from the poolside, here’s a set of descriptive statistics done for each country for the whole time series. What’s more, it would have been no more trouble to produce these statistics for 20 countries than it was for two.
With one click of a different button, we can get descriptive statistics done for each year for all (two) countries grouped together.
Quick (P)review
If you have a cross-section of time series, put them into a pool. If you have repeated observations on cross-section elements, set up a panel.

Quick (P)review—273
Now that you’ve had a quick taste, proceed to Chapter 11, “Panel—What’s My Line?” and Chapter 12, “Everyone Into the Pool” to get the full flavor.

274—Chapter 10. Prelude to Panel and Pool