

Links—The Live Connection—251
Paste Special
Sometimes the default frequency conversion method isn’t suitable. Instead of using Paste to paste a series, use Paste Special to bring up all the available conversion options. Drag-and-dropping after right-click selecting will also bring up the
Paste Special menu.
You can choose the conversion method from the fields on the right. In addition, you can enter a new name for the pasted series in the field marked Pattern.
Nothing limits copy-and-paste or copy-and-paste-special to a single series. The Pattern field lets you specify a general pattern for changing the name of the pasted series. For example, the pattern “*_quarterly” would paste the series X, Y, and Z as X_quarterly, Y_quarterly, and Z_quarterly. For further discussion, see the User’s Guide.
Links—The Live Connection
Copies of data and the original source are related conceptually, but mechanically they’re completely unlinked. Humans understand that a quarterly series for industrial production represents a view of an underlying monthly IP series. But as a mechanical matter, once the copying is done EViews no longer sees any connection between the quarterly data and the original monthly data. A practical consequence of this is that if you change the monthly source data—perhaps because of data revisions, perhaps because you discovered a typo— the derived quarterly data are unaffected. In contrast, EViews uses the concept of a “link” to create a live connection between series in two pages.
A link is a live connection. If you define a quarterly IP series as a link to the monthly IP series, EViews builds up an internal connection instead of making a copy of the data. Every time you use the quarterly series EViews retrieves the information from the monthly original, making any needed frequency conversions on the fly. Any change you make to the original will appear in the quarterly link as well.
Aesthetic hint: The icon for a series link,  , looks just like a regular series icon, except it’s pink. If the link inside the series link is undefined or broken, you’ll see a pink icon with a question mark,
  .
.
252—Chapter 9. Page After Page After Page
Inconsequential hint: Links save computer memory because only one copy of the data is needed. They use extra computer time because the linked data has to be regenerated each time it’s used. Modern computers have so much memory and are so fast that these issues are rarely of any consequence.
Links can be created in three ways:
•Copy/Extract from Current Page/By Link to New Page… creates a new page from the active page, linking the new series to the originals on a wholesale basis.
•Paste Special provides an option to paste in from the clipboard by linking instead of making copies of the original EViews series.
•Type the command link to link in just one series.
Wholesale Link Creation
We looked at the copy part of Copy/Extract from Current Page in the section Creating New Pages. We turn now to the By Link to New Page… option.
By Link to New Page… works just like Value to New Page or Workfile… except that links are made for each series instead of copying the values into disconnected series in the destination page. That’s it.
Hint: You can link between pages inside a workfile but not across different workfiles.
One-Or-More-At-A-Time Link Creation
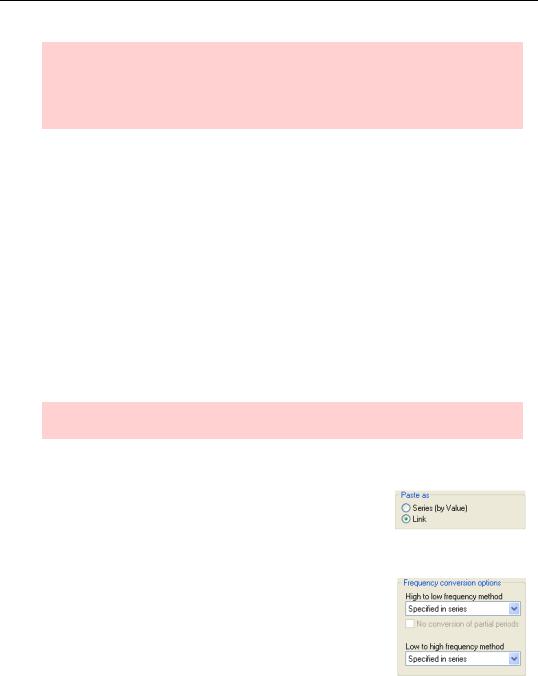
The most common way of creating a link is by copying series on one page and then pasting special on the destination page. Inside the Paste Special dialog, choose Link in the Paste as field. Links for the series, with frequency conversions as specified, will be placed in the destination page.
Note that Copy/Extract from Current Page always uses the default frequency conversion for each series. Paste Special has the same default behavior, but provides an opportunity in the
Frequency conversion options field to make an idiosyncratic choice.
Links—The Live Connection—253
Hint: If you’ve copied multiple series onto the clipboard, you can use the |
|
, |
||||||
|
||||||||
|
|
, |
|
, and |
|
buttons in the Paste Special dialog to paste the |
||
series in one at a time or to paste them in all at once. |
|
|
||||||
|
|
|
|
|
|
|
|
|
Retail Link Creation
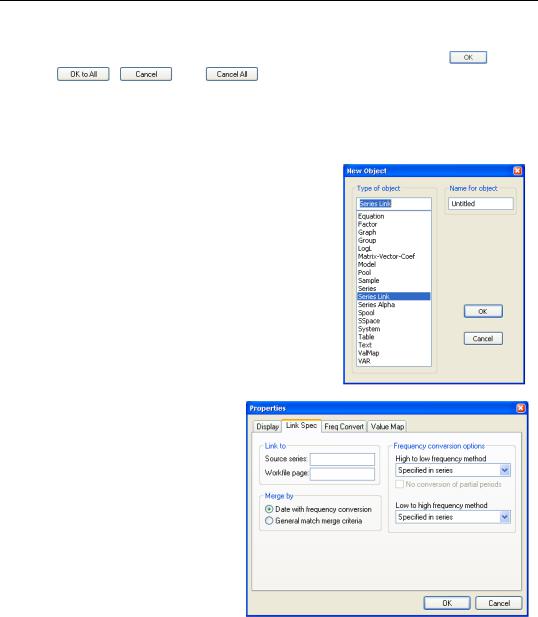
The methods above begin with an existing series, or a whole handful of existing series, and create links from them. You can also create a link in the active page by choosing the Object menu or the  button and selecting New Object…/Series Link. Or you can type link in the command pane, optionally followed by a name for the link. If you specify a name, a new link appears in the workfile window, although the link isn’t yet actually linked to anything. (If you don’t specify a name, EViews pops open a view window for the new link and displays an annoying error message “*** Unable to Perform Link ***.” Ignore the message and switch to the Properties… view.)
Click on the  button, switch to the Link Spec tab, and enter the source series and source workfile page in the Link to field. You can also specify the frequency method conversion to be used in the Frequency conversion options field.
Auto-Link
Or, you might not need to create a link object in your workfile page at all. Anywhere that you can use a series, you can also use a series from another workfile page. If you are creat-
254—Chapter 9. Page After Page After Page
ing a link for use in an equation or expression, you can reference the series in another page by name, using the form: workfile_page_name\series_name.
For example, say you have a workfile with two pages, MYPAGE1 and MYPAGE2, where the first page has a series Y and the second page has a series X. If you want the values of Y to be log(X), you can simply type
Y = log(mypage2\X)
in the command pane. EViews will take the log values of X from MYPAGE2, and initialize Y in MYPAGE1 accordingly. And you haven’t cluttered your workfile with an extra link series.
If frequency conversion between the pages is necessary, default frequency conversion will be used.
Unlinking
Suppose that the data in your source page is regularly updated, but you want to analyze a snapshot taken at a point in time in the destination page. To freeze the values being linked in, open the link and choose  or
or  and Unlink…. Alternatively, with the workfile window active choose
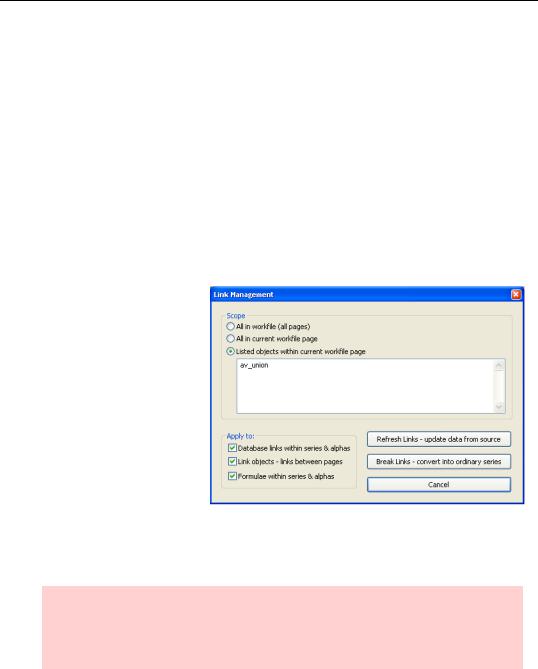
Object/Manage Links & Formulae…. The dialog lets you manage links and formulae in your workfile. The
Break Links - convert into ordinary series button, detaches the specified links from their source data and converts them into regular numeric or alpha series using the current values. in all links or just those you list.
Hint: Of course, you can use the series command:
series frozen_copy_of_series = linked_series
to make a copy of a linked series as an alternative to breaking the link.