

Добавил:
Upload
Опубликованный материал нарушает ваши авторские права? Сообщите нам.
Вуз:
Предмет:
Файл:EViews Guides BITCH / EViews_Illustrated.pdf
X
- •Table of Contents
- •Foreword
- •Chapter 1. A Quick Walk Through
- •Workfile: The Basic EViews Document
- •Viewing an individual series
- •Looking at different samples
- •Generating a new series
- •Looking at a pair of series together
- •Estimating your first regression in EViews
- •Saving your work
- •Forecasting
- •What’s Ahead
- •Chapter 2. EViews—Meet Data
- •The Structure of Data and the Structure of a Workfile
- •Creating a New Workfile
- •Deconstructing the Workfile
- •Time to Type
- •Identity Noncrisis
- •Dated Series
- •The Import Business
- •Adding Data To An Existing Workfile—Or, Being Rectangular Doesn’t Mean Being Inflexible
- •Among the Missing
- •Quick Review
- •Appendix: Having A Good Time With Your Date
- •Chapter 3. Getting the Most from Least Squares
- •A First Regression
- •The Really Important Regression Results
- •The Pretty Important (But Not So Important As the Last Section’s) Regression Results
- •A Multiple Regression Is Simple Too
- •Hypothesis Testing
- •Representing
- •What’s Left After You’ve Gotten the Most Out of Least Squares
- •Quick Review
- •Chapter 4. Data—The Transformational Experience
- •Your Basic Elementary Algebra
- •Simple Sample Says
- •Data Types Plain and Fancy
- •Numbers and Letters
- •Can We Have A Date?
- •What Are Your Values?
- •Relative Exotica
- •Quick Review
- •Chapter 5. Picture This!
- •A Simple Soup-To-Nuts Graphing Example
- •A Graphic Description of the Creative Process
- •Picture One Series
- •Group Graphics
- •Let’s Look At This From Another Angle
- •To Summarize
- •Categorical Graphs
- •Togetherness of the Second Sort
- •Quick Review and Look Ahead
- •Chapter 6. Intimacy With Graphic Objects
- •To Freeze Or Not To Freeze Redux
- •A Touch of Text
- •Shady Areas and No-Worry Lines
- •Templates for Success
- •Point Me The Way
- •Your Data Another Sorta Way
- •Give A Graph A Fair Break
- •Options, Options, Options
- •Quick Review?
- •Chapter 7. Look At Your Data
- •Sorting Things Out
- •Describing Series—Just The Facts Please
- •Describing Series—Picturing the Distribution
- •Tests On Series
- •Describing Groups—Just the Facts—Putting It Together
- •Chapter 8. Forecasting
- •Just Push the Forecast Button
- •Theory of Forecasting
- •Dynamic Versus Static Forecasting
- •Sample Forecast Samples
- •Facing the Unknown
- •Forecast Evaluation
- •Forecasting Beneath the Surface
- •Quick Review—Forecasting
- •Chapter 9. Page After Page After Page
- •Pages Are Easy To Reach
- •Creating New Pages
- •Renaming, Deleting, and Saving Pages
- •Multi-Page Workfiles—The Most Basic Motivation
- •Multiple Frequencies—Multiple Pages
- •Links—The Live Connection
- •Unlinking
- •Have A Match?
- •Matching When The Identifiers Are Really Different
- •Contracted Data
- •Expanded Data
- •Having Contractions
- •Two Hints and A GotchYa
- •Quick Review
- •Chapter 10. Prelude to Panel and Pool
- •Pooled or Paneled Population
- •Nuances
- •So What Are the Benefits of Using Pools and Panels?
- •Quick (P)review
- •Chapter 11. Panel—What’s My Line?
- •What’s So Nifty About Panel Data?
- •Setting Up Panel Data
- •Panel Estimation
- •Pretty Panel Pictures
- •More Panel Estimation Techniques
- •One Dimensional Two-Dimensional Panels
- •Fixed Effects With and Without the Social Contrivance of Panel Structure
- •Quick Review—Panel
- •Chapter 12. Everyone Into the Pool
- •Getting Your Feet Wet
- •Playing in the Pool—Data
- •Getting Out of the Pool
- •More Pool Estimation
- •Getting Data In and Out of the Pool
- •Quick Review—Pools
- •Chapter 13. Serial Correlation—Friend or Foe?
- •Visual Checks
- •Testing for Serial Correlation
- •More General Patterns of Serial Correlation
- •Correcting for Serial Correlation
- •Forecasting
- •ARMA and ARIMA Models
- •Quick Review
- •Chapter 14. A Taste of Advanced Estimation
- •Weighted Least Squares
- •Heteroskedasticity
- •Nonlinear Least Squares
- •Generalized Method of Moments
- •Limited Dependent Variables
- •ARCH, etc.
- •Maximum Likelihood—Rolling Your Own
- •System Estimation
- •Vector Autoregressions—VAR
- •Quick Review?
- •Chapter 15. Super Models
- •Your First Homework—Bam, Taken Up A Notch!
- •Looking At Model Solutions
- •More Model Information
- •Your Second Homework
- •Simulating VARs
- •Rich Super Models
- •Quick Review
- •Chapter 16. Get With the Program
- •I Want To Do It Over and Over Again
- •You Want To Have An Argument
- •Program Variables
- •Loopy
- •Other Program Controls
- •A Rolling Example
- •Quick Review
- •Appendix: Sample Programs
- •Chapter 17. Odds and Ends
- •How Much Data Can EViews Handle?
- •How Long Does It Take To Compute An Estimate?
- •Freeze!
- •A Comment On Tables
- •Saving Tables and Almost Tables
- •Saving Graphs and Almost Graphs
- •Unsubtle Redirection
- •Objects and Commands
- •Workfile Backups
- •Updates—A Small Thing
- •Updates—A Big Thing
- •Ready To Take A Break?
- •Help!
- •Odd Ending
- •Chapter 18. Optional Ending
- •Required Options
- •Option-al Recommendations
- •More Detailed Options
- •Window Behavior
- •Font Options
- •Frequency Conversion
- •Alpha Truncation
- •Spreadsheet Defaults
- •Workfile Storage Defaults
- •Estimation Defaults
- •File Locations
- •Graphics Defaults
- •Quick Review
- •Index
- •Symbols
238—Chapter 8. Forecasting
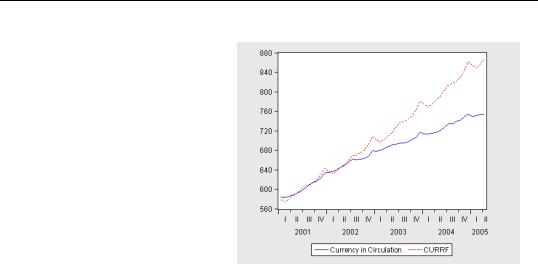
Our currency forecast is shown to the right. Note that the forecast turns out to be a little too high.
Quick Review—Forecasting
EViews is in charge of the mechanics of forecasting; you’re in charge of figuring out a good model. You need to think a little about in-sample versus out-of-sample forecasts and dynamic versus static forecasts. Past that, you need to know how to push the  button.
Соседние файлы в папке EViews Guides BITCH