

Chapter 6. Intimacy With Graphic Objects
EViews does a masterful job of creating aesthetically pleasing graphs. But sometimes you want to tweak the picture to get it “just so,” choosing custom labeling, axes, colors, etc. In this chapter we get close-up and intimate with EViews graphics.
We organize our tweaking exploration around four buttons in the graph window:  ,
,  ,
,  , and
, and  , ordered from easiest to most sophisticated. This last button,
  , brings up the Graph Options dialog, which itself has well over a dozen sections.
If you prefer, you can reach the
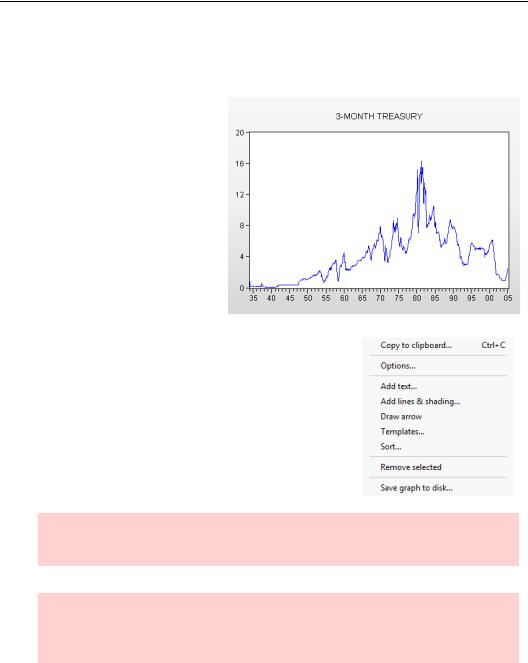
same features by right-clicking anywhere in the graph window and choosing from the context menu. The same menu, along with a few others features, pops up if you click on the  button.
The menu provides an editing feature that isn’t replicated with a button: Draw arrow.
Hint: Double-click on almost anything in a graphics window and the appropriate dialog will pop open, presenting you with the options available for fine-tuning.
Hint: Double-click on nothing in a graphics window (i.e. in a blank spot) and the Graph Options dialog will pop open. This is probably the easiest way to reach all the fine-tuning options.
168—Chapter 6. Intimacy With Graphic Objects
Hint: Single-click on almost any thing in a graphics window and hit the Delete key to make the thing disappear. Be careful—there’s no undo and no “Are you sure?” alert.
To Freeze Or Not To Freeze Redux
You’ll remember from the last chapter that a graph in a series or group window can be frozen to create a graph window. Freezing can be done with updating turned on or updating turned off; freezing with updating turned off severs the graph from the original data.
In general, it’s better to freeze a graph before fine tuning. One option discussed in the current chapter, sorting, is only available after freezing with updating turned off. On the other hand, some functions that you might think of as fine tuning EViews regards as part of the graph creation process. Adding axis borders is one example. These don’t work once a graph is frozen with updating turned off.
Hint: I find it convenient to freeze a graph before fine tuning, but to leave the original series or group window open until I’m sure I won’t need to make any changes that don’t work on completely frozen graphs. Alternately, you can freeze the graph with updating turned on, and make desired changes. If you’d like, you can then copy the result or turn updating off once you are certain that you are done.
Hint: To make side-by-side comparisons of different visual representations of a given set of data, you have to freeze at least one window because you can only have a single view open of a series or group. Freezing creates a new graph object, detached from the original view.
A Touch of Text
Since adding text is the easiest touch-up, we’ll start there.
Hint: As you know, you must freeze a graph before you can add text to it.
A Touch of Text—169
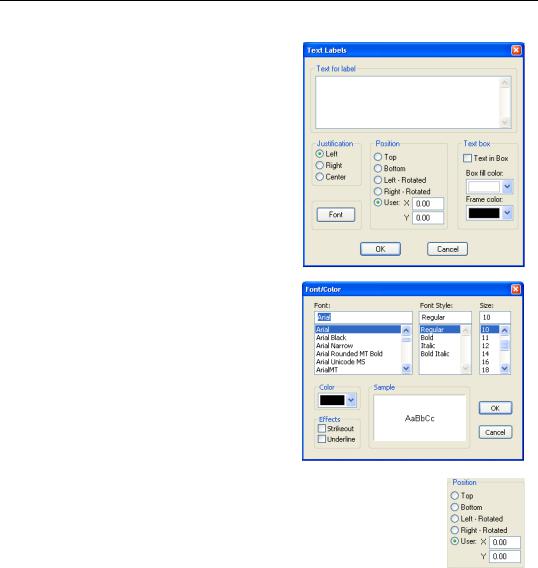
Clicking  opens the Text Labels dialog. Enter the desired text, pick a location, and hit
  . Note that the Enter key is intentionally not mapped to the
  button, so that you can enter multi-line labels by ending lines with Enter.
The options on the dialog mean pretty much just what they say. Justification lets you specify left, right, or center justification when there are multiple lines in a single label.
The  button opens the Font/Color dialog which has pretty standard options. The checkbox Text in Box, and the Box fill color: and Frame color: dropdowns are also used in the obvious way.
The Position field is worth a comment or
two. Left-Rotated and Right-Rotated tilt text 90 degrees so. The default position, User:, sticks the text inside the frame of the graph itself. The location is measured in “virtual inches” (see “Frame & Size” on
page 182) with positive numbers moving down and to the right. Frankly, sometimes it’s easiest to just stick the text any old place and then use the mouse to re-position it.
170—Chapter 6. Intimacy With Graphic Objects
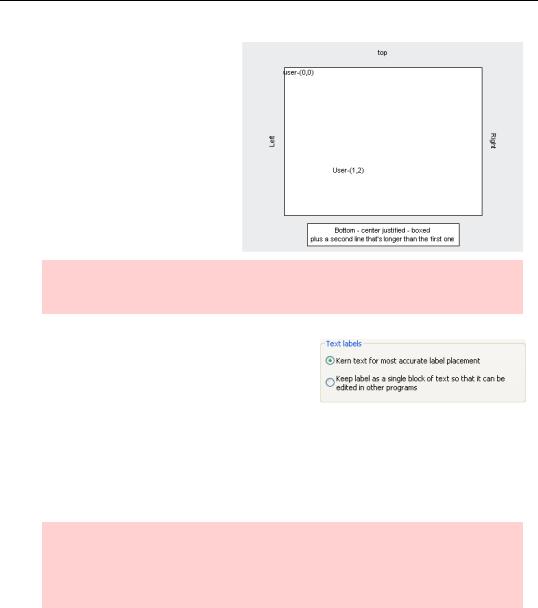
The figure to the right shows labels in a variety of positions. Take note that the default positioning is User:. You’ll probably find yourself most often adding text to put a title on the top or bottom of the graph. Since EViews frequently sticks a legend at the bottom of the graph, you may find it best to place the title at the top.
Hint: The six custom text items in the illustration were added by clicking  six times.
EViews goes to a lot of trouble to make text look nice. Each letter is carefully placed for the best appearance. A side effect of this extra care is that other programs may have trouble editing text included inside graphs copied-and-pasted from EViews. Sometimes trouble can be avoided, or at
least mitigated, by changing the graphics default through the menu Options/Graphics Defaults…, clicking the Exporting section and setting Text labels to Keep label as a single block of text so that it can be edited in other programs. Unfortunately, even this isn’t guaranteed to work with one very popular Word processing program. The moral is: try to completely polish your graphic in EViews before exporting it.
Hint: The Text Labels dialog is for the text you add to the graphic. Text placed by EViews, such as legends and axis labels, is adjusted through the Graph Options dialog. Uh, except for the occasional automatically generated title, which is tweaked through Text Labels. Not to worry, double-click on text and the appropriate dialog opens.