

164—Chapter 5. Picture This!
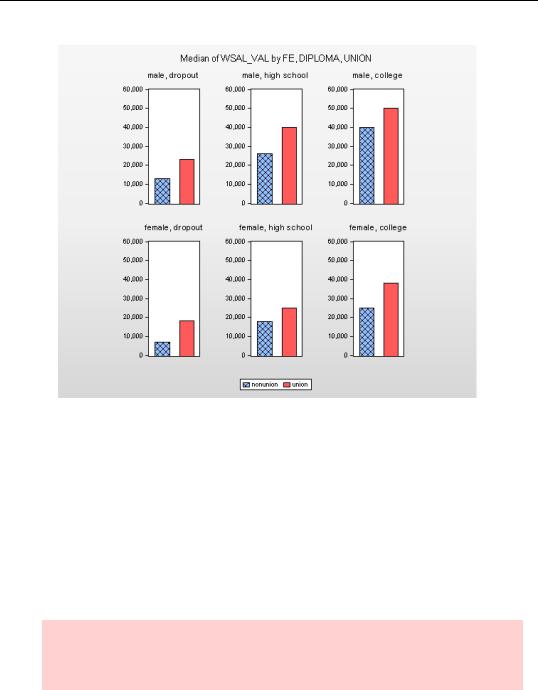
The second item worth knowing about this dialog is that it uses @series as a special keyword. You can see an example in the dialog on page 162. When a graph has multiple series, EViews will treat data coming from one series versus another analogously with data within a series coming from one category versus another. In other words, the list of series can be treated like an artificial categorical variable for arranging graph layouts. (Just as we saw in Multiple Series as Factors.) The keyword @series is used to identify the list of series in the graph.
Togetherness of the Second Sort
At this point you know lots of ways to create graphs. Graphs, however created, are easily combined into a new, single graph.
Hint: Remember that a graph view of a series or group isn’t a graph object. A graph object, distinguished by the  icon, is most commonly created by freezing a graph view.
Togetherness of the Second Sort—165
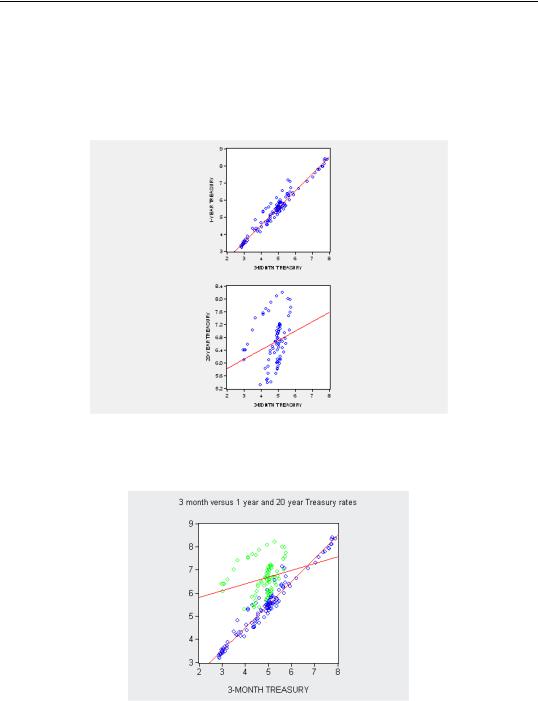
Select the graph objects you want to combine just as you would select series for a group, or use the show command, as in:
show tm3_ty01 tm3_ty20
where tm3_ty01 tm3_ty20 are names of graphs stored in the workfile, to open a new graph object.
Using the mouse, you can re-arrange the position of the subgraphs within the overall graph window. This allows you to produce some very interesting effects. For example, if you have two graphs with identical axes, you can superimpose one on the other.

166—Chapter 5. Picture This!
You’ll note that this last picture has been messed with some: colors, titles, and axes have changed. Such messing around techniques are covered in Chapter 6, “Intimacy With Graphic Objects.”
Quick Review and Look Ahead
EViews makes visually pleasing graphs quite easily. All you need do is open a series or a group and choose from the wide variety of graph types available. A variety of summary statistics can be graphed as easily as raw data. You can also have EViews make individual plots for data falling into different categories. Customizing graphs by adding text or changing colors is similarly easy.
If your visual needs have been satisfied, then this chapter is all you need to know about graphics. If more control is your style, then the next chapter will make you very happy.