

100—Chapter 4. Data—The Transformational Experience
series overallmean = @mean(y)
series samplemean1 = @mean(y,s2)
series samplemean2 = @mean(y,"@first+1 @last if y=y(-1)")
OVERALLMEAN gives the mean of Y taken over all observations. SAMPLEMEAN1 takes the mean of those observations included in S2, as does SAMPLEMEAN2.
Data Types Plain and Fancy
Series hold either numbers or text. That’s it.
Except that sometimes numbers aren’t numbers, they’re dates. And sometimes the numbers or text you see aren’t there at all because you’re looking at a value map instead. We’ll start simply with numbers and text and then let the discussion get a teeny bit more complicated.
Numbers and Letters
As you know, the command series creates a new data series, each observation holding one number. Series icons are displayed with the series icon,  . EViews stores numbers with about 16 digits of accuracy, using what computer types call double precision.
Computer hint: Computer arithmetic is not perfect. On very rare occasion, this matters.
Data hint: Data measurement is not perfect. On occasion, this matters a lot.
Numbers and Letters—101
Number Display
By default, EViews displays numbers in a format that’s pretty easy to read. You can change the format for displaying a series through the Properties dialog of the spreadsheet view of the series. Check boxes let you use a thousands separator (commas are the default), put negative values in parentheses (often used for financial data), add a trailing “%” (doesn’t change the value displayed, just adds the percent sign), or use a comma to separate the integer and decimal part of the number.
Hint: Click on a cell in the spreadsheet view to see a number displayed in full precision in the status line at the bottom of the EViews window.
The Numeric display dropdown menu in the dialog provides options in addition to the default Fixed characters. Significant digits drops off trailing zeros after the decimal. Using Fixed decimal, you can pick how many places to show after the decimal. For example, you might choose two places after the decimal for data measured in dollars and cents. Scientific notation (sometimes called engineering notation) puts one digit in front of the decimal and includes a power of ten. For example, 12.05 would appear as
1.205E01. Percentage displays numbers as percentages, so 0.5 appears as 50.00. (To add a “%” symbol, check the Trailing % checkbox.) Fraction displays fractions rather than deci-
102—Chapter 4. Data—The Transformational Experience
mals. This can be especially useful for financial data in which prices were required to be rounded. For example, “10 1/8” rather than “10.125”.
EViews saves any display changes you make in the series window Properties dialog Display tab and uses them whenever you display the series. Remember that the Properties dialog changes the way the number is displayed, not the underlying value of the number.
Hint: To change the default display, use the menu Options/Spreadsheet Defaults…. See Chapter 18, “Optional Ending.”
Letters
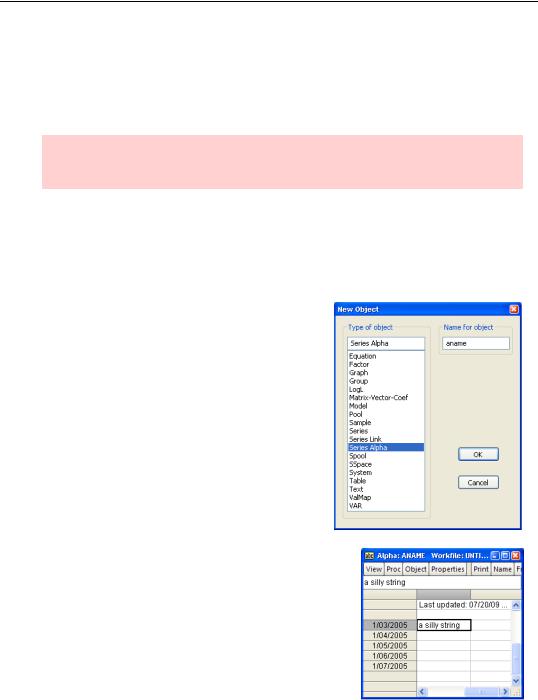
EViews’ second major data type is text data, stored in an alpha series displayed with the  icon. You create an alpha series by typing the command:
alpha aname
or using the Object/New Object…/Series Alpha menu.
Double-clicking an alpha series opens a spreadsheet view which you can edit just as you would a numeric series.
Numbers and Letters—103
Hint: If you use text in the command line, be sure to enclose the text in quotes. For example,
alpha alphabet = "abc's"
To include a quote symbol in a string as part of a command, use a pair of quotes. To create a string consisting of a single double quote symbol write:
alpha singledoublequote = """"
Hint: Named auto-series defined using frml work for alpha series just as they do for numeric series.
Alpha series have two quirks that matter once in a great while. The first quirk is that the “not available” code for alpha series is the empty string, “”, rather than NA. Visually, it’s difficult to tell the difference between an empty string and a string holding nothing but one or more spaces. They both have a blank look about them.
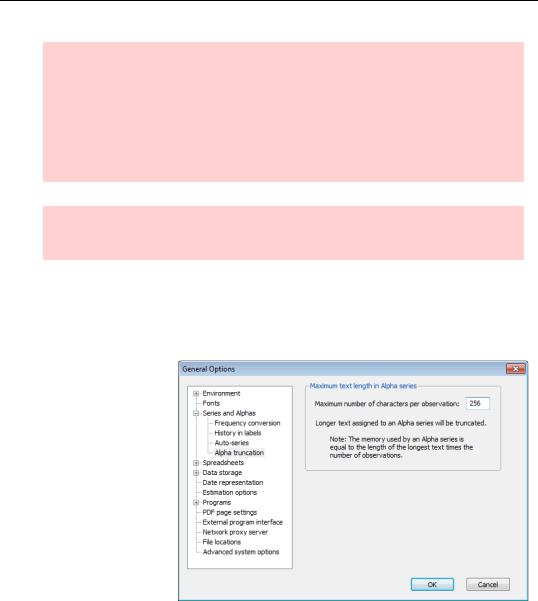
The second quirk is that all alpha series in EViews share a maximum length. Strings with more than the maximum permitted characters are truncated. By default, 40 characters are permitted. While you can’t change the truncation limit for an individual series, you can change the default through the
General Options/Series and Alphas/Alpha truncation dialog. And you should. Again, see Chapter 18, “Optional Ending.”
104—Chapter 4. Data—The Transformational Experience
String Functions
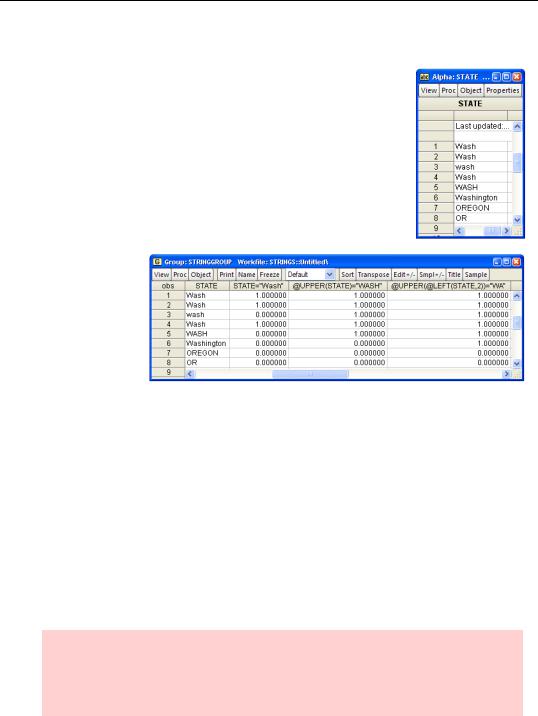
String functions are documented in the Command and Programming Reference. An example here gives a taste. The series STATE contains state names. Unfortunately, spellings vary.
Consider the following expressions:
show state state="Wash" @upper(state)="WASH" @upper(@left(state,2))="WA"
The group window shows the results of all three comparisons. ‘state= "Wash"’ is true for observations 1, 2, and 4 (“Wash”), but
not for the third or fifth observation (“wash” and “WASH”), because upper and lower case letters are not equal. The next comparison uses the function @upper, which produces an uppercase version of a string, to pick up observations 1 through 5 by making the comparison using data converted to uppercase. Both upper and lower case are changed to upper case before the comparison is made.
Converting everything to upper or lower case before making comparisons is a useful trick, but doesn’t help with fundamentally different spellings such as “Wash” and “Washington.” For this particular set of data, all spellings of Washington begin with “wa” and the spelling of no other state begins with “wa.” So various spellings can be picked out by looking only at the first two letters (in uppercase), which is what the function @left(state,2) does for us. (@left(a,n) picks out the first n letters of string a. EViews provides a comprehensive set of such functions. As we said above, see Appendix F of the Command and Programming Reference.)
Embarrassing revelation: I once spent weeks on a consulting project producing wrong answers because I didn’t realize “Washington” had been spelled about half a dozen different ways. The first few hundred observations that I checked visually all had the same spelling and I didn’t think to check further.
Numbers and Letters—105
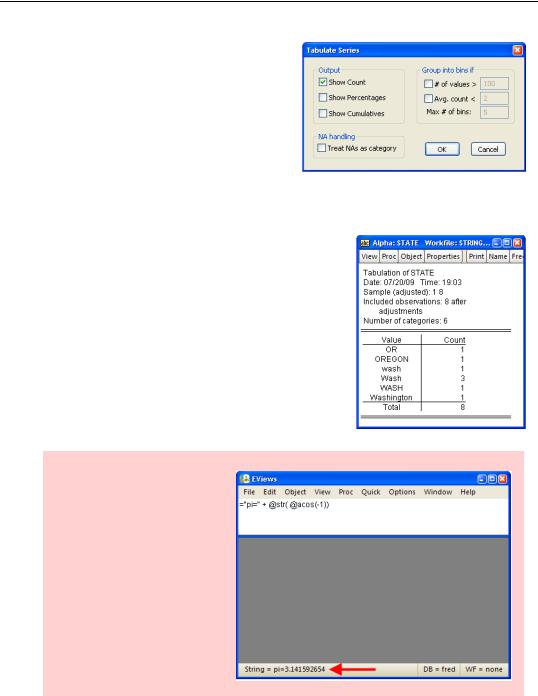
There’s no general procedure for comparing strings by meaning rather than spelling, although the @youknowwhatimeant function is eagerly awaited in a future release. In the meantime, the One-Way Tabulation… view (see Chapter 7, “Look At Your Data”) gives a list of all the unique values of a series. This offers a quick check for various spellings for alpha series where a limited number of values are expected, as is true of state names.
Uncheck the boxes in the Tabulate Series dialog except for Show Count.
The view that pops up gives a nicely alphabetized list of spellings.
One more string function is very useful, but doesn’t look like a function. When used between alpha series, “+” means concatenate. Thus the command
="a"+"b"+"c"
gives the string “abc”.
Hint: Typing an equal sign followed by an expression turns EViews into a nice desk calculator. Results are shown in the status line at the bottom of the EViews window.