


56—Chapter 2. EViews—Meet Data
ful if the data are in a spreadsheet or a text file. It uses dialogs similar to the dialogs for
Spreadsheet Read or ASCII Read from File/Open/Foreign Data as Workfile…
One more clipboard alternative makes you do more work, but gives you a good deal of manual control. Use the Quick menu at the top of the EViews menu bar for the command Quick/Edit Group (Empty Series). As you might infer from the suggestive name, this brings up an empty group window all ready for you to enter data for one or more series. You can paste anywhere in the window. Essentially you are working in a spreadsheet view, giving you complete manual control over editing. This is handy when you only have part of a series or when you’re gluing together data from different sources.
Among the Missing
Mostly, data are numbers. Sometimes, data are strings of text. Once in a while, data ain’t…
In other words, sometimes you just don’t know the value for a particular data point—so you mark it NA.
Statistical hint: Frequently, the best thing to do with data you don’t have is nothing at all. EViews’ statistical procedures offer a variety of options, but the usual default is to omit NA observations from the analysis.
How do you tell EViews that a particular observation is not available? If you’re entering data by typing or copy-and-paste, you don’t have to tell EViews. EViews initializes data to NA. If you don’t know a particular value, leave it out and it will remain marked NA.
The harder issue comes when you’re reading data in from existing computer files. There are two separate issues you may have to deal with:
•How do you identify NA values to EViews?
•What if multiple values should be coded NA?
Reading NAs from a file
There are a couple of situations in which EViews identifies NAs for you automatically. First, if EViews comes across any nonnumeric text when it’s looking for a number, EViews converts the text to NA. For example, the data string “1 NA 3” will be read as the number 1, an NA, and the number 2. The string “1 two 3” will be read the same way—there’s nothing magic about the letters “NA” when they appear in an external file. Second, EViews will usually pick up correctly any missing data codes from binary files created by other statistical programs.
If you have a text file (or an Excel file) which has been coded with a numerical value for NA—“-999” and “0” are common examples—you can tell EViews to translate these into NA
Quick Review—57
by filling out the field Text representing NA in the dialog used to read in the data. EViews allows only one value to be automatically translated this way.
Reading alpha series with missing values is slightly more problematic, because any string of characters might be a legitimate value. Maybe the characters “NA” are an abbreviation for North America! For an alpha series, you must explicitly specify the string used to represent missing data in the Text representing NA field.
Handling multiple missing codes
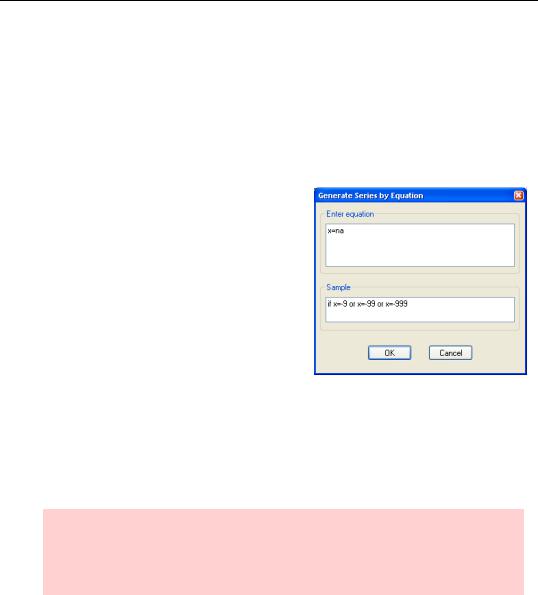
Some statistical programs allow multiple values to be considered missing. Others, EViews being a singular example, permit only one code for missing values. Suppose that for some variable, call it X, the values -9, -99, and -999 are all suppose to represent missing data. The way to handle this in EViews is to read the data in without specifying any values as missing, and then to recode the data. In this example, this could be done by choosing Quick/Generate Series… and then using the Generate Series by Equation dialog to set the sample to include just those values of x that you want recoded to NA.
If you prefer, you can accomplish the same task with the recode command, as in:
x=@recode(x=-9 or x=-99 or x=-999, NA, x)
If the logical condition in the first argument of @recode is true (X is missing, in this example), the value of @recode is the second argument (NA), otherwise it’s the third argument
(X).
Hint: It might be wiser to make a new series, say XRECODE, rather than change X itself. This leaves open the option to treat the different missing codes differently at a later date. If you change X, there’s no way later to recover the distinct -9, -99, and -999 codes.
Quick Review
The easiest way to get data into EViews is to read it in from an existing data file. EViews does a great job of interpreting data from spreadsheet and text files, as well as reading files created by other statistical programs.

58—Chapter 2. EViews—Meet Data
Whether reading from a file or typing your data directly into an EViews spreadsheet, think of the data as being arranged in a rectangle—observations are rows and series are columns.
Appendix: Having A Good Time With Your Date
EViews uses dates in quite a few places. Among the most important are:
•Labeling graphs and other output.
•Specifying samples.
•In data series.
Most of the time, you can specify a date in any reasonable looking way. The following commands all set up the same monthly workfile:
wfcreate m 1941m12 1942m1
wfcreate m 41:12 42:1
wfcreate m "december 1941" "january 1942"
Hint: If your date string includes spaces, put it in quotes.
Canadians and Americans, among others, write dates in the order month/day/year. Out of the box, EViews comes set up to follow this convention. You can change to the “European” convention of day/month/year by using the Options/Dates & Frequency Conversion… menu. You can also switch between the colon and frequency delimiter, e.g., “41:12” versus “41m12”.
Hint: Use frequency delimiters rather than the colon. “41q2 “always means the second quarter of 1941, while “41:2 “means the second quarter of 1941 when used in a quarterly workfile but means February 1941 in a monthly workfile.
Ambiguity is not your friend.
Appendix: Having A Good Time With Your Date—59
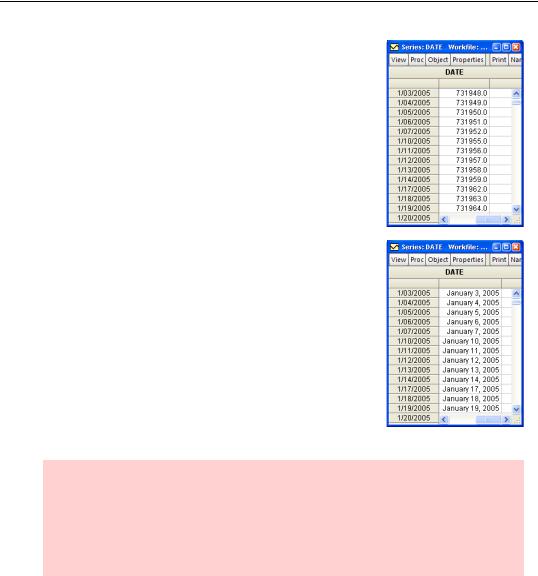
The most common use of dates as data is as the id series that appears under the Obs column in spreadsheet views and on the horizontal axis in many graphs. But nothing stops you from treating the values in any EViews series as dates. For example, one series might give the date a stock was bought and another series might give the date the same stock was sold. Internally, EViews stores dates as “date numbers”—the number of days since January 1, 0001AD according to the Gregorian proleptic (don’t ask) calendar. For example, the series DATE, created with the command “series date=@date”, looks like this.
Great for computers—not so great for humans. So EViews lets you change the display of a series containing date numbers. In a spreadsheet view, you can change the display by rightclicking on a column and choosing Display format…. You can also open a series, hit the  button and change the Numeric display field to one of the date or time formats. Then more fields will appear to let you further customize the format. This looks a lot better.
EViews will also translate text strings into dates when doing an ASCII Read, and set the initial display of the series read to be a date format.
Hint: Since dates are stored as numbers, you can do sensible date arithmetic. If the series DATEBOUGHT and DATESOLD hold the information suggested by their respective names, then:
series daysheld = datesold - datebought
does just what it should.
So dates are pretty straightforward. Except when they’re not. If you want more details, the Command and Programming Reference has a very nice 20+ page section for you.

60—Chapter 2. EViews—Meet Data