

Adding Data To An Existing Workfile—Or, Being Rectangular Doesn’t Mean Being Inflexible—51
5.Multiple tables in one file.
6.Data in which one space is not a delimiter, but multiple spaces are.
7.Header lines that are interpreted as data.
Here are a couple of problems that you generally can’t fix in the read dialog:
1.Variable length alphabetic data recognizable only by context.
2.Data where the format differs from one observation to another.
3.Dates that aren’t in English. Verbum ianuarius non intellego.
Either read in the data the best you can and make corrections later, or re-arrange the data before you read it in.
Hint: If your data are truly irregular, it’s possible that reading it directly into EViews is just not a happening event. You may be better off lightly touching up the data organization in a text editor before bringing it into EViews.
Adding Data To An Existing Workfile—Or, Being Rectangular Doesn’t Mean Being Inflexible
You have a workfile set up and you’ve populated it with data. How, you may ask, do I add more data? It helps to split this into two separate questions: How do I add more observations and how do I add more variables? In thinking about these questions, picture your data as being formed into a rectangle and then lengthening the rectangle from top to bottom (adding more observations) or widening the rectangle from left to right (adding more variables).
Pretend that our academic salary initially had only two variables (DISCIPLINE and SALARY) and five observations (workfile range “1 5”). We could picture the data as being in a rectangle with two columns and five rows:
Dentistry 44214
Medicine 43160
Law 40670
Agriculture 36879
Engineering 35694
We now discover a sixth observation: Geology with a salary of $33,206. Putting in the new observation takes two steps. First, we extend the workfile at the bottom. Next, we enter the new observation in the space we’ve created.
52—Chapter 2. EViews—Meet Data
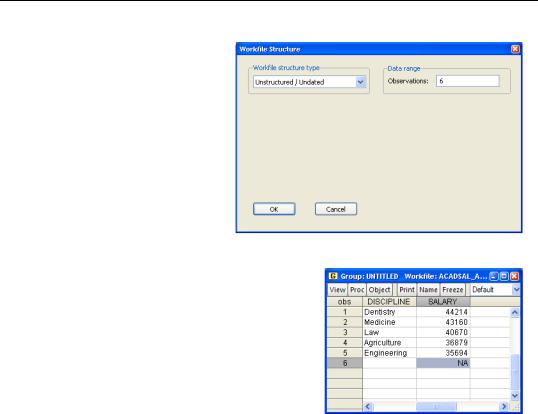
Double-click on Range in the upper pane of the workfile window or choose Proc/Structure/Resize Current Page… to bring up the workfile structure dialog. This dialog lets you change the range and/or the structure of the workfile. Be careful not to change the structure by accident. In our example we want an unstructured workfile with 6 observations, so the filled out dialog looks like this.
Open a group window containing DISCIPLINE and SALARY. You can see that a row with no data has been added at the bottom. SALARY is marked NA for “not available” and DISCIPLINE is an empty string. An empty string just looks like a blank entry in the table.
Now type in the new observation. It’s okay for some of the new “entries” to be left as NA, just as there can be NAs in the existing data.
Copy/Paste
You could, of course, have added a thousand new observations just as easily as one. Typing 1,000 observations would be rather tedious though. In contrast, Copy/Paste isn’t any harder for 1,000 observations than it is for one. Go to the computer file holding your data. Copy the data you wish to add, being sure that you’ve selected a rectangle of data. In EViews, open a group with the desired variables, select the empty rectangle at the bottom that you want to fill in, and choose Paste. EViews does a very smart job of interpreting the data you’ve copied and putting it in the right spot. But if you find that Paste doesn’t do just what you want, try Paste Special which has extra options.
Sometimes the easiest way to combine observations from different sources is to read each source into a separate workfile, create a master workfile with a range large enough to hold all your data, and then manually copy from each small workfile into the master workfile.
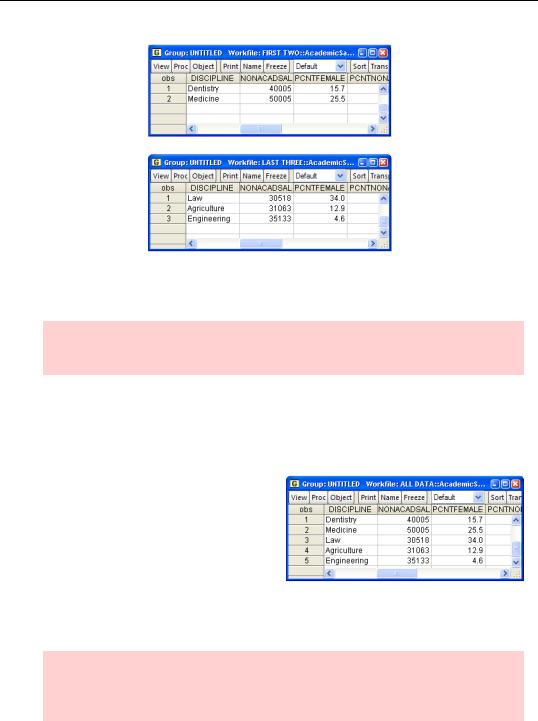
Suppose that our dentistry and medicine data originated in one source and law, agriculture, and engineering in another. We’d begin by reading our data into two separate workfiles, one with the first two observations and the other with the last three. Looking at an excerpt from the two separate files we’d see
Adding Data To An Existing Workfile—Or, Being Rectangular Doesn’t Mean Being Inflexible—53
We want to extend the range of the first workfile and then copy in the data from the second. Select the workfile window for “First Two.wf1”. Use File/SaveAs to change the name to “All Data”. Now double-click on Range and change the range to 5 observations.
Hint: SaveAs before changing range. This way an error doesn’t mess up the original version of “First Two.wf1”.
We need to be careful which workfile we’re working in now. Select the workfile window for “Last Three.wf1”. Hit the  button and Select All (except C-Resid). Then open a group window, which will look more or less like the second window above. Select all the data by dragging the mouse. Then copy to the clipboard.
Click in “All Data.wf1” and open a group with all the series just as we did for “Last Three”. Hit  , highlight the last three rows, and paste. The data copied from “Last Three” replaced the NAs and we’re done.
The same principle works with more than two data sources. Make your “all data”
workfile big enough to hold all your data and then copy into the appropriate rows from each smaller workfile sequentially.
Hint: Be careful that each group has all the series in the same order. EViews is just copying a rectangle of numbers. If you accidentally change the order of the series, EViews will accidentally scramble the data.
54—Chapter 2. EViews—Meet Data
Expanding from the middle out
Question: Can I insert observations in the middle of my file instead of at the end?
Response: Nope.
Further Response: Yep.
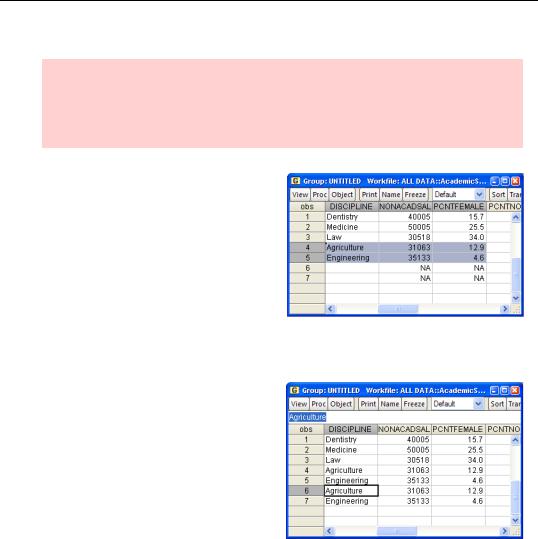
EViews expands a workfile by adding space for new observations at the end of the workfile range. Adding observations in the middle requires two steps. First, expand the workfile just as we’ve done above. Second, move observations down to the new bottom of the rectangle. To accomplish the latter, open a group including all series in the workfile, select the rows that should go to the bottom, and hit Copy. For
example, to move Agriculture and Engineering to the bottom select the two rows as shown and select Copy.
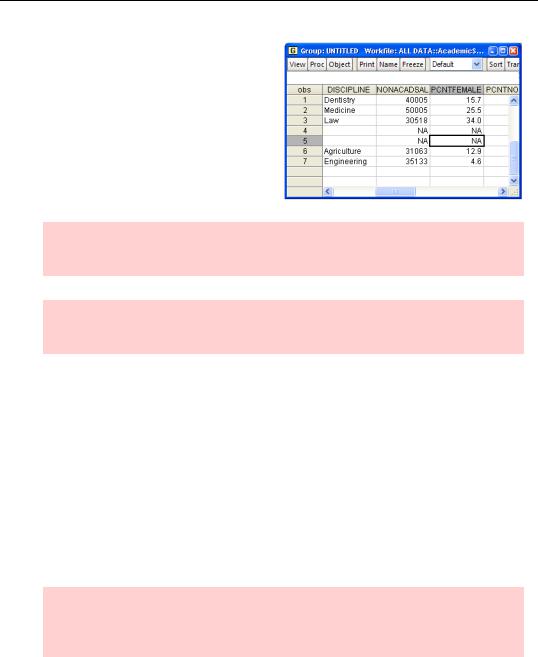
Then, making certain that edit mode for the group is on, paste into rows at the bottom of the workfile.
Adding Data To An Existing Workfile—Or, Being Rectangular Doesn’t Mean Being Inflexible—55
Finally, clear out the area you copied from by selecting each cell in turn and hitting the Delete key.
Hint: To prevent scrambling up the variables, be sure to move data for all your series at the same time.
Hint: You can use the right-mouse menu item Insert obs... to move the data for you automatically.
Adding new variables
Adding a new variable (or variables) is relatively easy. Think of adding a blank column to the right of the data rectangle.
If the new variable is in an existing workfile—or if you can arrange to get it into one—add- ing the variable into the destination workfile is a cinch. EViews treats each series as a unified object containing data, frequency, sample, label, etc. Open the source workfile, select the series you want, and select Copy. Open the destination workfile and Paste. All done.
Suppose, for example, you have data on the clipboard that you want to add to an existing workfile. Use the Paste as new Workfile procedure we talked about earlier in the chapter to create a new workfile. Then Copy/Paste series from the new workfile into the desired destination workfile.
Hint: In order to bring up the context menu with Paste as new Workfile be sure to right-click in the lower EViews pane in a blank area, i.e., outside of any workfile window.
If the series you want to add isn’t in an EViews workfile, one alternative is to use File/Import, which is designed to bring data into an existing workfile. File/Import is help-