

The Import Business—37
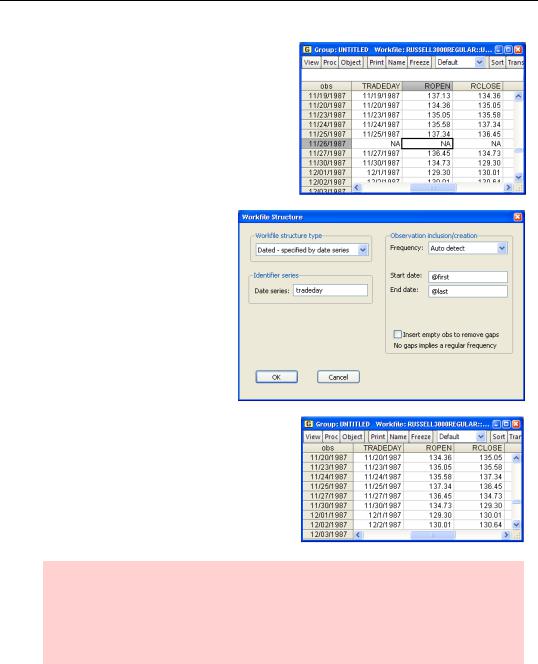
You can’t create a dated irregular structure from the Workfile Create dialog. Instead, you read the data into one of the available structures and then restructure the workfile. For example, the workfile “Russell3000Regular.wf1” holds Daily – 5 day week data. A small excerpt is shown to the right.
To change this to Dated-irregu- lar, double-click on Range in the workfile window or choose
Proc/Structure/Resize Current Page… to bring up the Workfile structure dialog. Pick Datedspecified by date series. Enter the name of the series containing observation dates in the Identifier series field.
Notice that after restructuring,
November 26, 1987 (which was previously shown as NA) has disappeared from the data set.
Hint: Date functions work as expected in Dated – irregular workfiles. However, lags pick up the preceding observation (as in unstructured workfiles), not the preceding date (as in regular dated workfiles). In our original file, one lag of 11/27/1987 was 11/26/1987, which happened to be NA. In our new file, one lag of 11/27/1987 is 11/25/1987.
The Import Business
Once you’ve created an empty workfile, you can turn to filling it up with your data.

38—Chapter 2. EViews—Meet Data
Frankly, the easiest way to get data into EViews is to start with data that someone else has already entered into a computer file. EViews is very clever about reading data in a variety of formats.
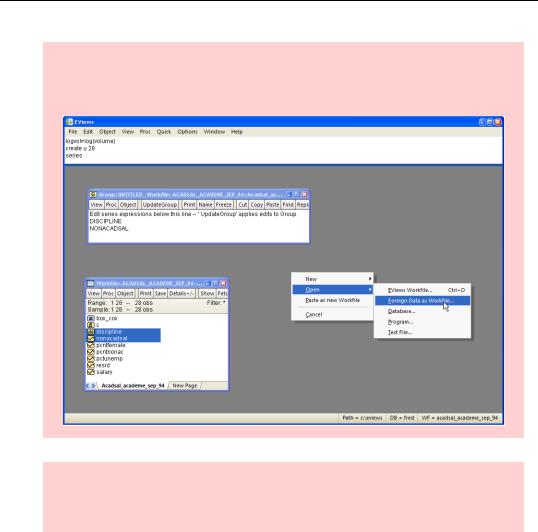
Let’s go back to the academic salary example to go over some methods of bringing in data that’s already on the computer. EViews provides three different methods for loading data from a “foreign” file:
•File/Open/Foreign Data as Workfile… translates any of a number of file formats into an EViews workfile.
•You can set up a workfile as we’ve done above and then use File/Import to bring in data from a spreadsheet program or text file (plus a couple of other specialized formats).
•You can use the standard Windows copy/paste commands to transfer data between a Series window or a Group window and another program. EViews is quite smart about interpreting the material you’re pasting.
If most of your data comes from a single source, using File/Open/Foreign Data as Workfile… is far and away the easiest method. If you’re cobbling together data from multiple sources, try using File/Open/Foreign Data as Workfile… on the most complicated file and then using File/Import or copy/paste to add from the other sources one at a time.
EViews is a fluent reader of many foreign file formats. Let’s walk through examples of several of the most common.
The Import Business—39
Make It Slightly Easier Hint: Instead of choosing the menu File/Open/Foreign Data as Workfile… right click in any empty space inside EViews (not in the command pane or inside an open window) and choose Open/Foreign Data as Workfile….
Make It Really Easy Hint: Just drag-and-drop any data file onto an empty space inside EViews. If EViews understands the data in the file, the file will pop open, ready to read. (You may have to answer a couple of questions first.)
40—Chapter 2. EViews—Meet Data
An Excel-lent Import Source
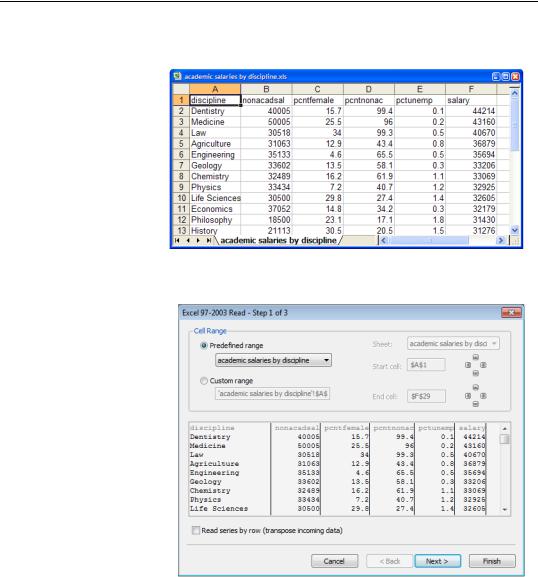
The second-lowest common denominator file format is a Microsoft Excel spreadsheet. Here’s an excerpt of “academic salaries by discipline.xls” (available on the EViews website).
Note that variable names are conve-
niently provided in the first row of the file.
Use File/Open/Foreign Data as Workfile… and point to the desired Excel file. EViews does a quick analysis of the Excel file and opens the
Spreadsheet read dialog.
The Import Business—41
The Spreadsheet read dialog displays lots of options, but most of the time if you just hit  EViews will correctly guess what you want done. Note, for example, that EViews has figured out that the first line holds variable names rather than data. To see what EViews is planning, and make adjustments if needed, hit
  .
.
You can click in each
column to change the series name or enter a description for the series. In our example EViews has correctly analyzed the file, so we can just hit  and EViews generates our workfile.
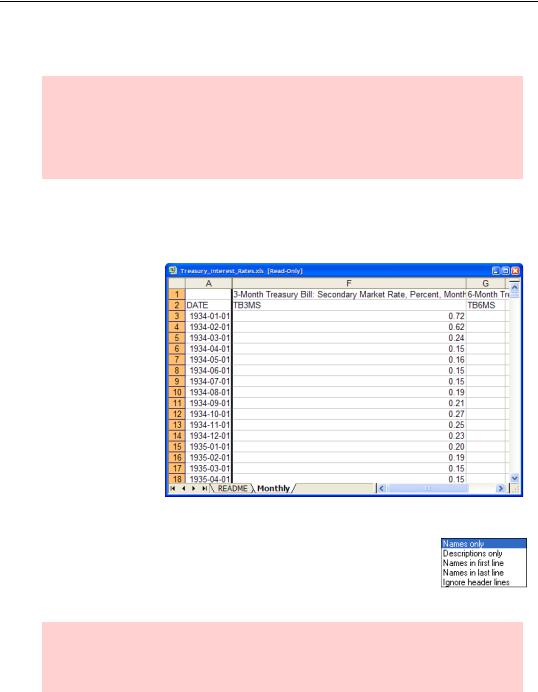
EViews’ intuition is pretty good when it comes to reading Excel files, so frequently the first step is also the  step. Sometimes, though, we have to lend a hand. The file “Treasury_Interest_Ra tes.xls” (on the EViews web site) provides a few examples. If you drag-and-drop “Treasury_Interest_Ra tes.xls” onto EViews, the Spreadsheet read
42—Chapter 2. EViews—Meet Data
dialog opens to let us choose which sheet to read from the file. It so happens we want the second sheet, “Monthly,” which we can choose in the Predefined range dropdown.
Hint: EViews examines your spreadsheet and generally makes a pretty intelligent guess about which part of the spreadsheet you’d like read. You can also set the range manually in the Spreadsheet read dialog. You’ll find it saves time if you define a named range demarcating your data in Excel. In this way, you need only select the named range when EViews reads in the spreadsheet.
The controls in the upper left hand corner of the second Spreadsheet read dialog provide a number of options for customizing how EViews interprets the Excel spreadsheet. Which option you need depends on how your file is structured. Here’s one example.
An excerpt from our Excel file is shown to the right. This particular file has a description of each variable in the first row and the name of the variable in the second row. Since the default assumption is that only the variable name is present, this won’t do. We need to provide more information.
The Header type: dropdown gives options that can handle most common file arrangements. In this case, choose Names in last line and away we go. (Names in last line means the names are at the end of the header information, right before the data begins—a pretty common arrangement.)
Hint: There’s no harm in trying out EViews’ first guess. If the results aren’t what you’re looking for, throw them out, re-open the file, and set the controls the way you want in the Spreadsheet read dialog.

The Import Business—43
Being Date Savvy
It’s not at all unusual for a data file to include the date of each observation. EViews does a surprisingly good job of guessing that a particular column of data consists of dates that ought to be used as identifiers in the workfile.
Here’s an excerpt from an Excel file, “NZ Unemployment.xls”, downloaded from Statistics New Zealand. The data are quarterly unemployment, but note that each observation is labeled with the last month of the quarter and the year, not with a quarter number. What’s more, the data runs “backwards,” with the most recent observation coming first.
Drop-and-drag this file onto EViews and EViews will not only figure out that it’s quarterly data, it’ll also re-sort the data into the right order, so that it looks like the data shown to the right.
While EViews won’t always figure out the “intent” of dates in a file, it gets it right quite frequently—so it’s worth a try. By the way, this works with many formats of input files, not just Excel.
Reading the Great Texts
If the second-lowest common denominator file format is a Microsoft Excel spreadsheet, what’s the lowest common denominator file format? A plain text file of course!
Hint: “Text” data and files are variously described as “text,” “ASCII,” “alpha,” “alphanumeric,” or “character.” Sometimes the file extension “csv” is used for text data where data values are separated by commas.
Tab delimited
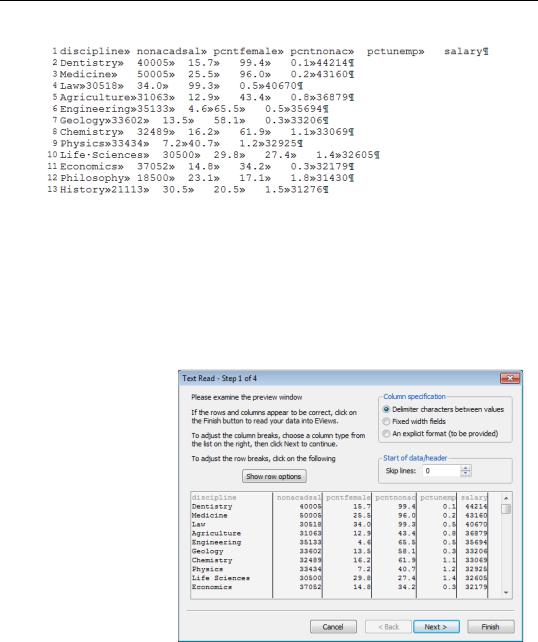
Here’s an excerpt from “academic salaries by discipline.txt”, available at the usual website.
44—Chapter 2. EViews—Meet Data
As displayed, the symbol “»” represents a tab character, the raised dot, “. ”, denotes a space, and the paragraph mark “¶” marks the end of a line. EViews interprets the tab character as separating one datum from the next, and displays the text lined up in columns.
The data in “academic salaries by discipline.txt” lines up pretty much the same way as did the same data in the Excel file we looked at above. To pull text data directly into an workfile use File/Open/Foreign Data as Workfile… and point to the appropriate text file. (You don’t want File/Open/Text File…, that’s for bringing a file in as text, not for converting the text to an EViews workfile.)
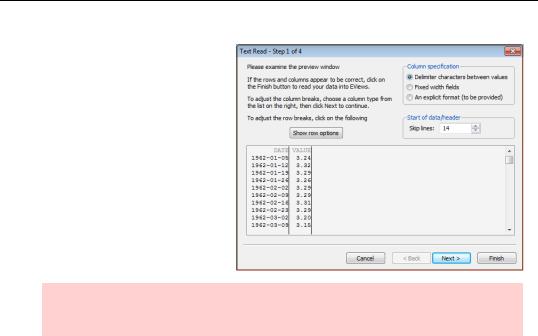
EViews pops up with the ASCII Read dialog.
EViews has analyzed our text file and made a judgment call about how to interpret the data. A quick glance shows that EViews has hit it spot on, so we can just hit  and we’ll have our workfile.
Text files aren’t always this easy to interpret. When EViews reads in a line it has to decide
which information goes with which variable. In this example, data are separated by tabs. When EViews finds a tab it knows it’s done reading the current datum. In this context a tab is called a “delimiter” because it marks de limit, or de boundary, of a column. EViews has a built-in facility for using tabs or spaces for delimiters and also allows you to customize the
The Import Business—45
choice of delimiter. (These choices are found by hitting  in the ASCII Read dialog.)
Hint: If you have a choice, get your data tab delimited. Life is better with tab.
Space delimited
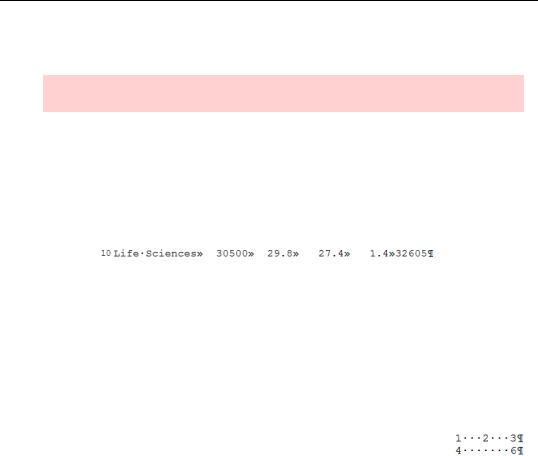
The most common format for text data is probably “space delimited.” That just means there are one or more spaces between data fields. It’s common because it’s natural to us human types to find spaces between words. (At least for most modern western languages.) So this seems an ideal way to arrange data for the computer to read – and for the most part it works fine. But consider the line:
Is the value for the second variable “30500,” or is it “Sciences?” We know the intended answer is the former because we understand the context. But if you tell EViews that your data are separated by spaces, it’s going to believe you—and there is a space between “Life” and “Sciences.”
If you have complete control of the text file, either because you create it or because you can edit it by hand, you can mark off a single text string by placing it between quotes. For example, put “Life Sciences” between quotes. EViews will treat quoted material as one long string, which is what we want in this case.
The inverse problem happens with space delimited data when a data item
is missing. If a column is left blank for a particular observation we humans assume there is a number missing. EViews will just see the blank
space as part of the delimiter. So while we understand that the text excerpt to the right should be interpreted as “1, 2, 3” for the first observation and “4, NA, 6” for the second observation, all EViews sees is a long, white space between the 4 and the 6 and interprets the data as “1, 2, 3” followed by “4, 6, NA”. If the data are arranged in fixed columns, as is the case in this excerpt, try the Fixed width fields option described in the next section.

46—Chapter 2. EViews—Meet Data
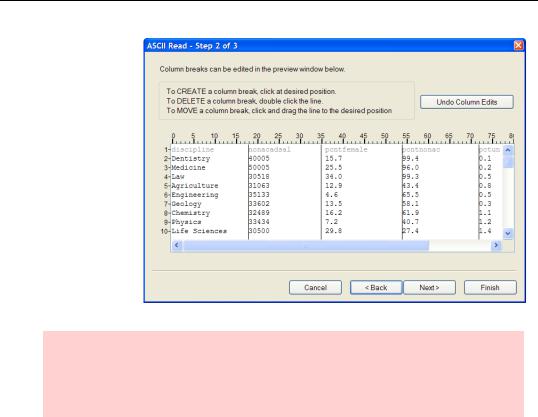
Fixed width fields
Another very popular format, especially with older data, is to skip the issue of delimiters entirely and put each data field in fixed columns. DISCIPLINE might be in columns 1 through 18, NONACADSAL in columns 19 through 360, etc. If you choose the
radio button Fixed width fields in the ASCII Read dialog, EViews will show you its best guess as to where fields end.
In this example, EViews’ guess isn’t quite right. Hit  so that you can drag the column dividers to the right locations.
The Import Business—47
Now manually adjust the columns. After you have the column boundaries where they belong, hit  .
.
Hint: Telling EViews to use fixed column locations for each series replaces the use of delimiters. This can get around the missing number problem described above. Similarly, it can solve the problem of alpha observations that include spaces that would be mistaken for delimiters.
Explicit format
EViews provides a third, very powerful option for describing the layout of data. You can provide an Explicit Format which can be specified in EViews notation, or using notation from either of two widely used computer languages: Fortran format notation or C scanf notation. (See the User’s Guide for more information.)
EViews reads about two dozen other file formats, including files from many popular statistics packages. EViews does an excellent job of reading these formats while preserving labeling information. So if you are given data from Stata, TSP, SPSS, SAS, etc., try reading the data directly using File/Open/Foreign Data as Workfile…. (See the User’s Guide for more information about this too.)
48—Chapter 2. EViews—Meet Data
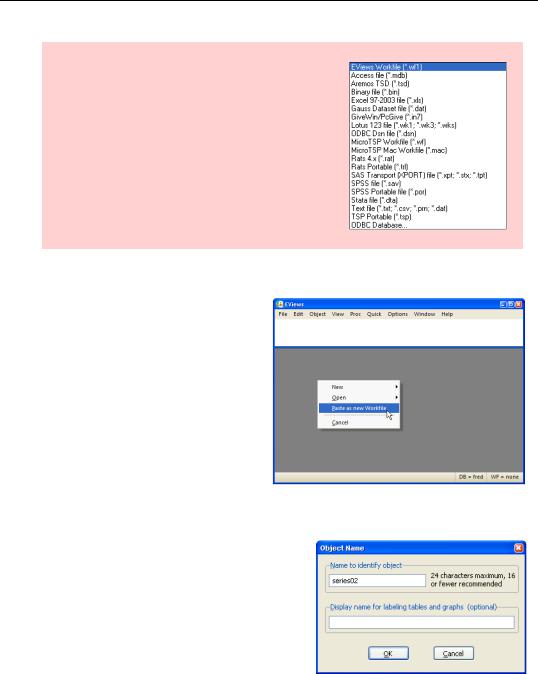
Hint: The counterpart to File/Open/Foreign Data as Workfile… is File/SaveAs… A wide variety of file formats are accessible in the Save as type: drop down menu, part of which is shown to the right.
Coming in from the clipboard
Another useful option is to use Copy/Paste. For example, some web sites load data right onto the clipboard. EViews is happy to create a new workfile from the contents of the clipboard. Right-click on any blank spot in the lower EViews pane and then choose
Paste as new Workfile. EViews will try to use the top row of data for series names. If that doesn’t work out, EViews will name the series SERIES01, SERIES02, etc., in which case you may want to rename the series to something more meaningful.
To rename a series, select the series in the workfile window, right-click and choose Rename…. Fill out the dialog with the new name. You can enter a Display Name here as well.
Reading From the Web
EViews is just as happy to read a file from the web as it is to read a file from your disk. Although you can’t browse the web within EViews the way you can browse your disk, you
can enter a url (i.e., a web address) in the open file dialog.
The Import Business—49
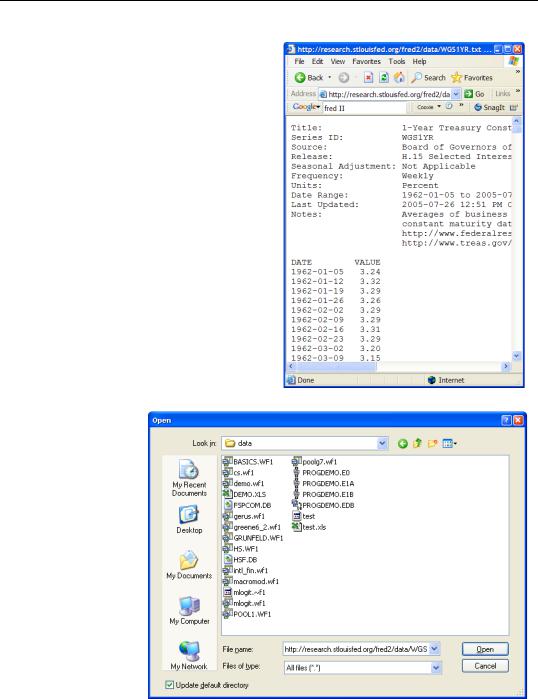
For example, my friend Fred posts data on the 1-Year Treasury Constant Maturity Rate at “http://research.stlouisfed.org/fred2/data/WGS1YR.txt”. In Internet Explorer, the data looks like the picture to the right.
Choose
File/Open/Foreign Data as Workfile… and enter the url in the File name: field. Often, the easiest way to grab a url is to copy it from the address bar of the web browser.
50—Chapter 2. EViews—Meet Data
EViews does its usual nice job of interpreting the data.
Hint: Sometimes the Open dialog remains open for what seems like a long time while EViews processes the data from the web. Be patient.
Reading HTML
The file above is a standard text file which happens to reside on the web. More commonly, files on the web are stored in HTML format. (HTML files can be stored on your local disk as well, of course.) HTML files generally contain large amounts of formatting information which is invisible when displayed in a web browser. EViews tries to work around this formatting information by looking for data presented using the HTML “table” format. If an HTML file doesn’t read smoothly, it’s likely that the data has been formatted to look nice when displayed, but that the table format wasn’t used.
Reading Is Funkadelic
Clever as EViews is at interpreting data, it’s not as smart as you are. We’ve seen that the dialogs include a large number of manual customization features. We’ve discussed some cases where automatic recognition doesn’t work. Here’s a more inclusive—but by no means exhaustive—list of issues. Most of the time you can use the customization features to read data with these problems:
1.Multi-line observations.
2.Streamed observations.
3.Fixed width, but undelimited, data.
4.Dates split across multiple columns, for example month in one column and year in another.