CHAPTER 3 Phase Diagram Sources
List of Tables |
Phase Diagram Sources |
©2001 CRC Press LLC
Phase Diagrams are especially useful tools for the field of materials science and engineering. In the last decade, a substantial effort has been made within the materials community to provide a comprehensive set of accurate phase equilibria information. Cooperative efforts involving academia, industry, and government have been coordinated through the professional societies, ASM International and the American Ceramic Society. As a result, the following references are available and new updates will become available on a regular basis.
|
Table 63. PHASE DIAGRAM SOURCES |
|
|
|
|
Society |
|
Source |
|
|
|
|
|
|
American Ceramic |
|
Phase Diagrams for Ceramists, Vols. 1-12, American Ceramic |
|
Society, Westerville, Ohio, 1964, 1969, 1975, 1981, 1983, 1987, |
|
Society |
|
|
|
1989, 1989, 1992, 1994, 1995, and 1996. |
|
|
|
|
|
|
Binary Alloy Phase Diagrams, Second Edition, Vols. 1, 2 and 3, |
ASM International |
|
T.B. Massalski, et.al., ed., ASM International, Materials Park, |
|
|
Ohio, 1990. |
ASM International |
|
ASM Handbook, Vol. 3, ASM International, Materials Park, |
|
Ohio, 1992. |
|
|
|
|
|
|
|
©2001 CRC Press LLC
Shackelford, James F. & Alexander, W. “Thermodynamic and Kinetic Data”
Materials Science and Engineering Handbook
Ed. James F. Shackelford & W. Alexander Boca Raton: CRC Press LLC, 2001

CHAPTER 4
Thermodynamic and
Kinetic Data
List of Tables |
Bond Strengths |
|
Bond Strengths in Diatomic Molecules |
|
Bond Strengths of Polyatomic Molecules |
|
Solubility of Copper and Copper Alloys |
|
Heat of Formation of Inorganic Oxides |
Phase Change
Phase Change Thermodynamic Properties for The Elements
Phase Change Thermodynamic Properties of Oxides
Melting Point
Melting Points of the Elements
Melting Points of Elements and Inorganic Compounds
Melting Points Of Ceramics
Heat of Fusion & Sublimation
Heat of Fusion For Elements and Inorganic Compounds
Heats of Sublimation of Metals and Their Oxides
Thermodynamic Coefficients
Key to Tables of Thermodynamic Coefficients
Thermodynamic Coefficients for Selected Elements
Thermodynamic Coefficients for Oxides
Entropy
Entropy of the Elements
©2001 CRC Press LLC
List of Tables
(Continued)
Vapor Pressure
Vapor Pressure of the Elements at Very Low Pressures Vapor Pressure of the Elements at Moderate Pressures Vapor Pressure of the Elements at High Pressures Vapor Pressure of Elements and Inorganic Compounds
Diffusion
Values of The Error Function
Diffusion in Metallic Systems
Diffusion of Metals into Metals
Diffusion in Semiconductors
©2001 CRC Press LLC

Table 64. BOND STRENGTHS IN DIATOMIC MOLECULES*
(SHEET 1 OF 18)
Molecule |
|
kcal • mol-1 |
|
|
|
|
|
|
|
|
|
H–H |
104.207 |
|
± 0.001 |
H–D |
105.030 |
|
± 0.001 |
D–D |
106.010 |
|
± 0.001 |
H–Li |
56.91 |
|
± 0.01 |
H–Be |
54 |
|
|
H–B |
79 |
|
± 1 |
H–C |
80.9 |
|
|
H–N |
75 |
|
± 4 |
H–O |
102.34 |
|
± 0.30 |
H–F |
135.9 |
|
± 0.3 |
H–Na |
48 |
|
± 5 |
H–Mg |
47 |
|
± 12 |
H–Al |
68 |
|
± 2 |
H–Si |
71.4 |
|
± 1.2 |
H–P |
82 |
|
± 7 |
H–S |
82.3 |
|
± 2.9 |
H–Cl |
103.1 |
|
|
H–K |
43.8 |
|
± 3.5 |
H–Ca |
40.1 |
|
|
H–Cr |
67 |
|
± 12 |
H–Mn |
56 |
|
± 7 |
H–Ni |
61 |
|
± 7 |
H –Cu |
67 |
|
± 2 |
H–Zn |
20.5 |
|
± 0.5 |
H –Ga |
68 |
|
± 5 |
H–Ge |
76.8 |
|
± 0.2 |
H–As |
65 |
|
± 3 |
H–Se |
73 |
|
± 1 |
|
|
|
|
To convert kcal to KJ, multiply by 4.184.
Source: data from: Kerr, J. A., Parsonage, M. J., and Trotman–Dickenson, A. F., in Handbook of Chemistry and Physics, 55th ed., Weast, R. C., Ed., CRC Press, Cleveland, 1974, F–204.
©2001 CRC Press LLC

Table 64. BOND STRENGTHS IN DIATOMIC MOLECULES*
(SHEET 2 OF 18)
Molecule |
|
kcal • mol-1 |
|
|
|
|
|
|
|
|
|
H–Br |
87.4 |
|
± 0.5 |
H–Rb |
40 |
|
± 5 |
H–Sr |
39 |
|
± 2 |
H–Ag |
59 |
|
± 1 |
H–Cd |
16.5 |
|
± 0.1 |
H–In |
59 |
|
± 2 |
H–Sn |
63 |
|
± 1 |
H–Te |
64 |
|
± 1 |
H–I |
71.4 |
|
± 0.2 |
H–Cs |
42.6 |
|
± 0.9 |
H–Ba |
42 |
|
± 4 |
H–Yb |
38 |
|
± 1 |
H–Pt |
84 |
|
± 9 |
H–Au |
75 |
|
± 3 |
H–Hg |
9.5 |
|
|
H–Ti |
45 |
|
± 2 |
H–Pb |
42 |
|
± 5 |
H–Bi |
59 |
|
± 7 |
Li–Li |
24.55 |
|
± 0.14 |
Li–O |
78 |
|
± 6 |
Li– F |
137.5 |
|
± 1 |
Li–Cl |
111.9 |
|
± 2 |
Li–Br |
100.2 |
|
± 2 |
Li–I |
84.6 |
|
± 2 |
Be–Be |
17 |
|
|
Be–0 |
98 |
|
± 7 |
Be–F |
136 |
|
± 2 |
Be–S |
89 |
|
± 14 |
|
|
|
|
To convert kcal to KJ, multiply by 4.184.
Source: data from: Kerr, J. A., Parsonage, M. J., and Trotman–Dickenson, A. F., in Handbook of Chemistry and Physics, 55th ed., Weast, R. C., Ed., CRC Press, Cleveland, 1974, F–204.
©2001 CRC Press LLC

Table 64. BOND STRENGTHS IN DIATOMIC MOLECULES*
(SHEET 3 OF 18)
Molecule |
|
kcal • mol-1 |
|
|
|
|
|
|
|
|
|
Be–Cl |
92.8 |
|
± 2.2 |
Be–Au |
~ 67 |
|
|
B–B |
~ 67 |
|
± 5 |
B–N |
93 |
|
± 12 |
B–0 |
192.7 |
|
± 1.2 |
B–F |
180 |
|
± 3 |
B–S |
138.8 |
|
± 2.2 |
B–Cl |
119 |
|
|
B–Se |
110 |
|
± 4 |
B–Br |
101 |
|
± 5 |
B–Ru |
107 |
|
± 5 |
B–Rh |
114 |
|
± 5 |
B–Pd |
79 |
|
± 5 |
B–Te |
85 |
|
± 5 |
B–Ce |
~ 100 |
|
|
B–Ir |
123 |
|
± 4 |
B–Pt |
114 |
|
± 4 |
B–Au |
82 |
|
± 4 |
B–Th |
71 |
|
|
C–C |
144 |
|
± 5 |
C–N |
184 |
|
± 1 |
C–0 |
257.26 |
|
± 0.77 |
C–F |
128 |
|
± 5 |
C–Si |
104 |
|
± 5 |
C–P |
139 |
|
± 23 |
C–S |
175 |
|
± 7 |
C–Cl |
93 |
|
|
C–Ti |
~128 |
|
|
|
|
|
|
To convert kcal to KJ, multiply by 4.184.
Source: data from: Kerr, J. A., Parsonage, M. J., and Trotman–Dickenson, A. F., in Handbook of Chemistry and Physics, 55th ed., Weast, R. C., Ed., CRC Press, Cleveland, 1974, F–204.
©2001 CRC Press LLC
Table 64. BOND STRENGTHS IN DIATOMIC MOLECULES*
(SHEET 4 OF 18)
Molecule |
|
kcal • mol-1 |
|
|
|
|
|
|
|
|
|
C–V |
133 |
|
|
C–Ge |
110 |
|
± 5 |
C–Se |
139 |
|
± 23 |
C–Br |
67 |
|
± 5 |
C–Ru |
152 |
|
± 3 |
C–Rh |
139 |
|
± 2 |
C–I |
50 |
|
± 5 |
C–Ce |
109 |
|
± 7 |
C–Ir |
149 |
|
± 3 |
C–Pt |
146 |
|
± 2 |
C–U |
111 |
|
± 7 |
N–N |
226.8 |
|
± 1.5 |
N–O |
150.8 |
|
± 0.2 |
N–F |
62.6 |
|
± 0.8 |
N–Al |
71 |
|
± 23 |
N–Si |
105 |
|
± 9 |
N–P |
148 |
|
± 5 |
N–S |
~ 120 |
|
± 6 |
N–Cl |
93 |
|
± 12 |
N–Ti |
111 |
|
|
N–As |
116 |
|
± 23 |
N–Se |
105 |
|
± 23 |
N–Br |
67 |
|
± 5 |
N–Sb |
72 |
|
± 12 |
N–I |
~.38 |
|
|
N–Xe |
55 |
|
|
N–Th |
138 |
|
± 1 |
N–U |
127 |
|
± 1 |
|
|
|
|
To convert kcal to KJ, multiply by 4.184.
Source: data from: Kerr, J. A., Parsonage, M. J., and Trotman–Dickenson, A. F., in Handbook of Chemistry and Physics, 55th ed., Weast, R. C., Ed., CRC Press, Cleveland, 1974, F–204.
©2001 CRC Press LLC

Table 64. BOND STRENGTHS IN DIATOMIC MOLECULES*
(SHEET 5 OF 18)
Molecule |
|
kcal • mol-1 |
|
|
|
|
|
|
|
|
|
O–O |
118.86 |
|
± 0.04 |
O–F |
56 |
|
± 9 |
O–Na |
61 |
|
± 4 |
O–Mg |
79 |
|
± 7 |
O–Al |
116 |
|
± 5 |
O–Si |
184 |
|
± 3 |
O–P |
119.6 |
|
± 3 |
O–S |
124.69 |
|
± 0.03 |
O–Cl |
64.29 |
|
± 0.03 |
O–K |
57 |
|
± 8 |
O–Ca |
84 |
|
± 7 |
O–Sc |
155 |
|
± 5 |
O–Ti |
158 |
|
± 8 |
O–V |
154 |
|
± 5 |
O–Cr |
110 |
|
± 10 |
O–Mn |
96 |
|
± 8 |
O–Fe |
96 |
|
± 5 |
O–Co |
88 |
|
± 5 |
O–Ni |
89 |
|
± 5 |
O–Cu |
82 |
|
± 15 |
O–Zn |
≤ 66 |
|
|
O–Ga |
68 |
|
± 15 |
O–Ge |
158.2 |
|
± 3 |
O–As |
115 |
|
± 3 |
O–Se |
101 |
|
|
O–Br |
56.2 |
|
± 0.6 |
O–Rb |
(61) |
|
± 20 |
O–Sr |
93 |
|
± 6 |
|
|
|
|
To convert kcal to KJ, multiply by 4.184.
Source: data from: Kerr, J. A., Parsonage, M. J., and Trotman–Dickenson, A. F., in Handbook of Chemistry and Physics, 55th ed., Weast, R. C., Ed., CRC Press, Cleveland, 1974, F–204.
©2001 CRC Press LLC

Table 64. BOND STRENGTHS IN DIATOMIC MOLECULES*
(SHEET 6 OF 18)
Molecule |
|
kcal • mol-1 |
|
|
|
|
|
|
|
|
|
O–Y |
162 |
|
± 5 |
O–Zr |
181 |
|
± 10 |
O–Nb |
189 |
|
± 10 |
O–Mo |
115 |
|
± 12 |
O–Ru |
115 |
|
± 15 |
O–Rh |
90 |
|
± 15 |
O–Pd |
56 |
|
± 7 |
O–Ag |
51 |
|
± 20 |
O–Cd |
≤ 67 |
|
|
O–In |
≤ 77 |
|
|
O–Sn |
127 |
|
± 2 |
O–Sb |
89 |
|
± 20 |
O–Fe |
93.4 |
|
± 2 |
O–I |
47 |
|
± 7 |
O–Xe |
9 |
|
± 5 |
O–Cs |
67 |
|
± 8 |
O–Ba |
131 |
|
± 6 |
O–La |
188 |
|
± 5 |
O–Ce |
188 |
|
± 6 |
O–Pr |
183.7 |
|
|
O–Nd |
168 |
|
± 8 |
O–Sm |
134 |
|
± 8 |
O–Eu |
130 |
|
± 10 |
O–Gd |
162 |
|
± 6 |
O–Tb |
165 |
|
± 8 |
O–Dy |
146 |
|
± 10 |
O–Ho |
149 |
|
± 10 |
O–Er |
147 |
|
± 10 |
|
|
|
|
To convert kcal to KJ, multiply by 4.184.
Source: data from: Kerr, J. A., Parsonage, M. J., and Trotman–Dickenson, A. F., in Handbook of Chemistry and Physics, 55th ed., Weast, R. C., Ed., CRC Press, Cleveland, 1974, F–204.
©2001 CRC Press LLC

Table 64. BOND STRENGTHS IN DIATOMIC MOLECULES*
(SHEET 7 OF 18)
Molecule |
|
kcal • mol-1 |
|
|
|
|
|
|
|
|
|
O–Tm |
122 |
|
± 15 |
O–Yb |
98 |
|
± 15 |
O–Lu |
159 |
|
± 8 |
O–Hf |
185 |
|
± 10 |
O–Ta |
183 |
|
± 15 |
O–W |
156 |
|
± 6 |
O–Os |
< 142 |
|
|
O–Ir |
≤ 94 |
|
|
O–Pt |
83 |
|
± 8 |
O–Pb |
90.3 |
|
± 1.0 |
O–Bi |
81.9 |
|
± 1.5 |
O–Th |
192 |
|
± 10 |
O–U |
182 |
|
± 8 |
O–Np |
172 |
|
± 7 |
O–Pu |
163 |
|
± 15 |
O–Cm |
≤ 134 |
|
|
F–F |
37.5 |
|
± 2.3 |
F–Na |
114 |
|
± 1 |
F–Mg |
110 |
|
± 1 |
F–Al |
159: |
|
± 3 |
F–Si |
116 |
|
± 12 |
F–P |
105 |
|
± 23 |
F–Cl |
59.9 |
|
± 0.1 |
F–K |
118.9 |
|
± 0.6 |
F–Ca |
125 |
|
± 5 |
F–Sc |
141 |
|
± 3 |
F–Ti |
136 |
|
± 8 |
F–Cr |
104.5 |
|
± 4.7 |
|
|
|
|
To convert kcal to KJ, multiply by 4.184.
Source: data from: Kerr, J. A., Parsonage, M. J., and Trotman–Dickenson, A. F., in Handbook of Chemistry and Physics, 55th ed., Weast, R. C., Ed., CRC Press, Cleveland, 1974, F–204.
©2001 CRC Press LLC

Table 64. BOND STRENGTHS IN DIATOMIC MOLECULES*
(SHEET 8 OF 18)
Molecule |
|
kcal • mol-1 |
|
|
|
|
|
|
|
|
|
F–Mn |
101.2 |
|
± 3.5 |
F–Ni |
89 |
|
± 4 |
F–Cu |
88 |
|
± 9 |
F–Ga |
138 |
|
± 4 |
F–Ge |
116 |
|
± 5 |
F–Br |
55.9 |
|
|
F–Rb |
116.1 |
|
± 1 |
F–Sr |
129.5 |
|
± 1.6 |
F–Y |
144 |
|
± 5 |
Mg–I |
~.68 |
|
|
Mg–Au |
59 |
|
± 23 |
Al–Al |
44 |
|
|
Al–P |
52 |
|
± 3 |
Al–S |
79 |
|
|
Al–Cl |
119.0 |
|
± 1 |
Al–Br |
103.1 |
|
|
Al–I |
88 |
|
|
Al–Au |
65 |
|
|
Al–U |
78 |
|
± 7 |
Si–Si |
76 |
|
± 5 |
Si–S |
148 |
|
± 3 |
Si–Cl |
105 |
|
± 12 |
Si–Fe |
71 |
|
± 6 |
Si–Co |
66 |
|
± 4 |
Si–Ni |
76 |
|
± 4 |
Si–Ge |
72 |
|
± 5 |
Si–Se |
127 |
|
± 4 |
Si–Br |
82 |
|
± 12 |
|
|
|
|
To convert kcal to KJ, multiply by 4.184.
Source: data from: Kerr, J. A., Parsonage, M. J., and Trotman–Dickenson, A. F., in Handbook of Chemistry and Physics, 55th ed., Weast, R. C., Ed., CRC Press, Cleveland, 1974, F–204.
©2001 CRC Press LLC

Table 64. BOND STRENGTHS IN DIATOMIC MOLECULES*
(SHEET 9 OF 18)
Molecule |
|
kcal • mol-1 |
|
|
|
|
|
|
|
|
|
Si–Ru |
95 |
|
± 5 |
Si–Rh |
95 |
|
± 5 |
Si–Pd |
75 |
|
± 4 |
Si–Te |
121 |
|
± 9 |
Si–Ir |
110 |
|
± 5 |
Si–Pt |
120 |
|
± 5 |
Si–Au |
75 |
|
± 3 |
P–P |
117 |
|
± 3 |
F–Ag |
84.7 |
|
± 3.9 |
F–Cd |
73 |
|
± 5 |
F–In |
121 |
|
± 4 |
F–Sn |
111.5 |
|
± 3 |
F–Sb |
105 |
|
± 23 |
F–I |
67? |
|
|
F–Xe |
11 |
|
|
F–Cs |
119.6 |
|
± 1 |
F–Ba |
140.3 |
|
± 1.6 |
F–Nd |
130 |
|
± 3 |
F–Sm |
126.9 |
|
± 4.4 |
F–Eu |
126.1 |
|
± 4.4 |
F–Gd |
141. |
|
± 46.5 |
F–Hg |
31 |
|
± 9 |
F–Ti |
106.4 |
|
± 4.6 |
F–Pb |
85 |
|
± 2 |
F–Bi |
62 |
|
|
F–Pu |
129 |
|
± 7 |
Na–Na |
18.4 |
|
|
Na–Cl |
97.5 |
|
± 0.5 |
|
|
|
|
To convert kcal to KJ, multiply by 4.184.
Source: data from: Kerr, J. A., Parsonage, M. J., and Trotman–Dickenson, A. F., in Handbook of Chemistry and Physics, 55th ed., Weast, R. C., Ed., CRC Press, Cleveland, 1974, F–204.
©2001 CRC Press LLC

Table 64. BOND STRENGTHS IN DIATOMIC MOLECULES*
(SHEET 10 OF 18)
Molecule |
|
kcal • mol-1 |
|
|
|
|
|
|
|
|
|
Na–K |
15.2 |
|
± 0.7 |
Na–Br |
86.7 |
|
± 1 |
Na–Rb |
14 |
|
± 1 |
Na–I |
72.7 |
|
± 1 |
Mg–Mg |
8? |
|
|
Mg–S |
56? |
|
|
Mg–Cl |
76 |
|
± 3 |
Mg–Br |
75 |
|
± 23 |
P–S |
70 |
|
|
P–Ga |
56 |
|
|
P–W |
73 |
|
± 1 |
P–Th |
90 |
|
|
S–S |
101.9 |
|
± 2.5 |
S–Ca |
75 |
|
± 5 |
S–Sc |
114 |
|
± 3 |
S–Mn |
72 |
|
± 4 |
S–Fe |
78 |
|
|
S–Cu |
72 |
|
± 12 |
S–Zn |
49 |
|
± 3 |
S–Ge |
131.7 |
|
± 0.6 |
S–Se |
91 |
|
± 5 |
S–Sr |
75 |
|
± 5 |
S–Y |
127 |
|
± 3 |
S–Cd |
48 |
|
|
S–In |
69 |
|
± 4 |
S–Sn |
111 |
|
± 1 |
S–Te |
81 |
|
± 5 |
S–Ba |
96 |
|
± 5 |
|
|
|
|
To convert kcal to KJ, multiply by 4.184.
Source: data from: Kerr, J. A., Parsonage, M. J., and Trotman–Dickenson, A. F., in Handbook of Chemistry and Physics, 55th ed., Weast, R. C., Ed., CRC Press, Cleveland, 1974, F–204.
©2001 CRC Press LLC

Table 64. BOND STRENGTHS IN DIATOMIC MOLECULES*
(SHEET 11 OF 18)
Molecule |
|
kcal • mol-1 |
|
|
|
|
|
|
|
|
|
S–La |
137 |
|
± 3 |
S–Ce |
137 |
|
± 3 |
S–Pr |
122.7 |
|
|
S– Nd |
113 |
|
± 4 |
S–Eu |
87 |
|
± 4 |
S–Gd |
126 |
|
± 4 |
S–Ho |
102 |
|
± 4 |
S–Lu |
121 |
|
± 4 |
S–Au |
100 |
|
± 6 |
S–Hg |
51 |
|
|
S–Pb |
82.7 |
|
± 0.4 |
S–Bi |
75.4 |
|
± 1.1 |
S–U |
135 |
|
± 2 |
Cl–Cl |
58.066 |
|
± 0.001 |
Cl–K |
101.3 |
|
± 0.5 |
Cl–Ca |
95 |
|
± 3 |
Cl–Sc |
79 |
|
|
Cl–Ti |
26 |
|
± 2 |
Cl–Cr |
87.5 |
|
± 5.8 |
Cl–Mn |
86.2 |
|
± 2.3 |
Cl–Fe |
84? |
|
|
Cl–Ni |
89 |
|
± 5 |
Cl–Cu |
84 |
|
± 6 |
Cl–Zn |
54.7 |
|
± 4.7 |
Cl–Ga |
114.5 |
|
|
Cl–Ge |
82? |
|
|
Cl–Br |
52.3 |
|
± 0.2 |
Cl–Rb |
100.7 |
|
± 1 |
|
|
|
|
To convert kcal to KJ, multiply by 4.184.
Source: data from: Kerr, J. A., Parsonage, M. J., and Trotman–Dickenson, A. F., in Handbook of Chemistry and Physics, 55th ed., Weast, R. C., Ed., CRC Press, Cleveland, 1974, F–204.
©2001 CRC Press LLC

Table 64. BOND STRENGTHS IN DIATOMIC MOLECULES*
(SHEET 12 OF 18)
Molecule |
|
kcal • mol-1 |
|
|
|
|
|
|
|
|
|
Cl–Sr |
97 |
|
± 3 |
Cl–Y |
82 |
|
± 23 |
Cl–Ag |
75 |
|
± 9 |
Cl–Cd |
49.9 |
|
|
Cl–In |
103.3 |
|
|
CI–Sn |
75? |
|
|
Cl–Sb |
86 |
|
± 12 |
Cl–I |
50.5 |
|
± 0.1 |
Cl–Cs |
106.2 |
|
± 1 |
Cl–Ba |
106 |
|
± 3 |
Cl–Au |
82 |
|
± 2 |
Cl–Hg |
24 |
|
± 2 |
Cl–Ti |
89.0 |
|
± 0.5 |
Cl–Pb |
72 |
|
± 7 |
Cl–Bi |
72 |
|
± 1 |
Cl–Ra |
82 |
|
± 18 |
Ar–Ar |
0.2 |
|
|
K–K |
12.8 |
|
|
K–Br |
90.9 |
|
± 0.5 |
K–I |
76.8 |
|
± 0.5 |
Ca–I |
70 |
|
± 23 |
Ca–Au |
18 |
|
|
Sc–Sc |
25.9 |
|
± 5 |
Ti–Ti |
34 |
|
± 5 |
V–V |
58 |
|
± 5 |
Cr–Cr |
<37 |
|
|
Cr –Cu |
37 |
|
± 5 |
Cr–Ge |
41 |
|
± 7 |
|
|
|
|
To convert kcal to KJ, multiply by 4.184.
Source: data from: Kerr, J. A., Parsonage, M. J., and Trotman–Dickenson, A. F., in Handbook of Chemistry and Physics, 55th ed., Weast, R. C., Ed., CRC Press, Cleveland, 1974, F–204.
©2001 CRC Press LLC

Table 64. BOND STRENGTHS IN DIATOMIC MOLECULES*
(SHEET 13 OF 18)
Molecule |
|
kcal • mol-1 |
|
|
|
|
|
|
|
|
|
Cr–Br |
78.4 |
|
± 5 |
Cr–I |
68.6 |
|
± 5.8 |
Cr–Au |
51.3 |
|
± 3.5 |
Mn–Mn |
4 |
|
± 3 |
Mn–Se |
48 |
|
± 3 |
Mn–Br |
75.1 |
|
± 23 |
Mn–I |
67.6 |
|
± 2.3 |
Mn–Au |
44 |
|
± 3 |
Fe–Fe |
24 |
|
± 5 |
Fe–Ge |
50 |
|
± 7 |
Fe–Br |
59 |
|
± 23 |
Fe–Au |
45 |
|
± 4 |
Co–Co |
40 |
|
± 6 |
Co–Cu |
39 |
|
± 5 |
Co–Ge |
57 |
|
± 6 |
Co–Au |
51 |
|
± 3 |
Ni–Ni |
55.5 |
|
± 5 |
Ni–Cu |
48 |
|
± 5 |
Ni–Ge |
67.3 |
|
± 4 |
Ni–Br |
86 |
|
± 3 |
Ni–I |
70 |
|
± 5 |
Ni–Au |
59 |
|
± 5 |
Cu–Cu |
46.6 |
|
± 2.2 |
Cu–Ge |
49 |
|
± 5 |
Cu–Se |
70 |
|
± 9 |
Cu–Br |
79 |
|
± 6 5 |
Cu–Ag |
41.6 |
|
± 2.2 |
Cu–Sn |
42.3 |
|
± 4 |
|
|
|
|
To convert kcal to KJ, multiply by 4.184.
Source: data from: Kerr, J. A., Parsonage, M. J., and Trotman–Dickenson, A. F., in Handbook of Chemistry and Physics, 55th ed., Weast, R. C., Ed., CRC Press, Cleveland, 1974, F–204.
©2001 CRC Press LLC
Table 64. BOND STRENGTHS IN DIATOMIC MOLECULES*
(SHEET 14 OF 18)
Molecule |
|
kcal • mol-1 |
|
|
|
|
|
|
|
|
|
Cu–Te |
42 |
|
± 9 |
Cu–I |
47? |
|
|
Cu–Au |
55.4 |
|
± 2.2 |
Zn–Zn |
7 |
|
|
Zn–Se |
33 |
|
± 3 |
Zn–Te |
49? |
|
|
Zn–I |
33 |
|
± 7 |
Ga–Ga |
3 |
|
± 3 |
Ga–As |
50.1 |
|
± 0.3 |
Ga–Br |
101 |
|
± 4 |
Ga–Ag |
4 |
|
± 3 |
Ga–Te |
60 |
|
± 6 |
Ga–I |
81 |
|
± 2 |
Ga–Au |
51 |
|
± 23 |
Ge–Ge |
65.8 |
|
± 3 |
Ge–Se |
114 |
|
± |
Ge–Br |
61 |
|
± 7 |
Ge–Te |
93 |
|
± 2 |
Ge–Au |
70 |
|
± 23 |
As–As |
91.7 |
|
|
As–Se |
23 |
|
|
Se–Se |
79.5 |
|
± 0.1 |
Se–Cd |
~75 |
|
|
Se–in |
59 |
|
± 4 |
Se–Sn |
95.9 |
|
± 1.4 |
Se–Te |
64 |
|
± 2 |
Se–La |
114 |
|
± 4 |
Se–Nd |
92 |
|
± 4 |
|
|
|
|
To convert kcal to KJ, multiply by 4.184.
Source: data from: Kerr, J. A., Parsonage, M. J., and Trotman–Dickenson, A. F., in Handbook of Chemistry and Physics, 55th ed., Weast, R. C., Ed., CRC Press, Cleveland, 1974, F–204.
©2001 CRC Press LLC

Table 64. BOND STRENGTHS IN DIATOMIC MOLECULES*
(SHEET 15 OF 18)
Molecule |
|
kcal • mol-1 |
|
|
|
|
|
|
|
|
|
Se–Eu |
72 |
|
± 4 |
Se–Gd |
103 |
|
± 4 |
Se–Ho |
80 |
|
± 4 |
Se–Lu |
100 |
|
± 4 |
Se–Pb |
72.4 |
|
± 1 |
Se–Bi |
67.0 |
|
± 1.5 |
Bi–Br |
46.336 |
|
± 0.001 |
Br–Rb |
90.4 |
|
± 1 |
Br–Ag |
70 |
|
± 7 |
Br–Cd |
~38 |
|
|
Br–In |
93 |
|
|
Bi–Sn |
47 |
|
± 23 |
Br–Sb |
75 |
|
± 14 |
Br–I |
42.8 |
|
± 0.1 |
Br–Cs |
96.5 |
|
± 1 |
Br–Hg |
17.3 |
|
|
Br–Ti |
79.8 |
|
± 0.4 |
Br–Pb |
59 |
|
± 9 |
Br–Bi |
63.9 |
|
± 1 |
Rb–Rb |
12.2 |
|
|
Rb–I |
76.7 |
|
± 1 |
Sr–Au |
63 |
|
± 23 |
Y–Y |
38.3 |
|
|
Y–La |
48.3 |
|
|
Pd–Pd |
33? |
|
|
Pd–Au |
34.2 |
|
± 5 |
Ag–Ag |
41 |
|
± 2 |
Ag–Sn |
32.5 |
|
± 5 |
|
|
|
|
To convert kcal to KJ, multiply by 4.184.
Source: data from: Kerr, J. A., Parsonage, M. J., and Trotman–Dickenson, A. F., in Handbook of Chemistry and Physics, 55th ed., Weast, R. C., Ed., CRC Press, Cleveland, 1974, F–204.
©2001 CRC Press LLC

Table 64. BOND STRENGTHS IN DIATOMIC MOLECULES*
(SHEET 16 OF 18)
Molecule |
|
kcal • mol-1 |
|
|
|
|
|
|
|
|
|
Ag–Te |
70 |
|
± 23 |
Ag–I |
56 |
|
± 7 |
Ag–Au |
48.5 |
|
± 2.2 |
Cd–Cd |
2.7 |
|
± 0.2 |
Cd–I |
33 |
|
± 5 |
In–In |
23.3 |
|
± 2.5 |
In–Sb |
36.3 |
|
± 2.5 |
In–Te |
52 |
|
± 4 |
In–I |
80 |
|
|
Sn–Sn |
46.7 |
|
± 4 |
Sn–Te |
76 |
|
± 1 |
Sn–Au |
58.4 |
|
± 4 |
Sb–Sb |
71.5 |
|
± 1.5 |
Sb–Te |
61 |
|
± 4 |
Sb–Bi |
60 |
|
± 1 |
Te–Te |
63.2 |
|
± 0.2 |
Te–La |
91 |
|
± 4 |
Te–Nd |
73 |
|
± 4 |
Te–Eu |
58 |
|
± 4 |
Te–Gd |
82 |
|
± 4 |
Te–Ho |
62 |
|
± 4 |
Te–Lu |
78 |
|
± 4 |
Te–Au |
59 |
|
± 16 |
Te–Pb |
60 |
|
± 3 |
Te–Bi |
56 |
|
± 3 |
I–I |
36.460 |
|
± 0.002 |
I–Cs |
82.4 |
|
± 1 |
I–Hg |
9 |
|
|
|
|
|
|
To convert kcal to KJ, multiply by 4.184.
Source: data from: Kerr, J. A., Parsonage, M. J., and Trotman–Dickenson, A. F., in Handbook of Chemistry and Physics, 55th ed., Weast, R. C., Ed., CRC Press, Cleveland, 1974, F–204.
©2001 CRC Press LLC

Table 64. BOND STRENGTHS IN DIATOMIC MOLECULES*
(SHEET 17 OF 18)
Molecule |
|
kcal • mol-1 |
|
|
|
|
|
|
|
|
|
I–Ti |
65 |
|
± 2 |
I–Pb |
47 |
|
± 9 |
I–Bi |
52 |
|
± 1 |
Xe–Xe |
~ 0.7 |
|
|
Cs–Cs |
11.3 |
|
|
Ba–Au |
38 |
|
± 14 |
La–Ld |
58.6 |
|
|
La–Au |
80 |
|
± 5 |
Ce–Ce |
66 |
|
± 1 |
Ce–Au |
76 |
|
± 4 |
Pr–Au |
74 |
|
± 5 |
Nd–Au |
70 |
|
± 6 |
Au–Au |
52.4 |
|
± 2.2 |
Au–Pb |
31 |
|
± 23 |
Au–U |
76 |
|
± 7 |
Hg–Hg |
4.1 |
|
± 0.5 |
Hg–Tl |
1 |
|
|
Tl–Tl |
15? |
|
|
Pb–Pb |
24 |
|
± 5 |
Pb–Bi |
32 |
|
± 5 |
|
|
|
|
To convert kcal to KJ, multiply by 4.184.
Source: data from: Kerr, J. A., Parsonage, M. J., and Trotman–Dickenson, A. F., in Handbook of Chemistry and Physics, 55th ed., Weast, R. C., Ed., CRC Press, Cleveland, 1974, F–204.
©2001 CRC Press LLC

Table 64. BOND STRENGTHS IN DIATOMIC MOLECULES*
(SHEET 18 OF 18)
Molecule |
|
kcal • mol-1 |
|
|
|
|
|
|
|
|
|
Bi–Bi |
45 |
|
± 2 |
Po–Po |
44.4 |
|
± 2.3 |
At–At |
19 |
|
|
Th–Th |
<69 |
|
|
|
|
|
|
To convert kcal to KJ, multiply by 4.184.
Source: data from: Kerr, J. A., Parsonage, M. J., and Trotman–Dickenson, A. F., in Handbook of Chemistry and Physics, 55th ed., Weast, R. C., Ed., CRC Press, Cleveland, 1974, F–204.
* |
Notes for Table of Bond Strengths in Diatomic Molecules |
|
The strength of a chemical bond, D (R–X), often known as the bond dissociation energy, is defined as the heat of the reaction: RX –> R + X. It is given by: D(R–X) = ΔΗf˚(R) +
Hf˚(X) – Hf˚(RX). Some authors list bond strengths for 0K, but here the values for 298K are given because more thermodynamic data are available for this temperature. Bond strengths, or bond dissociation energies, are not equal to, and may differ considerable from, mean bond energies derived solely from thermochemical data on molecules and atoms.
The values in this table have usually been measured spectroscopically or by mass spectrometric analysis of hot gases effusing from a Knudsen cell.
©2001 CRC Press LLC

Table 65. BOND STRENGTHS OF POLYATOMIC MOLECULES*
(SHEET 1 OF 7)
|
|
Kcal • mol-1 |
|
|
|
|
|
Molecule |
Value |
|
Error |
|
|
|
|
|
|
|
|
H–CH |
102 |
|
± 2 |
H–CH2 |
110 |
|
± 2 |
H–CH3 |
104 |
|
± 1 |
H–ethynyl |
128 |
|
± 5 |
H–vinyl |
³ 108 |
|
± 2 |
H–C2H5 |
98 |
|
± 1 |
H–propargyl |
93.9 |
|
± 1.2 |
H–allyl |
89 |
|
± 1 |
H–cyclopropyl |
100.7 |
|
± 1 |
H–n–C3H7 |
98 |
|
± 1 |
H–i–C3H7 |
95 |
|
± 1 |
H–cyclobutyl |
96.5 |
|
± 1 |
H–cyclopropycarbinyl |
97.4 |
|
± 1.6 |
H–methdllyl |
83 |
|
± 1 |
H–s–C4H9 |
95 |
|
± 1 |
H–t–C4H9 |
92 |
|
± 1.2 |
H–cyclopentadien–1,3–yl–5 |
81.2 |
|
± 1.2 |
H–pentadien–1,4–yi–3 |
80 |
|
± 1 |
H–OH |
119 |
|
± 1 |
H–OCH3 |
103.6 |
|
± 1 |
H–OC2H5 |
103.9 |
|
± 1 |
H–OC(CH3)3 |
104.7 |
|
± 1 |
H–OC6H5 |
88 |
|
± 5 |
H–O2H |
90 |
|
± 2 |
|
|
|
|
To convert kcal to KJ, multiply by 4.184.
Source: data from: Kerr, J. A., Parsonage, M. J., and Trotman–Dickenson, A. F., in Handbook of Chemistry and Physics, 55th ed., Weast, R. C., Ed., CRC Press, Cleveland, 1974, F–213.
©2001 CRC Press LLC

Table 65. BOND STRENGTHS OF POLYATOMIC MOLECULES*
(SHEET 2 OF 7)
|
|
Kcal • mol-1 |
|
|
|
Molecule |
Value |
Error |
H–O2CCH3 |
112 |
± 4 |
H–O2CC2H3 |
110 |
± 4 |
H–O2Cn–C3H7 |
103 |
± 4 |
H–ONO |
78.3 |
± 0.5 |
H–ONO2 |
101.2 |
± 0.5 |
H–SH |
90 |
± 2 |
H–SCH |
³ 88 |
|
H–SiH3 |
94 |
± 3 |
H–Si(CH3)3 |
90 |
± 3 |
BH3–BH3 |
35 |
|
HC=CH |
230 |
± 2 |
H2C=CH2 |
172 |
± 2 |
H3C–CH3 |
88 |
± 2 |
CH3–C(CH3)2CH:CH2 |
69.4 |
|
C6H5CH2–C2H5 |
69 |
± 2 |
C6H5CH(CH3)– CH3 |
71 |
|
C6H5CH2–n–C3H7 |
67 |
± 2 |
CH3–CH2CN |
72.7 |
± 2 |
CH3–C(CH3)2CN |
70.2 |
± 2 |
C6H5C(CH3 )(CN)–CH3 |
59.9 |
|
NC–CN |
128 |
± 1 |
C6H5CH2CO– CH2C6H5 |
65.4 |
|
C6H5CO– CF3 |
73.8 |
|
CH3CO– COCH3 |
67.4 |
± 2.3 |
To convert kcal to KJ, multiply by 4.184.
Source: data from: Kerr, J. A., Parsonage, M. J., and Trotman–Dickenson, A. F., in Handbook of Chemistry and Physics, 55th ed., Weast, R. C., Ed., CRC Press, Cleveland, 1974, F–213.
©2001 CRC Press LLC

Table 65. BOND STRENGTHS OF POLYATOMIC MOLECULES*
(SHEET 3 OF 7)
|
|
Kcal • mol-1 |
|
|
|
|
|
Molecule |
Value |
|
Error |
|
|
|
|
|
|
|
|
C6H5CH2– COOH |
68.1 |
|
|
C6H5CH2– O2CCH3 |
67 |
|
|
C6H5CO– COC6H5 |
66.4 |
|
|
C6H5CH2– O2CC6H5 |
69 |
|
|
(C6H5CH2)2CH–COOH |
59.4 |
|
|
CH2F–CH2F |
88 |
|
± 2 |
CF2=CF2 |
76.3 |
|
± 3 |
CF3–CF3 |
96.9 |
|
± 2 |
C6H5CH2–NH2 |
71.9 |
|
± 1 |
C6H5NH–CH3 |
67.7 |
|
|
C6H5CH2–NHCH3 |
68.7 |
|
± 1 |
C6H5N(CH2)–CH3 |
65.2 |
|
|
C6H5CH2–N(CH3)2 |
60.9 |
|
± 1 |
CF3–NF2 |
65 |
|
± 2.5 |
CH2 = N2 |
≤ 41.7 |
|
± 1 |
CH3N:N–CH3 |
52.5 |
|
|
C2H5N:N–C2H5 |
50.0 |
|
|
i –C3H7N:N–i –C3H7 |
47.5 |
|
|
n –C4H9N:N–n –C4H9 |
50.0 |
|
|
i –C4H9N:N–i –C4H9 |
49.0 |
|
|
|
|
|
|
To convert kcal to KJ, multiply by 4.184.
Source: data from: Kerr, J. A., Parsonage, M. J., and Trotman–Dickenson, A. F., in Handbook of Chemistry and Physics, 55th ed., Weast, R. C., Ed., CRC Press, Cleveland, 1974, F–213.
©2001 CRC Press LLC

Table 65. BOND STRENGTHS OF POLYATOMIC MOLECULES*
(SHEET 4 OF 7)
|
|
Kcal • mol-1 |
|
|
|
|
|
Molecule |
Value |
|
Error |
|
|
|
|
|
|
|
|
s –C4H9N:N–s –C4H9 |
46.7 |
|
|
t –C4H9N:N–t –C4H9 |
43.5 |
|
|
C6H5CH2N:N–C6H5CH2 |
37.6 |
|
|
CF3N:N–CF3 |
55.2 |
|
|
C2H5–NO2 |
62 |
|
|
O=CO |
127.2 |
|
± 0.1 |
CH3–O2SCH3 |
66.8 |
|
|
Allyl–O2SCH3 |
49.6 |
|
|
C6H5CH2–O2SCH3 |
52.9 |
|
|
C6H5S–CH3 |
60 |
|
|
C6H5CH2–SCH3 |
53.8 |
|
|
F–CH3 |
103 |
|
± 3 |
Cl–CN |
97 |
|
± 1 |
Cl–COC6H5 |
74 |
|
± 3 |
Cl–CF3 |
86.1 |
|
± 0.8 |
Cl–CCl2F |
73 |
|
± 2 |
Cl–C2F5 |
82.7 |
|
± 1.7 |
Br–CH3 |
70.0 |
|
± 1.2 |
Br–CN |
83 |
|
± 1 |
Br–COC6H5 |
64.2 |
|
|
Br–CF3 |
70.6 |
|
± 1.0 |
Br–CBr3 |
56.2 |
|
± 1.8 |
Br–C2F5 |
68.7 |
|
± 1.5 |
Br –n –C3F |
66.5 |
|
± 2.5 |
|
|
|
|
To convert kcal to KJ, multiply by 4.184.
Source: data from: Kerr, J. A., Parsonage, M. J., and Trotman–Dickenson, A. F., in Handbook of Chemistry and Physics, 55th ed., Weast, R. C., Ed., CRC Press, Cleveland, 1974, F–213.
©2001 CRC Press LLC

Table 65. BOND STRENGTHS OF POLYATOMIC MOLECULES*
(SHEET 5 OF 7)
|
|
Kcal • mol-1 |
|
|
|
Molecule |
Value |
Error |
I–CH3 |
56.3 |
± 1 |
1–norbornyl |
62.5 |
± 2.5 |
I–CN |
73 |
± 1 |
I–CF3 |
53.5 |
± 2 |
CH3–Ga(CH3)2 |
59.5 |
|
CH3–CdCH3 |
54.4 |
|
CH3–HgCH3 |
57.5 |
|
C2H5–HgC2H5 |
43.7 |
± 1 |
n –C3H7–Hg n –C3H7 |
47.1 |
|
i –C3H7–Hg i –C3H7 |
40.7 |
|
C6H5–HgC6H5 |
68 |
|
CH3 –Tl(CH3)2 |
36.4 |
± 0.6 |
CH3–Pb(CH3)3 |
49.4 |
± 1 |
NH2–NH2 |
70.8 |
± 2 |
NH2–NHCH3 |
64.8 |
|
NH2 –N(CH3)2 |
62.7 |
|
NH2 –NHC6H5 |
51.1 |
|
NO–NO2 |
9.5 |
± 0.5 |
NO2–NO2 |
12.9 |
± 0.5 |
NF2–NF2 |
21 |
± 1 |
O–N2 |
40 |
|
O–NO |
73 |
|
HO–N:CHCH3 |
49.7 |
|
Cl–NF2 |
≈ 32 |
|
To convert kcal to KJ, multiply by 4.184.
Source: data from: Kerr, J. A., Parsonage, M. J., and Trotman–Dickenson, A. F., in Handbook of Chemistry and Physics, 55th ed., Weast, R. C., Ed., CRC Press, Cleveland, 1974, F–213.
©2001 CRC Press LLC
Table 65. BOND STRENGTHS OF POLYATOMIC MOLECULES*
(SHEET 6 OF 7)
|
|
Kcal • mol-1 |
|
|
|
|
|
Molecule |
Value |
|
Error |
|
|
|
|
|
|
|
|
HO–OH |
51 |
|
± 1 |
CH3O–OCH3 |
36.9 |
|
± 1 |
HO–OC(CH3)3 |
42.5 |
|
|
C2H5O–OC2H5 |
37.3 |
|
± 1.2 |
n –C3H7O–O n –C3H7 |
37.2 |
|
± 1 |
i –C3H7O–O i –C3H7 |
37.0 |
|
± 1 |
s –C4H9O–O s –C4H9 |
36.4 |
|
± 1 |
t –C4H9O–O t –C4H9 |
37.4 |
|
± 1 |
(CH3)3CCH2O–OCH2C(CH3)3 |
36.4 |
|
± 1 |
O–O2CIF |
58.4 |
|
|
CH3CO2–O2CCH3 |
30.4 |
|
± 2 |
C2H5CO2–O2CC2H5 |
30.4 |
|
± 2 |
n –C3H7CO2–O2Cn –C3H7 |
30.4 |
|
± 2 |
O–SO |
132 |
|
± 2 |
F–OCF3 |
43.5 |
|
± 0.5 |
Cl–OH |
60 |
|
± 3 |
O–ClO |
59 |
|
± 3 |
Br–OH |
56 |
|
± 3 |
I–OH |
56 |
|
± 3 |
ClO3–ClO4 |
58.4 |
|
|
|
|
|
|
To convert kcal to KJ, multiply by 4.184.
Source: data from: Kerr, J. A., Parsonage, M. J., and Trotman–Dickenson, A. F., in Handbook of Chemistry and Physics, 55th ed., Weast, R. C., Ed., CRC Press, Cleveland, 1974, F–213.
©2001 CRC Press LLC

Table 65. BOND STRENGTHS OF POLYATOMIC MOLECULES*
(SHEET 7 OF 7)
|
|
Kcal • mol-1 |
|
|
|
Molecule |
Value |
Error |
O = PF3 |
130 |
± 5 |
O = PCl3 |
122 |
± 5 |
O = PBr3 |
119 |
± 5 |
SiH3–SiH3 |
81 |
± 4 |
(CH3)3Si–Si(CH3)3 |
80.5 |
|
To convert kcal to KJ, multiply by 4.184.
Source: data from: Kerr, J. A., Parsonage, M. J., and Trotman–Dickenson, A. F., in Handbook of Chemistry and Physics, 55th ed., Weast, R. C., Ed., CRC Press, Cleveland, 1974, F–213.
*The values refer to a temperature of 298 K and have mostly been determined by kinetic methods. Some have been calculated from formation of the species involved according to equations:
D(R–X) = Hf˚ (R•) + Hf˚(X•) – Hf˚ (RX) or D(R–X) = 2 Hf˚ (R•) – Hf˚ (RR)
©2001 CRC Press LLC

Table 66. SOLUBILITY OF COPPER AND COPPER ALLOYS
|
|
|
Solid Solubility at 20 °C |
Family |
Wrought Alloys UNS Numbers |
Principal Alloying Element |
(at. %) |
|
|
|
|
|
|
|
|
Brasses |
C20000, C30000, C40000, C66400 to C69800 |
Zn |
37 |
Phosphor bronzes |
C50000 |
Sn |
9 |
Aluminum bronzes |
C60600 to C64200 |
Al |
19 |
Silicon bronzes |
C64700 to C66100 |
Si |
8 |
Copper nickels, nickel silvers |
C70000 |
Ni |
100 |
|
|
|
|
Data from ASM Metals Reference Book, Third Edition, Michael Bauccio, Ed., ASM International, Materials Park, OH, p439, (1993).
©2001 CRC Press LLC

Table 67. HEAT OF FORMATION OF INORGANIC OXIDES
(SHEET 1 OF 16)
Reaction |
Temperature range of validity |
H0 |
2.303a |
b |
c |
I |
|
|
|
|
|
|
|
|
|
|
|
|
|
|
2 Ac(c) + 3/2 O2(g) = Ac2O3(c) |
298.16–1,000K |
–446,090 |
–16.12 |
– |
– |
+109.89 |
2 Al(c) + 1/2 O2(g) = Al2O(g) |
298.16–931.7K |
–31,660 |
+14.97 |
– |
– |
–72.74 |
2 Al(l) + 1/2 O2(g) = Al2O(g) |
931.7–2,000K |
–38,670 |
+10.36 |
– |
– |
–51.53 |
Al(c) + 1/2 O2(g) = AlO(g) |
298.16–931.7K |
+10,740 |
+5.76 |
– |
– |
–37.61 |
Al(l) + 1/2 O2(g) = AlO(g) |
931.7–2,000K |
+8,170 |
+5.76 |
– |
– |
–34.85 |
2 Al(c) + 3/2 O2(g) = Al2O3 (corundum) |
298.16–931.7K |
–404,080 |
–15.68 |
+2.18 |
+3.935 |
+123.64 |
2 Al(l) + 3/2 O2(g) = Al2O3 (corundum) |
931.7–2,000K |
–407,950 |
–6.19 |
–0.78 |
+3.935 |
+102.37 |
2 Sb(c) + 3/2 O2(g) = Sb2O3 (cubic) |
298.16–842K |
–169,450 |
+6.12 |
–6.01 |
–0.30 |
+52.21 |
2 Sb(c) + 3/2 O2(g) = Sb2O3 (orthorhombic) |
298.16–903K |
–168,060 |
+6.12 |
–6.01 |
–0.30 |
+50.56 |
2 As(c) + 3/2 O2(g) = As2O3 (orthorhombic) |
298.16–542K |
–154,870 |
+29.54 |
–21.33 |
–0.30 |
–8.83 |
2 As(c) + 3/2 O2(g) = As2O3 (monoclinic) |
298.16–586K |
–150,760 |
+29.54 |
–21.33 |
–0.30 |
–16.95 |
2 As(c) + 5/2 O2(g) = As2O5(c) |
298.16–883K |
–217,080 |
+12.32 |
–4.65 |
–0.50 |
+80.50 |
|
|
|
|
|
|
|
The Ho values are given in gram calories per mole. The a, b, and I values listed here make it possible for one to calculate the F and S values by use
of the following equations: |
F |
= ΔΗ + 2.303aT log T + b x 10–3 T2 |
+ c x l05 T–1 + IT |
|
t |
o |
|
St = – a – 2.303a log T – 2b x 10–3T + c x l05 T–2 – I
Source: data from CRC Handbook of Materials Science, Vol I, Charles T. Lynch, Ed., CRC Press, Cleveland, (1974).
©2001 CRC Press LLC

Table 67. HEAT OF FORMATION OF INORGANIC OXIDES
(SHEET 2 OF 16)
Reaction |
Temperature range of validity |
H0 |
2.303a |
b |
c |
I |
|
|
|
|
|
|
|
|
|
|
|
|
|
|
Ba(α) + 1/2 O2(g) = BaO(c) |
298.16–648K |
–134,590 |
–7.60 |
+0.87 |
+0.42 |
+45.76 |
Ba(β) + 1/2 O2(g) = BaO(c) |
648–977K |
–134,140 |
–3.34 |
–0.56 |
+0.42 |
+34.01 |
Be(c) + 1/2 O2(g) = BeO(c) |
298.16–1,556K |
–144,220 |
–1.91 |
–0.46 |
+1.24 |
+30.64 |
Bi(c) + 1/2 O2(g) = BiO(c) |
298.16–544K |
–50,450 |
–4.61 |
– |
– |
+35.51 |
Bi(l) + 1/2 O2(g) = BiO(c) |
544–1,600K |
–52,920 |
–4.61 |
– |
– |
+40.05 |
2 Bi(c) + 3/2 O2(g) = Bi2O3(c) |
298.16–544K |
–139,000 |
–11.56 |
+2.15 |
–0.30 |
+96.52 |
2 Bi(l) + 3/2 O2(g) = Bi2O3(c) |
544–1,090K |
–142,270 |
+2.30 |
–3.25 |
–0.30 |
+67.55 |
2 B(c) + 3/2 O2(g) = B2O(c) |
298.16–723K |
–304,690 |
+11.72 |
–7.55 |
+0.355 |
+34.25 |
2 B(c) + 3/2 O2(g) = B2O3(gl) |
298.16–723K |
–298,670 |
+26.57 |
–15.90 |
–0.30 |
–10.40 |
Cd(c) + 1/2 O2(g) = CdO(c) |
298.16–594K |
–62,330 |
–2.05 |
+0.71 |
–0.10 |
+29.17 |
Cd(l) + 1/2 O2(g) = CdO(c) |
594–1,038K |
–63,240 |
+2.07 |
–0.76 |
–0.10 |
+20.14 |
Ca(α) + 1/2 O2(g) = CaO(c) |
298.16–673K |
–151,850 |
–6.56 |
+1.46 |
+0.68 |
+43.93 |
Ca(β) + 1/2 O2(g) = CaO(c) |
673–1,124K |
–151,730 |
–4.14 |
+0.41 |
+0.68 |
+37.63 |
The Ho values are given in gram calories per mole. The a, b, and I values listed here make it possible for one to calculate the F and S values by use
of the following equations: |
F |
= ΔΗ + 2.303aT log T + b x 10–3 T2 |
+ c x l05 T–1 + IT |
|
t |
o |
|
St = – a – 2.303a log T – 2b x 10–3T + c x l05 T–2 – I
Source: data from CRC Handbook of Materials Science, Vol I, Charles T. Lynch, Ed., CRC Press, Cleveland, (1974).
©2001 CRC Press LLC

Table 67. HEAT OF FORMATION OF INORGANIC OXIDES
(SHEET 3 OF 16)
Reaction |
Temperature range of validity |
H0 |
2.303a |
b |
c |
I |
|
|
|
|
|
|
|
|
|
|
|
|
|
|
C(graphite) + 1/2 O2(g) = CO(g) |
298.16–2,000K |
–25,400 |
+2.05 |
+0.27 |
–1.095 |
–28.79 |
C(graphite) + O2(g) = CO2(g) |
298.16–2,000K |
–93,690 |
+1.63 |
–0.7 |
–0.23 |
–5.64 |
2 Ce(c) + 3/2 O2(g) = Ce2O3(c) |
298.16–1,048K |
–435,600 |
–4.60 |
– |
– |
+92.84 |
2 Ce(l) + 3/2 O2(g) = Ce2O3(c) |
1,048–1,900K |
–440,400 |
–4.60 |
– |
– |
+97.42 |
Ce(c) + O2(g) = CeO2(c) |
298.16–1,048K |
–245,490 |
–6.42 |
+2.34 |
–0.20 |
+67.79 |
Ce(l) + O2(g) = CeO2(c) |
1,048–2,000K |
–247,930 |
+0.71 |
–0.66 |
–0.20 |
+51.73 |
2 Cs(c) + 1/2 O2(g) = Cs2O(c) |
298.16–301.5K |
–75,900 |
– |
– |
– |
+36.60 |
2 Cs(l) + 1/2 O2(g) = Cs2O(c) |
301.5–763K |
–76,900 |
– |
– |
– |
+39.92 |
2 Cs(l) + 1/2 O2(g) = Cs2O(l) |
763–963K |
–75,370 |
–9.21 |
– |
– |
+64.47 |
2 Cs(g) + 1/2 O2(g) = Cs2O(l) |
963–1,500K |
–113,790 |
–23.03 |
– |
– |
+145.60 |
2 Cs(c) + 3/2 O2(g) = Cs2O3(c) |
298.16–301.5K |
–112,690 |
–11.51 |
– |
– |
+110.10 |
2 Cs(l) + 3/2 O2(g) = Cs2O3(c) |
301.5–775K |
–113,840 |
–12.66 |
– |
– |
+116.77 |
The Ho values are given in gram calories per mole. The a, b, and I values listed here make it possible for one to calculate the F and S values by use
of the following equations: |
F |
= ΔΗ + 2.303aT log T + b x 10–3 T2 |
+ c x l05 T–1 + IT |
|
t |
o |
|
St = – a – 2.303a log T – 2b x 10–3T + c x l05 T–2 – I
Source: data from CRC Handbook of Materials Science, Vol I, Charles T. Lynch, Ed., CRC Press, Cleveland, (1974).
©2001 CRC Press LLC

Table 67. HEAT OF FORMATION OF INORGANIC OXIDES
(SHEET 4 OF 16)
Reaction |
Temperature range of validity |
H0 |
2.303a |
b |
c |
I |
|
|
|
|
|
|
|
|
|
|
|
|
|
|
2 Cs(l) + 3/2 O2(g) = Cs2O3(l) |
775–963K |
–110,740 |
–26.48 |
– |
– |
+152.70 |
2 Cs(g) + 3/2 O2(g) = Cs2O3(l) |
963–1,500K |
–148,680 |
–39.14 |
– |
– |
+229.87 |
Cl2(g) + 1/2 O2(g) = Cl2O(g) |
298.16–2,000K |
+17,770 |
–0.71 |
–0.12 |
+0.49 |
+16.81 |
1/2 Cl2(g) + 1/2 O2(g) = ClO(g) |
298.16–1,000K |
+33,000 |
– |
– |
– |
0.24 |
2 Cl2(g) + 3/2 O2(g) = ClO(g) |
298.16–500K |
+37,740 |
+5.76 |
– |
– |
+21.42 |
2 Cr(c) + 3/2 O2(g) = Cr2O3(β) |
298.16–1,823K |
–274,670 |
–14.07 |
+2.01 |
+0.69 |
+105.65 |
2 Cr(l) + 3/2 O2(g) = Cr2O3(β) |
1,823–2,000K |
–278,030 |
+2.33 |
–0.35 |
+1.57 |
+58.29 |
Cr(c) + O2(g) = CrO2 (c) |
298.16–1,000K |
–142,500 |
– |
– |
– |
+42.00 |
Cr(c) + 3/2 O2(g) = CrO3(c) |
298.16–471K |
–141,590 |
–13.82 |
– |
– |
+103.90 |
Cr(c) + 3/2 O2(g) = Cr2O3(l) |
471–600K |
–141,580 |
–32.24 |
– |
– |
+153.14 |
Co(α,β) + 1/2 O2(g) = CoO(c) |
298.16–1,400K |
–56,910 |
+0.69 |
– |
– |
+16.03 |
Co(γ) + 1/2 O2(g) = CoO(c) |
1,400–1,763K |
–58,160 |
–1.15 |
– |
– |
+22.71 |
2 Cu(c) + 1/2 O2(g) = Cu2O(c) |
298.16–1,357K |
+10,550 |
–1.15 |
–1.10 |
–0.10 |
+21.92 |
2 Cu(l) + 1/2 O2(g) = Cu2O(c) |
1,357–1,502K |
–43,880 |
+8.47 |
–2.60 |
–0.10 |
–3.72 |
The Ho values are given in gram calories per mole. The a, b, and I values listed here make it possible for one to calculate the F and S values by use
of the following equations: |
F |
= ΔΗ + 2.303aT log T + b x 10–3 T2 |
+ c x l05 T–1 + IT |
|
t |
o |
|
St = – a – 2.303a log T – 2b x 10–3T + c x l05 T–2 – I
Source: data from CRC Handbook of Materials Science, Vol I, Charles T. Lynch, Ed., CRC Press, Cleveland, (1974).
©2001 CRC Press LLC

Table 67. HEAT OF FORMATION OF INORGANIC OXIDES
(SHEET 5 OF 16)
Reaction |
Temperature range of validity |
H0 |
2.303a |
b |
c |
I |
|
|
|
|
|
|
|
|
|
|
|
|
|
|
2 Cu(l) + 1/2 O2(g) = Cu2O(l) |
1,502–2,000K |
–37,710 |
–12.48 |
+0.25 |
–0.10 |
+54.44 |
Cu(c) + 1/2 O2(g) = CuO(c) |
298.16–1,357K |
–37,740 |
–0.64 |
–1.40 |
–0.10 |
+24.87 |
Cu(l) + 1/2 O2(g) = CuO(c) |
1,357–1,720K |
–39,410 |
+4.17 |
–2.15 |
–0.10 |
+12.05 |
Cu(l) + 1/2 O2(g) = CuO(l) |
1,720–2,000K |
–41,060 |
–11.35 |
+0.25 |
–0.10 |
+59.09 |
2 Au(c) + 3/2 O2(g) = Au2O3(c) |
298.16–500K |
–2,160 |
–10.36 |
– |
– |
+95.14 |
Hf(c) + O2(g) = HfO2 (monoclinic) |
298.16–2,000K |
–268,380 |
–9.74 |
–0.28 |
+1.54 |
+78.16 |
H2(g) + 1/2 O2(g) = H2O(l) |
298.16–373.16K |
–70,600 |
–18.26 |
+0.64 |
–0.04 |
+91.67 |
H2(g) + 1/2 O2(g) = H2O(g) |
298.16–2,000K |
–56,930 |
+6.75 |
–0.64 |
–0.08 |
–8.74 |
D2(g) + 1/2 O2(g) = D2O(l) |
298.16–374.5K |
–72,760 |
–18.10 |
– |
– |
+93.59 |
D2(g) + 1 /2 O2(g) = D2O(g) |
298.16–2,000K |
–58,970 |
+5.50 |
–0.75 |
+0.085 |
–3.74 |
0.947 Fe(α) + 1/2 O2(g) = Fe0.9470(c) |
298.16–1,033K |
–65,320 |
–11.26 |
+2.61 |
+0.44 |
+48.60 |
0.947 Fe(α) + 1/2 O2(g) = Fe0.9470(c) |
1,033–1,179K |
–62,380 |
+4.08 |
–0.75 |
+0.235 |
+3.00 |
The Ho values are given in gram calories per mole. The a, b, and I values listed here make it possible for one to calculate the F and S values by use
of the following equations: |
F |
= ΔΗ + 2.303aT log T + b x 10–3 T2 |
+ c x l05 T–1 + IT |
|
t |
o |
|
St = – a – 2.303a log T – 2b x 10–3T + c x l05 T–2 – I
Source: data from CRC Handbook of Materials Science, Vol I, Charles T. Lynch, Ed., CRC Press, Cleveland, (1974).
©2001 CRC Press LLC

Table 67. HEAT OF FORMATION OF INORGANIC OXIDES
(SHEET 6 OF 16)
|
|
Reaction |
Temperature range of validity |
H0 |
2.303a |
b |
c |
I |
|
|
|
|
|
|
|
|
|
0.947 |
Fc(β) + 1/2 O2(g) = Fe0.9470(c) |
1,179–1,650K |
–66,750 |
–8.04 |
+0.67 |
–0.10 |
+42.28 |
|
0.947 |
Fe(γ) + 1/2 O2(g) = Fe0.9470(l) |
1,650–1,674K |
–64,200 |
–18.72 |
+1.67 |
–0.10 |
+73.45 |
|
0.947 |
Fe(γ) + 1/2 O2(g) = Fe0.9470(l) |
1,647–1,803K |
–59,650 |
–6.84 |
+0.25 |
–0.10 |
+34.81 |
|
0.947 |
Fe(δ) + 1/2 O2(g) = Fe0.9470(l) |
1,803–2,000K |
–63,660 |
–7.48 |
+0.25 |
–0.10 |
+39.12 |
|
3 |
Fe(α) + 2 O2(g) = Fe3O4(magnetite) |
298.16–900K |
–268,310 |
+5.87 |
–12.45 |
+0.245 |
+73.11 |
|
3 |
Fe(α) + 2 O2(g) = Fe3O4(β) |
900–1,033K |
–272,300 |
–54.27 |
+11.65 |
+0.245 |
+233.52 |
|
3 |
Fe(β) + 2 O2(g) = Fe3O4(β) |
1,033–1,179K |
–262,990 |
–5.71 |
+1.00 |
–0.40 |
+89.19 |
|
3 |
Fe(γ) + 2 O2(g) = Fe3O4(β) |
1,179–1,674K |
–276,990 |
~4.05 |
+5.50 |
–0.40 |
+213.52 |
|
2 |
Fe(α) + 3/2 O2(g) = Fe2O3(hematite) |
298.16–950K |
–200,000 |
–13.84 |
–1.45 |
+1.905 |
+108.26 |
|
2 |
Fe(α) + 3/2 O2(g) = Fe2O3(β) |
950–1,033K |
–202,960 |
–42.64 |
+7.85 |
+0.13 |
+188.48 |
|
2 |
Fe(β) + 3/2 O2(g) = Fe2O3(β) |
1,033–1,050K |
–196,740 |
–10.27 |
+0.75 |
–0.30 |
+92.26 |
|
2 |
Fe(β) + 3/2 O2(g) = Fe2O3(γ) |
1,050–1,179K |
–193,200 |
–0.39 |
–0.13 |
–0.30 |
+59.96 |
|
2 |
Fe(γ) + 3/2 O2(g) = Fe2O3(γ) |
1,179–1,674K |
–202,540 |
–25.95 |
+2.87 |
–0.30 |
+142.85 |
|
|
|
|
|
|
|
|
|
|
The Ho values are given in gram calories per mole. The a, b, and I values listed here make it possible for one to calculate the F and S values by use
of the following equations: |
F |
= ΔΗ + 2.303aT log T + b x 10–3 T2 |
+ c x l05 T–1 + IT |
|
t |
o |
|
St = – a – 2.303a log T – 2b x 10–3T + c x l05 T–2 – I
Source: data from CRC Handbook of Materials Science, Vol I, Charles T. Lynch, Ed., CRC Press, Cleveland, (1974).
©2001 CRC Press LLC

Table 67. HEAT OF FORMATION OF INORGANIC OXIDES
(SHEET 7 OF 16)
Reaction |
Temperature range of validity |
H0 |
2.303a |
b |
c |
I |
|
|
|
|
|
|
|
2 Fe(α) + 3/2 O2(g) = Fe2O3(γ) |
1,674–1,800K |
–192,920 |
–0.85 |
–0.13 |
–0.30 |
+61.21 |
Pb(c) + 1/2 O2(g) = PbO (red) |
298.16–600.5K |
–52,800 |
–2.76 |
–0.80 |
–0.10 |
+32.49 |
Pb(l) + 1/2 O2(g) = PbO (red) |
600.5–762K |
–53,780 |
–0.51 |
–1.75 |
–0.10 |
+28.44 |
Pb(c) + 1/2 O2(g) = PbO (yellow) |
298.16–600.5K |
–52,040 |
+0.81 |
–2.00 |
–0.10 |
+22.13 |
Pb(l) + 1/2 O2(g) = PbO (yellow) |
600.5–1,159K |
–53,020 |
+3.06 |
–2.95 |
–0.10 |
+18.08 |
I2(c) + 5/2 O2(g) = I2O5(c) |
298.16–386.8K |
–42,040 |
+2.30 |
– |
– |
+113.71 |
I2(l) + 5/2 O2(g) = I2O5(c) |
386.8–456K |
–43,490 |
+16.12 |
– |
– |
+81.70 |
I2(g) + 5/2 O2(g) = I2O5(c) |
456–500K |
–58,020 |
–6.91 |
– |
– |
+174.79 |
Ir(c) + O2(g) = IrO2(c) |
298.16–1,300K |
–39,480 |
+8.17 |
–6.39 |
–0.20 |
+20.33 |
3 Pb(c) + 2 O2(g) = Pb3O4(c) |
298.16–600.5K |
–174,920 |
+8.82 |
–8.20 |
–0.40 |
+72.78 |
Pb(c) + O2(g) = PbO2(c) |
298.16–600.5K |
–66,120 |
+0.64 |
–2.45 |
–0.20 |
+45.58 |
2 Li(c) + 1/2 O2(g) = Li2O(c) |
298.16–452K |
–142,220 |
–3.06 |
+5.77 |
–0.10 |
+34.19 |
|
|
|
|
|
|
|
The Ho values are given in gram calories per mole. The a, b, and I values listed here make it possible for one to calculate the F and S values by use
of the following equations: |
F |
= ΔΗ + 2.303aT log T + b x 10–3 T2 |
+ c x l05 T–1 + IT |
|
t |
o |
|
St = – a – 2.303a log T – 2b x 10–3T + c x l05 T–2 – I
Source: data from CRC Handbook of Materials Science, Vol I, Charles T. Lynch, Ed., CRC Press, Cleveland, (1974).
©2001 CRC Press LLC
Table 67. HEAT OF FORMATION OF INORGANIC OXIDES
(SHEET 8 OF 16)
Reaction |
Temperature range of validity |
H0 |
2.303a |
b |
c |
I |
|
|
|
|
|
|
|
|
|
|
|
|
|
|
Mg(c) + 1/2 O2(g) = MgO (periclase) |
298.16–923K |
–144,090 |
–1.06 |
+0.13 |
+0.25 |
+29.16 |
Mg(l) + 1/2 O2(g) = MgO (periclase) |
923–1,393K |
–145,810 |
+1.84 |
–0.62 |
+0.64 |
+23.07 |
Mg(g) + 1/2 O2(g) = MgO (periclase) |
1,393–2,000K |
–180,700 |
–3.75 |
–0.62 |
+0.64 |
+65.69 |
Mn(α) + 1/2 O2(g) = MnO(c) |
298.16–1,000K |
–92,600 |
–4.21 |
+0.97 |
+0.155 |
+29.66 |
Mn(β) + 1/2 O2(g) = MnO(c) |
1,000–1,374K |
–91,900 |
+1.84 |
–0.39 |
+0.34 |
+12.15 |
Mn(γ) + 1/2 O2(g) = Mno(c) |
1,374–1,410K |
–89,810 |
+7.30 |
–0.72 |
+0.34 |
–6.05 |
Mn(δ) + 1/2 O2(g) = MnO(c) |
1,410–1,517K |
–89,390 |
+8.68 |
–0.72 |
+0.34 |
–10.70 |
Mn(l) + 1/2 O2(g) = MnO(c) |
1,517–2,000K |
–93,350 |
+7.99 |
–0.72 |
+0.34 |
–5.90 |
3 Mn(α) + 2 O2(g) = Mn3O4(α) |
298.16–1,000K |
–332,400 |
–7.41 |
+0.66 |
+0.145 |
+106.62 |
2 Mn(α) + 3/2 O2(g) = Mn2O3(c) |
298.16–1,000K |
–230,610 |
–5.96 |
–0.06 |
+0.945 |
+80.74 |
Mn(α) + O2(g) = MnO2(c) |
298.16–1,000K |
–126,400 |
–8.61 |
+0.97 |
+1.555 |
+70.14 |
2 Hg(l) + 1/2 O2(g) = Hg2O(c) |
298.16–629.88K |
–22,400 |
–4.61 |
– |
– |
+43.29 |
Hg(l) + 1/2 O2(g) = HgO (red) |
298.16–629.88K |
–21,760 |
+0.85 |
–2.47 |
–0.10 |
+24.81 |
Mo(c) + O2(g) = MoO2(c) |
298.16–2,000K |
–132,910 |
–3.91 |
– |
– |
+47.42 |
The Ho values are given in gram calories per mole. The a, b, and I values listed here make it possible for one to calculate the F and S values by use
of the following equations: |
F |
= ΔΗ + 2.303aT log T + b x 10–3 T2 |
+ c x l05 T–1 + IT |
|
t |
o |
|
St = – a – 2.303a log T – 2b x 10–3T + c x l05 T–2 – I
Source: data from CRC Handbook of Materials Science, Vol I, Charles T. Lynch, Ed., CRC Press, Cleveland, (1974).
©2001 CRC Press LLC

Table 67. HEAT OF FORMATION OF INORGANIC OXIDES
(SHEET 9 OF 16)
Reaction |
Temperature range of validity |
H0 |
2.303a |
b |
c |
I |
|
|
|
|
|
|
|
|
|
|
|
|
|
|
Mo(c) + 3/2 O2(g) = MoO3(c) |
298.16–1,068K |
–182,650 |
–8.86 |
–1.55 |
+1.54 |
+90.07 |
Ni(α) + 1/2 O2(g) = NiO(c) |
298.16–633K |
–57,640 |
–4.61 |
+2.16 |
–0.10 |
+34.41 |
Ni(β) + 1/2 O2(g) = NiO(c) |
633–1,725K |
–57,460 |
–0.14 |
–0.46 |
–0.10 |
+23.27 |
2 Nb(c) + 2 O2(g) = Nb2O4(c) |
298.16–2,000K |
–382,050 |
–9.67 |
– |
– |
+116.23 |
2 Nb(c) + 5/2 O2(g) = Nb2O5(c) |
298.16–1,785K |
–458,640 |
–16.14 |
–0.56 |
+1.94 |
+157.66 |
2 Nb(c) + 5/2 O2(g) = Nb2O5(l) |
1,785–2,000K |
–463,630 |
–66.04 |
+2.21 |
–0.50 |
+317.84 |
N2(g) + 1/2 O2(g) = N2O(g) |
298.16–2,000K |
18,650 |
–1.57 |
–0.27 |
+0.92 |
+23.47 |
3/2 O2(g) = O3(g) |
298.16–2,000K |
+33,980 |
+2.03 |
–0.48 |
+0.36 |
+11.45 |
P (white) + 1/2 O2(g) = PO(g) |
298.16–317.4K |
–9,370 |
+2.53 |
– |
– |
–25.40 |
P(l) + 1/2 O2(g) = PO(g) |
317.4–553K |
–9,390 |
+3.45 |
– |
– |
–27.63 |
4 P (white) + 5 O2(g) = P4H10 (hexagonal) |
298.16–317.4K |
–711,520 |
+95.67 |
–51.50 |
–1.00 |
–28.24 |
2 K(c) + 1/2 O2(g) = K2O(c) |
298.16–336.4K |
–86,400 |
– |
– |
– |
+33.90 |
The Ho values are given in gram calories per mole. The a, b, and I values listed here make it possible for one to calculate the F and S values by use
of the following equations: |
F |
= ΔΗ + 2.303aT log T + b x 10–3 T2 |
+ c x l05 T–1 + IT |
|
t |
o |
|
St = – a – 2.303a log T – 2b x 10–3T + c x l05 T–2 – I
Source: data from CRC Handbook of Materials Science, Vol I, Charles T. Lynch, Ed., CRC Press, Cleveland, (1974).
©2001 CRC Press LLC

Table 67. HEAT OF FORMATION OF INORGANIC OXIDES
(SHEET 10 OF 16)
Reaction |
Temperature range of validity |
H0 |
2.303a |
b |
c |
I |
|
|
|
|
|
|
|
|
|
|
|
|
|
|
2 K(l) + 1/2 O2(g) = K2O(c) |
336.4–1,049K |
–87,380 |
+1.15 |
– |
– |
+33.90 |
2 K(g) + 1/2 O2(g) = K2O(c) |
1,049–1,500K |
–133,090 |
–16.12 |
– |
– |
+129.64 |
Ra(c) + 1/2 O2(g) = RaO(c) |
298.16–1,000K |
–130,000 |
– |
– |
– |
+23.50 |
Re(c) + 3/2 O2(g) = ReO3(c) |
298.16–433K |
–149,090 |
–16.12 |
– |
– |
+110.49 |
Re(c) + 3/2 O2(g) = ReO3(l) |
433–1,000K |
–146,750 |
–31.32 |
– |
– |
+145.16 |
2Re(c) + 7/2 02(g) = Re2O7(c) |
298.16–569K |
–301,470 |
–34.64 |
– |
– |
+250.57 |
2 Re(c) + 7/2 02(g) = Re2O7(l) |
569–635.5K |
–295,810 |
–73.68 |
– |
– |
+348.45 |
2 Re(c) + 4 O2(g) = Re2O8(l) |
420–600K |
–318,470 |
–87.50 |
– |
– |
+425.32 |
2 Rb(c) + 1/2 O2(g) = Rb2O(c) |
298.16–312.2K |
–78,900 |
– |
– |
– |
+32.20 |
2 Rb(l) + 1/2 O2(g) = Rb2O(c) |
312.2–750K |
–79,950 |
– |
– |
– |
+35.56 |
Se(c) + 1/2 O2(g) = SeO(g) |
298.16–490K |
+9,280 |
–3.04 |
+4.40 |
+0.30 |
–14.78 |
Se(l) + 1/2 O2(g) = SeO(g) |
490–1,027K |
+9,420 |
+8.70 |
– |
+0.30 |
–44.50 |
1/2 Se2(g) + 1/2 O2(g) = SeO(g) |
1,027–2,000K |
–7,400 |
–0.37 |
– |
+0.19 |
–0.80 |
Si(c) + 1/2 O2(g) = SiO(g) |
298.16–1,683K |
–21,090 |
+3.84 |
–0.16 |
–0.295 |
–33.14 |
The Ho values are given in gram calories per mole. The a, b, and I values listed here make it possible for one to calculate the F and S values by use
of the following equations: |
F |
= ΔΗ + 2.303aT log T + b x 10–3 T2 |
+ c x l05 T–1 + IT |
|
t |
o |
|
St = – a – 2.303a log T – 2b x 10–3T + c x l05 T–2 – I
Source: data from CRC Handbook of Materials Science, Vol I, Charles T. Lynch, Ed., CRC Press, Cleveland, (1974).
©2001 CRC Press LLC

Table 67. HEAT OF FORMATION OF INORGANIC OXIDES
(SHEET 11 OF 16)
Reaction |
Temperature range of validity |
H0 |
2.303a |
b |
c |
I |
|
|
|
|
|
|
|
|
|
|
|
|
|
|
Si(l) + 1/2 O2(g) = SiO(g) |
1,683–2,000K |
–30,170 |
–7.78 |
–0.12 |
+0.25 |
–40.01 |
Si(c) + O2(g) = SiO2(α–quartz) |
298.16–848K |
–210,070 |
+3.98 |
–3.32 |
+0.605 |
+34.59 |
Si(c) + O2(g) = SiO2(β–quartz) |
848–1,683K |
–209,920 |
–3.36 |
–0.19 |
–0.745 |
+53.44 |
Si(l) + O2(g) = SiO2(l) |
1,883–2,000K |
–228,590 |
–15.66 |
– |
– |
+103.97 |
Si(c) + O2(g) = SiO2(α–cristobalite) |
298.16–523K |
–207,330 |
+19.96 |
–9.75 |
–0.745 |
–9.78 |
Si(c) + O2(g) = SiO2(β–cristobalite) |
523–1,683K |
–209,820 |
–3.34 |
–0.24 |
–0.745 |
+53.35 |
Si(c) + 02(g) = SiO2(α–tridymite) |
298.16–390K |
–207,030 |
+22.29 |
–11.62 |
–0.745 |
–15.64 |
Si(c) + O2(g) = SiO2(β–tridymite) |
390–1,683K |
–209,350 |
–1.59 |
–0.54 |
–0.745 |
+47.86 |
2 Ag(c) + 1/2 O2(g) = Ag2O2(c) |
298.16–1,000K |
–7,740 |
–4.14 |
– |
– |
+27.84 |
2 Ag(c) + O2(g) = Ag2O2(c) |
298.16–500K |
–6,620 |
–3.22 |
– |
– |
+52.17 |
2 Na(c) + 1/2 O2(g) = Na2O(c) |
298.16–371K |
–99,820 |
–7.51 |
+5.47 |
–0.10 |
+50.43 |
2 Na(l) + 1/2 O2(g) = Na2O(c) |
371–1,187K |
–100,150 |
+4.97 |
–2.45 |
–0.10 |
+22.19 |
The Ho values are given in gram calories per mole. The a, b, and I values listed here make it possible for one to calculate the F and S values by use
of the following equations: |
F |
= ΔΗ + 2.303aT log T + b x 10–3 T2 |
+ c x l05 T–1 + IT |
|
t |
o |
|
St = – a – 2.303a log T – 2b x 10–3T + c x l05 T–2 – I
Source: data from CRC Handbook of Materials Science, Vol I, Charles T. Lynch, Ed., CRC Press, Cleveland, (1974).
©2001 CRC Press LLC
Table 67. HEAT OF FORMATION OF INORGANIC OXIDES
(SHEET 12 OF 16)
Reaction |
|
|
|
Temperature range of validity |
|
H0 |
2.303a |
b |
|
c |
I |
|
|
|
|
|
|
|
|
|
|
|
|
|
|
|
|
|
|
|
|
|
|
|
|
2 Na(c) + O2(g) = Na2O2(c) |
|
|
|
298.16–371K |
|
–122,500 |
–2.30 |
– |
|
– |
+57.51 |
Sr(c) + 1/2 O2(g) = SrO(c) |
|
|
|
298.16–1,043K |
|
–142,410 |
–6.79 |
+0.305 |
|
+0.675 |
+44.33 |
S(rhombohedral) + 1/2 O2(g) = SO(g) |
298.16–368.6K |
|
+19,250 |
–1.24 |
+2.95 |
|
+0.225 |
–18.84 |
|||
S(monoclmic) + 1/2 O2(g) = SO(g) |
|
368.6–392K |
|
+19,200 |
–1.29 |
+3.31 |
|
+0.225 |
–18.72 |
||
S(lλ,μ) + 1/2 O2(g) = SO(g) |
|
|
|
392–718K |
|
+20,320 |
+10.22 |
–0.17 |
|
+0.225 |
–50.05 |
1/2 S2 (g) + 1/2 O2(g) = SO(g) |
|
|
|
298.16–2,000K |
|
+3,890 |
+0.07 |
– |
|
– |
–1.50 |
S(rhombohedral) + O2(g) = SO2(g) |
|
298.16–368.6K |
|
–70,980 |
+0.83 |
+2.35 |
|
+0.51 |
–5.85 |
||
S(monoclinic) + O2(g) = SO2(g) |
|
|
|
368.6–392K |
|
–71,020 |
+0.78 |
+2.71 |
|
+0.51 |
–5.74 |
S(lλ,μ) + O2(g) = SO2(g) |
|
|
|
392–718K |
|
–69,900 |
+12.30 |
–0.77 |
|
+0.51 |
–37.10 |
1/2 S2(g) + O2(g) = SO2(g) |
|
|
|
298.16–2,000K |
|
–86,330 |
+2.42 |
–0.70 |
|
+0.31 |
+10.71 |
S(rhombohedral) + 3/2 O2(g) = SO3(c–I) |
298.16–335.4K |
|
–111,370 |
–6.45 |
– |
|
– |
+88.32 |
|||
S(rhombohedral) + 3/2 O2(g) = SO3(c–II) |
298.16–305.7K |
|
–108,680 |
–11.97 |
– |
|
– |
+94.95 |
|||
S(rhombohedral) + 3/2 O2(g) = SO3(l) |
298.16–335.4K |
|
–107,430 |
–21.18 |
– |
|
– |
+113.76 |
|||
|
|
||||||||||
The Ho values are given in gram calories per mole. The a, b, and I values listed here make it possible for one to calculate the |
F and S values by use |
||||||||||
of the following equations: |
F |
t |
= ΔΗ + 2.303aT log T + b x 10–3 T2 + c x l05 |
T–1 + IT |
|
|
|
|
|
||
|
|
o |
|
|
|
|
|
|
|
|
|
St = – a – 2.303a log T – 2b x 10–3T + c x l05 T–2 – I
Source: data from CRC Handbook of Materials Science, Vol I, Charles T. Lynch, Ed., CRC Press, Cleveland, (1974).
©2001 CRC Press LLC

Table 67. HEAT OF FORMATION OF INORGANIC OXIDES
(SHEET 13 OF 16)
|
Reaction |
Temperature range of validity |
H0 |
2.303a |
b |
c |
I |
|
|
|
|
|
|
|
|
|
|
|
|
|
|
|
|
S(rhombohedral) + 3/2 O2(g) = SO3(g) |
298.16–368.6K |
–95,070 |
+1.43 |
+0.66 |
+1.26 |
+16.81 |
|
S(monoclinic) + 3/2 O2(g) = SO3(g) |
368.6–392K |
–95,120 |
+1.38 |
+1.02 |
+1.26 |
+16.93 |
|
S(lλ,μ) + 3/2 O2(g) = SO3(g) |
392–718K |
–94,010 |
+12.89 |
–2.46 |
+126 |
–14.40 |
|
1/2 S2(g) + 3/2 O2(g) = SO3(g) |
298.16–1,500K |
–110,420 |
+3.02 |
–2.39 |
+106 |
+33.41 |
|
2 Ta(c) + 5/2 O2(g) = Ta2O5(c) |
298.16–2,000K |
–492,790 |
–17.18 |
–1.25 |
+2.46 |
+161.68 |
|
Te(c) + 1/2 O2(g) = TeO(g) |
298.16–723K |
+43,110 |
+1.91 |
+0.84 |
+0.315 |
–27.22 |
|
Te(l) + 1/2 O2(g) = TeO(g) |
723–1,360K |
+39,750 |
+6.08 |
+0.09 |
+0.315 |
–33.94 |
|
2 |
Tl(α) + O2(g) = Tl2rO(c) |
298.16–505.5K |
–44,110 |
–6.91 |
– |
– |
+42.30 |
2 |
Tl(β) + O2(g) = Tl2rO(c) |
505.5–573K |
–44,260 |
–6.91 |
– |
– |
+42.60 |
2 |
Tl(α) + 3/2 O2(g) = Tl2rO3(c) |
298.16–505.5K |
–99,410 |
–16.12 |
– |
– |
+119.09 |
Th(c) + O2(g) = ThO2(c) |
298.16–2,000K |
–294,350 |
–5.25 |
+0.59 |
+0.775 |
+62.81 |
|
Sn(c) + 1/2 O2(g) = SnO(c) |
298.16–505K |
–68,600 |
–3.57 |
+1.65 |
–0.10 |
+32.59 |
|
The Ho values are given in gram calories per mole. The a, b, and I values listed here make it possible for one to calculate the F and S values by use
of the following equations: |
F |
= ΔΗ + 2.303aT log T + b x 10–3 T2 |
+ c x l05 T–1 + IT |
|
t |
o |
|
St = – a – 2.303a log T – 2b x 10–3T + c x l05 T–2 – I
Source: data from CRC Handbook of Materials Science, Vol I, Charles T. Lynch, Ed., CRC Press, Cleveland, (1974).
©2001 CRC Press LLC

Table 67. HEAT OF FORMATION OF INORGANIC OXIDES
(SHEET 14 OF 16)
Reaction |
Temperature range of validity |
H0 |
2.303a |
b |
c |
I |
|
|
|
|
|
|
|
|
|
|
|
|
|
|
Sn(l) + 1/2 O2(g) = SnO(c) |
505–1,300K |
–69,670 |
+3.06 |
–1.50 |
–0.10 |
+18.39 |
Sn(c) + O2(g) = SnO2(c) |
298.16–505K |
–0,142 |
–14.00 |
+2.45 |
+2.38 |
+90.74 |
Ti(α) + 1/2 O2(g) = TiO(α) |
298.16–1,150K |
–125,010 |
–4.01 |
–0.29 |
+0.83 |
+36.28 |
Ti(α) + 1/2 O2(g) = TiO(α) |
1,150–1,264K |
–125,040 |
+1.17 |
–1.55 |
+0.83 |
+21.90 |
2 Ti(α) + 3/2 O2(g) = Ti2O3(α) |
298.16–473K |
–360,660 |
+32.08 |
–23.49 |
–0.30 |
–10.66 |
2 Ti(α) + 3/2 O2(g) = Ti2O3(β) |
473–1,150K |
–369,710 |
–30.95 |
+2.62 |
+4.80 |
+162.79 |
Ti(α) + O2(g) = TiO2 (rutile) |
298.16–1,150K |
–228,360 |
–12.80 |
+1.62 |
+1.975 |
+82.81 |
Ti(α) + O2(g) = TiO2 (rutile) |
1,150–2,000K |
–228,380 |
–7.62 |
+0.36 |
+1.975 |
+68.43 |
W(c) + O2(g) = WO2(c) |
298.16–1,500K |
–137,180 |
–1.38 |
– |
– |
+45.56 |
4W(c) + 11/2 O2(g) = W4O11(c) |
298.16–1,700K |
–745,730 |
–32.70 |
– |
– |
+321.84 |
W(c) + 3/2 O2(g) = WO3(c) |
298.16–1,743K |
–201,180 |
–2.92 |
–1.81 |
–0.30 |
+70.89 |
W(c) + 3/2 O2(g) = WO3(l) |
1,743–2,000K |
–203,140 |
–35.74 |
+1.13 |
–0.30 |
+173.27 |
U(α) + O2(g) = UO2(c) |
298.16–935K |
–262,880 |
–19.92 |
+3.70 |
+2.13 |
+100.54 |
U(β) + O2(g) = UO2(c) |
935–1,045K |
–260,660 |
–4.28 |
–0.31 |
+1.78 |
+55.50 |
The Ho values are given in gram calories per mole. The a, b, and I values listed here make it possible for one to calculate the F and S values by use
of the following equations: |
F |
= ΔΗ + 2.303aT log T + b x 10–3 T2 |
+ c x l05 T–1 + IT |
|
t |
o |
|
St = – a – 2.303a log T – 2b x 10–3T + c x l05 T–2 – I
Source: data from CRC Handbook of Materials Science, Vol I, Charles T. Lynch, Ed., CRC Press, Cleveland, (1974).
©2001 CRC Press LLC

Table 67. HEAT OF FORMATION OF INORGANIC OXIDES
(SHEET 15 OF 16)
Reaction |
Temperature range of validity |
H0 |
2.303a |
b |
c |
I |
|
|
|
|
|
|
|
U(γ) + O2(g) = UO2(c) |
1,045–1,405K |
–262,830 |
–6.54 |
–0.31 |
+1.78 |
+64.41 |
U(l) + O2(g) = UO2(l) |
1,405–1,500K |
–264,790 |
–5.92 |
– |
– |
+63.50 |
3 U(α) + 4 O2(g) = U3O8(c) |
298.16–935K |
–863,370 |
–56.57 |
+10.68 |
+5.20 |
+330.19 |
3 U(β) + 4 O2(g) = U3O8(c) |
935–1,045K |
–856,720 |
–9.67 |
–1.35 |
+4.15 |
+195.12 |
3 U(γ) + 4 O2(g) = U3O8(c) |
1,045–1,405K |
–863,230 |
–16.44 |
–1.35 |
+4.15 |
+221.79 |
3 U(l) + 4 O2(g) = U3O8(c) |
1,405–1,500K |
–869,460 |
–10.91 |
–1.35 |
+4.15 |
+208.82 |
U(α) + 3/2 O2(g) = UO3 (hexagonal) |
298.16–935K |
–294,090 |
–18.33 |
+3.49 |
+1.535 |
+114.94 |
U(β) + 3/2 O2(g) = UO3 (hexagonal) |
935–1,045K |
–291,870 |
–2.69 |
–0.52 |
+1.185 |
+69.90 |
U(γ) + 3/2 O2(g) = UO3 (hexagonal) |
1,045–1,400K |
–294,040 |
–4.95 |
–0.52 |
+1.185 |
+78.80 |
V(c) + 1/2 O2(g) = VO(c) |
298.16–2,000K |
–101,090 |
–5.39 |
–0.36 |
+0.53 |
+38.69 |
V(c) + 1/2 O2(g) = VO(g) |
298.16–2,000K |
+52,090 |
+1.80 |
+1.04 |
+0.35 |
–28.42 |
2 V(c) + 3/2 O2(g) = V2O3(c) |
298.16–2,000K |
–299,910 |
–17.98 |
+0.37 |
+2.41 |
+118.83 |
The Ho values are given in gram calories per mole. The a, b, and I values listed here make it possible for one to calculate the F and S values by use
of the following equations: |
F |
= ΔΗ + 2.303aT log T + b x 10–3 T2 |
+ c x l05 T–1 + IT |
|
t |
o |
|
St = – a – 2.303a log T – 2b x 10–3T + c x l05 T–2 – I
Source: data from CRC Handbook of Materials Science, Vol I, Charles T. Lynch, Ed., CRC Press, Cleveland, (1974).
©2001 CRC Press LLC

Table 67. HEAT OF FORMATION OF INORGANIC OXIDES
(SHEET 16 OF 16)
Reaction |
Temperature range of validity |
H0 |
2.303a |
b |
c |
I |
|
|
|
|
|
|
|
2 V(c) + 2 O2(g) = V2O4(α) |
209.16–345K |
–342,890 |
–11.03 |
+3.00 |
–0.40 |
+117.38 |
2 V(c) + 2 O2(g) = V2O4(β) |
345–1,818K |
–345,330 |
–24.36 |
+1.30 |
+3.545 |
+155.55 |
6 V(c) + 13/2 O2(g) = V6O13(c) |
298.16–1,000K |
–1,076,340 |
–95.33 |
– |
– |
+557.61 |
2 V(c) + 5/2 O2(g) = V2O5(c) |
298.16–943K |
–381,960 |
–41.08 |
+5.20 |
+6.11 |
+228.50 |
2 Y(c) + 3/2 O2(g) = Y2O3(c) |
298.16–1,773K |
–419,600 |
+2.76 |
–1.73 |
–0.30 |
+66.36 |
Zn(c) + 1/2 O2(g) = ZnO(c) |
298.16–692.7K |
–84,670 |
–6.40 |
+0.84 |
+0.99 |
+43.25 |
Zr(α) + O2(g) = ZrO2(α) |
298.16–1,135K |
–262,980 |
–6.10 |
+0.16 |
+1.045 |
+65.00 |
Zr(β) + O2(g) = ZrO2(α) |
1,135–1,478K |
–264,190 |
–5.09 |
–0.40 |
+1.48 |
+63.58 |
Zr(β) + O2(g) = ZrO2(β) |
1.478–2,000K |
–262,290 |
–7.76 |
+0.50 |
–0.20 |
+69.50 |
|
|
|
|
|
|
|
The Ho values are given in gram calories per mole. The a, b, and I values listed here make it possible for one to calculate the F and S values by use
of the following equations: |
F |
= ΔΗ + 2.303aT log T + b x 10–3 T2 |
+ c x l05 T–1 + IT |
|
t |
o |
|
St = – a – 2.303a log T – 2b x 10–3T + c x l05 T–2 – I
Source: data from CRC Handbook of Materials Science, Vol I, Charles T. Lynch, Ed., CRC Press, Cleveland, (1974).
©2001 CRC Press LLC

Table 68. PHASE CHANGE THERMODYNAMIC PROPERTIES FOR
THE ELEMENTS
(SHEET 1 OF 7)
|
|
Transition |
Heat of |
Entropy of |
|
|
Transition |
||
|
|
Temperature |
Transition |
|
|
|
(kcal • g mole-1) |
||
Element |
Phase |
(K) |
(e.u.) |
|
|
|
|
|
|
|
|
|
|
|
Ac |
solid |
(1090) |
(2.5) |
(2.3) |
|
liquid |
(2750) |
(70) |
(25) |
Ag |
solid |
1234 |
2.855 |
2.313 |
|
liquid |
2485 |
60.72 |
24.43 |
Al |
solid |
931.7 |
2.57 |
2.76 |
|
liquid |
2600 |
67.9 |
26 |
Am |
solid |
(1200) |
(2.4) |
(2.0) |
|
liquid |
2733 |
51.7 |
18.9 |
As |
solid |
883 |
3.25 |
35.25 |
Au |
solid |
1336.16 |
3.03 |
2.27 |
|
liquid |
2933 |
74.21 |
25.30 |
B |
solid |
2313 |
(3.8) |
(1.6) |
|
liquid |
2800 |
75 |
27 |
Ba |
solid, α |
648 |
0.14 |
0.22 |
|
solid, β |
977 |
1.83 |
1.87 |
|
liquid |
1911 |
35.665 |
18.63 |
Be |
solid |
1556 |
2.919 |
1.501 |
|
liquid |
– |
|
|
Bi |
solid |
544.2 |
2.63 |
4.83 |
|
liquid |
1900 |
41.1 |
21.6 |
C |
solid |
– |
– |
– |
Ca |
solid, α |
723 |
0.24 |
0.33 |
|
solid, β |
1123 |
2.2 |
1.96 |
|
liquid |
1755 |
38.6 |
22.0 |
|
|
|
|
|
Source: data from Weast, R. C. Ed., Handbook of Chemistry and Physics, 69th ed., CRC Press, Boca Raton, Fla., 1988, D44.
©2001 CRC Press LLC
Table 68. PHASE CHANGE THERMODYNAMIC PROPERTIES FOR
THE ELEMENTS
(SHEET 2 OF 7)
|
|
Transition |
Heat of |
Entropy of |
|
|
Transition |
||
|
|
Temperature |
Transition |
|
|
|
(kcal • g mole-1) |
||
Element |
Phase |
(K) |
(e.u.) |
|
|
|
|
|
|
|
|
|
|
|
Cd |
solid |
594.1 |
1.46 |
2.46 |
|
liquid |
1040 |
23.86 |
22.94 |
Ce |
solid |
1048 |
2.1 |
2.0 |
|
liquid |
2800 |
73 |
26 |
Cl2 |
gas |
– |
– |
– |
Co |
solid, α |
723 |
0.005 |
0.007 |
|
solid, β |
1398 |
0.095 |
0.068 |
|
solid, γ |
1766 |
3.7 |
2.1 |
|
liquid |
3370 |
93 |
28 |
Cr |
solid |
2173 |
3.5 |
1.6 |
|
liquid |
2495 |
72.97 |
29.25 |
Cs |
solid |
301.9 |
0.50 |
1.7 |
|
liquid |
963 |
16.32 |
17.0 |
Cu |
solid |
1356.2 |
3.11 |
2.29 |
|
liquid |
2868 |
72.8 |
25.4 |
F2 |
gas |
– |
– |
– |
Fe |
solid, α |
1033 |
0.410 |
0.397 |
|
solid, β |
1180 |
0.217 |
0.184 |
|
solid, γ |
1673 |
0.15 |
0.084 |
|
solid, δ |
1808 |
3.86 |
2.14 |
|
liquid |
3008 |
84.62 |
28.1 |
Ga |
solid |
302.94 |
1.335 |
4.407 |
|
liquid |
2700 |
– |
– |
|
|
|
|
|
Source: data from Weast, R. C. Ed., Handbook of Chemistry and Physics, 69th ed., CRC Press, Boca Raton, Fla., 1988, D44.
©2001 CRC Press LLC

Table 68. PHASE CHANGE THERMODYNAMIC PROPERTIES FOR
THE ELEMENTS
(SHEET 3 OF 7)
|
|
Transition |
Heat of |
Entropy of |
|
|
Transition |
||
|
|
Temperature |
Transition |
|
|
|
(kcal • g mole-1) |
||
Element |
Phase |
(K) |
(e.u.) |
|
|
|
|
|
|
|
|
|
|
|
Ge |
solid |
1232 |
8.3 |
6.7 |
|
liquid |
2980 |
68 |
23 |
H2 |
gas |
– |
– |
– |
Hf |
solid |
(2600) |
(6.0) |
(2.3) |
Hg |
liquid |
629.73 |
13.985 |
22.208 |
In |
solid |
430 |
0.775 |
1.80 |
|
liquid |
2440 |
53.8 |
22.0 |
Ir |
solid |
2727 |
6.6 |
2.4 |
K |
solid |
336.4 |
0.5575 |
1.657 |
|
liquid |
1052 |
18.88 |
17.95 |
La |
solid |
1153 |
(2.3) |
(2.0) |
|
liquid |
3000 |
80 |
27 |
Li |
solid |
459 |
0.69 |
1.5 |
|
liquid |
1640 |
32.48 |
19.81 |
Mg |
solid |
923 |
2.2 |
2.4 |
|
liquid |
1393 |
31.5 |
22.6 |
Mn |
solid, α |
1000 |
0.535 |
0.535 |
|
solid, β |
1374 |
0.545 |
0.397 |
|
solid, γ |
1410 |
0.430 |
0.305 |
|
solid, δ |
1517 |
3.5 |
2.31 |
|
liquid |
2368 |
53.7 |
22.7 |
Mo |
solid |
2883 |
(5.8) |
(2.0) |
|
|
|
|
|
Source: data from Weast, R. C. Ed., Handbook of Chemistry and Physics, 69th ed., CRC Press, Boca Raton, Fla., 1988, D44.
©2001 CRC Press LLC

Table 68. PHASE CHANGE THERMODYNAMIC PROPERTIES FOR
THE ELEMENTS
(SHEET 4 OF 7)
|
|
Transition |
Heat of |
Entropy of |
|
|
Transition |
||
|
|
Temperature |
Transition |
|
|
|
(kcal • g mole-1) |
||
Element |
Phase |
(K) |
(e.u.) |
|
|
|
|
|
|
|
|
|
|
|
N2 |
gas |
– |
– |
– |
Na |
solid |
371 |
0.63 |
1.7 |
|
liquid |
1187 |
23.4 |
20.1 |
Nb |
solid |
2760 |
(5.8) |
(2.1) |
Nd |
solid |
1297 |
(2.55) |
(197) |
|
liquid |
(2750) |
(61) |
(22) |
Ni |
solid α |
626 |
0.092 |
0.15 |
|
solid β |
1728 |
4.21 |
2.44 |
|
liquid |
3110 |
90.48 |
29.0 |
Np |
solid |
913 |
(2.3) |
(2.5) |
|
liquid |
(2525) |
(55) |
(22) |
O2 |
gas |
– |
– |
– |
Os |
solid |
2970 |
(6.4) |
(2.2) |
P4 |
solid, white |
317.4 |
0.601 |
1.89 |
|
liquid |
553 |
11.9 |
21.5 |
Pa |
solid |
(18.25) |
(4.0) |
(2.2) |
|
liquid |
(4500) |
(115) |
(26) |
Pb |
solid |
600.6 |
1.141 |
1.900 |
|
liquid |
2023 |
42.5 |
21.0 |
Pd |
solid |
1828 |
4.12 |
2.25 |
|
liquid |
3440 |
89 |
26 |
|
|
|
|
|
Source: data from Weast, R. C. Ed., Handbook of Chemistry and Physics, 69th ed., CRC Press, Boca Raton, Fla., 1988, D44.
©2001 CRC Press LLC

Table 68. PHASE CHANGE THERMODYNAMIC PROPERTIES FOR
THE ELEMENTS
(SHEET 5 OF 7)
|
|
Transition |
Heat of |
Entropy of |
|
|
Transition |
||
|
|
Temperature |
Transition |
|
|
|
(kcal • g mole-1) |
||
Element |
Phase |
(K) |
(e.u.) |
|
|
|
|
|
|
|
|
|
|
|
Po |
solid |
525 |
(2.4) |
(4.6) |
|
liquid |
(1235) |
(24.6) |
(19.9) |
Pr |
solid |
1205 |
(25) |
(2.1) |
|
liquid |
3563 |
– |
– |
Pt |
solid |
2042.5 |
5.2 |
25 |
|
liquid |
4100 |
122 |
29.8 |
Pu |
solid |
913 |
(2.26) |
(2.48) |
|
liquid |
– |
|
|
Ra |
solid |
1233 |
(2.3) |
(1.9) |
|
liquid |
(1700) |
(35) |
(21) |
Rb |
solid |
312.0 |
0.525 |
1.68 |
|
liquid |
952 |
18.11 |
19.0 |
Re |
solid |
3440 |
(7.9) |
(2.3) |
Rh |
solid |
2240 |
(5.2) |
(2.3) |
|
liquid |
4150 |
127 |
30.7 |
Ru |
solid, α |
1308 |
0.034 |
0.026 |
|
solid, β |
1473 |
0 |
– |
|
solid, γ |
1773 |
0.23 |
0.13 |
|
solid, δ |
2700 |
(6.1) |
(2.3) |
S |
solid, α |
368.6 |
0.088 |
0.24 |
|
solid, β |
392 |
0.293 |
0.747 |
|
liquid |
717.76 |
2.5 |
3.5 |
Sb |
solid (α, β, γ) |
903.7 |
4.8 |
5.3 |
|
liquid |
1713 |
46.665 |
27.3 |
|
|
|
|
|
Source: data from Weast, R. C. Ed., Handbook of Chemistry and Physics, 69th ed., CRC Press, Boca Raton, Fla., 1988, D44.
©2001 CRC Press LLC

Table 68. PHASE CHANGE THERMODYNAMIC PROPERTIES FOR
THE ELEMENTS
(SHEET 6 OF 7)
|
|
Transition |
Heat of |
Entropy of |
|
|
Transition |
||
|
|
Temperature |
Transition |
|
|
|
(kcal • g mole-1) |
||
Element |
Phase |
(K) |
(e.u.) |
|
|
|
|
|
|
|
|
|
|
|
Sc |
solid |
1670 |
(4.0) |
(2.4) |
|
liquid |
3000 |
80 |
27 |
Se |
solid |
490.6 |
1.25 |
2.55 |
|
liquid |
1000 |
14.27 |
14.27 |
Si |
solid |
1683 |
11.1 |
6.60 |
|
liquid |
2750 |
71 |
26 |
Sm |
solid |
1623 |
3.7 |
2.3 |
|
liquid |
(2800) |
(70) |
(25) |
Sn |
solid, α, β |
505.1 |
1.69 |
335 |
|
liquid |
2473 |
(55) |
(22) |
Sr |
solid |
1043 |
2.2 |
2.1 |
|
liquid |
1657 |
33.61 |
20.28 |
Ta |
solid |
3250 |
7.5 |
2.3 |
Tc |
solid |
(2400) |
(5.5) |
(2.3) |
|
liquid |
(3800) |
(120) |
(32) |
Te |
solid, α |
621 |
0.13 |
0.21 |
|
solid, β |
723 |
4.28 |
5.92 |
|
liquid |
1360 |
11.9 |
8.75 |
Th |
solid |
2173 |
(4.6) |
(2.1) |
|
liquid |
4500 |
(130) |
(29) |
Ti |
solid, α |
1155 |
0.950 |
0.822 |
|
solid, β |
2000 |
(4.6) |
(23) |
|
liquid |
3550 |
(101) |
(28) |
|
|
|
|
|
Source: data from Weast, R. C. Ed., Handbook of Chemistry and Physics, 69th ed., CRC Press, Boca Raton, Fla., 1988, D44.
©2001 CRC Press LLC

Table 68. PHASE CHANGE THERMODYNAMIC PROPERTIES FOR
THE ELEMENTS
(SHEET 7 OF 7)
|
|
Transition |
Heat of |
Entropy of |
|
|
Transition |
||
|
|
Temperature |
Transition |
|
|
|
(kcal • g mole-1) |
||
Element |
Phase |
(K) |
(e.u.) |
|
|
|
|
|
|
|
|
|
|
|
Tl |
solid, α |
508.3 |
0.082 |
0.16 |
|
solid, β |
576.8 |
1.03 |
1.79 |
|
liquid |
1730 |
38.81 |
22.4 |
U |
solid, α |
938 |
0.665 |
0.709 |
|
solid, β |
1049 |
1.165 |
1.111 |
|
solid, γ |
1405 |
(3.0) |
(2.1) |
|
liquid |
3800 |
– |
– |
V |
solid |
2003 |
(4.0) |
(2.0) |
|
liquid |
3800 |
– |
– |
W |
solid |
3650 |
8.42 |
2.3 |
Y |
solid |
1750 |
(4.0) |
(2.3) |
|
liquid |
3500 |
(90) |
(26) |
Zn |
solid |
692.7 |
1.595 |
2.303 |
|
liquid |
1180 |
27.43 |
23.24 |
Zr |
solid, α |
1135 |
0.920 |
0.811 |
|
solid, β |
2125 |
(4.9) |
(2.3) |
|
liquid |
(3900) |
(100) |
(26) |
|
|
|
|
|
Source: data from Weast, R. C. Ed., Handbook of Chemistry and Physics, 69th ed., CRC Press, Boca Raton, Fla., 1988, D44.
©2001 CRC Press LLC

Table 69. PHASE CHANGE THERMODYNAMIC PROPERTIES
OF OXIDES (SHEET 1 OF 10)
|
|
Transition |
Heat of |
Entropy of |
|
|
Transition |
||
|
|
Temperature |
Transition |
|
|
|
(kcal • g mole-1) |
||
Oxide |
Phase |
(K) |
(e.u.) |
|
|
|
|
|
|
|
|
|
|
|
Ac2O3 |
Solid |
(2250) |
(20) |
(8.9) |
|
Liquid |
– |
– |
– |
Ag2O |
Solid |
dec. 460 |
– |
– |
Ag2O2 |
Solid |
dec. |
– |
– |
Al2O3 |
Solid |
2300 |
26 |
11 |
|
Liquid |
dec. |
– |
– |
Am2O3 |
Solid |
(2225) |
(17) |
(7.6) |
|
Liquid |
(3400) |
(85) |
(25) |
AmO2 |
Solid |
dec. |
– |
– |
As2O3 |
Solid, α |
503 |
4.1 |
8.2 |
|
Solid, β |
586 |
4.4 |
7.5 |
|
Liquid |
730 |
7.15 |
9.79 |
AsO2 |
Solid |
(1200) |
(9.0) |
(7.5) |
|
Liquid |
(dec.) |
– |
– |
As2O5 |
Solid |
dec. >1100 |
– |
– |
Au2O3 |
Solid |
dec. |
– |
– |
B2O3 |
Solid |
723 |
5.27 |
7.29 |
|
Liquid |
2520 |
(55) |
(22) |
Ba2O |
Solid |
(880) |
(5.2) |
(5.9) |
|
Liquid |
(1040) |
(20) |
(19) |
BaO |
Solid |
2196 |
13.8 |
6.28 |
|
Liquid |
3000 |
(62) |
(21) |
BaO2 |
Solid |
723 |
(5.7) |
(7.9) |
|
Liquid |
dec. 1110 |
– |
– |
|
|
|
|
|
Source: data from Weast, R. C., Ed., Handbook of Chemistry and Physics, 55th ed., CRC Press, Cleveland, 1974, D-58.
©2001 CRC Press LLC

Table 69. PHASE CHANGE THERMODYNAMIC PROPERTIES
OF OXIDES (SHEET 2 OF 10)
|
|
Transition |
Heat of |
Entropy of |
|
|
Transition |
||
|
|
Temperature |
Transition |
|
|
|
(kcal • g mole-1) |
||
Oxide |
Phase |
(K) |
(e.u.) |
|
|
|
|
|
|
|
|
|
|
|
BeO |
Solid |
dec. |
– |
– |
BiO |
Solid |
(1175) |
(3.7) |
(3.1) |
|
Liquid |
(1920) |
(54) |
(28) |
Bi2O3 |
Solid |
1090 |
6.8 |
6.2 |
|
Liquid |
(dec.) |
– |
– |
CO |
Gas |
– |
– |
– |
CO2 |
Gas |
– |
– |
– |
CaO |
Solid |
2860 |
(18) |
(6.3) |
CdO |
Solid |
dec. |
– |
– |
Ce2O3 |
Solid |
1960 |
(20) |
(10) |
|
Liquid |
(3500) |
(80) |
(23) |
CeO2 |
Solid |
3000 |
(19) |
(6.3) |
CoO |
Solid |
2078 |
(12) |
(5.8) |
|
Liquid |
(2900) |
(61) |
(21) |
Co3O4 |
Solid |
dec. 1240 |
– |
– |
Cr2O3 |
Solid |
2538 |
(25) |
(10) |
CrO2 |
Solid |
dec. 700 |
– |
– |
CrO3 |
Solid |
460 |
(6.1) |
(13) |
|
Liquid |
(1000) |
(25) |
(25) |
Cs2O |
Solid |
763 |
(4.58) |
(6.0) |
|
Liquid |
dec. |
– |
– |
Cs2O2 |
Solid |
867 |
(5.5) |
(6.3) |
|
Liquid |
dec. |
– |
– |
Cs2O3 |
Solid |
775 |
(7.75) |
(10) |
|
Liquid |
dec. |
– |
– |
|
|
|
|
|
Source: data from Weast, R. C., Ed., Handbook of Chemistry and Physics, 55th ed., CRC Press, Cleveland, 1974, D-58.
©2001 CRC Press LLC

Table 69. PHASE CHANGE THERMODYNAMIC PROPERTIES
OF OXIDES (SHEET 3 OF 10)
|
|
Transition |
Heat of |
Entropy of |
|
|
Transition |
||
|
|
Temperature |
Transition |
|
|
|
(kcal • g mole-1) |
||
Oxide |
Phase |
(K) |
(e.u.) |
|
|
|
|
|
|
|
|
|
|
|
Cu2O |
Solid |
1503 |
13.4 |
8.92 |
|
Liquid |
dec. |
– |
– |
CuO |
Solid |
1609 |
(8.9) |
(5.5) |
|
Liquid |
dec. |
– |
– |
FeO |
Solid |
1641 |
7.5 |
4.6 |
|
Liquid |
(2700) |
(55) |
(20) |
Fe3O4 |
Solid, α |
900 |
(0) |
(0) |
|
Solid, β |
dec. |
– |
– |
Fe2O3 |
Solid, α |
950 |
0.16 |
0.17 |
|
Solid, β |
1050 |
0 |
0 |
|
Solid, γ |
dec. |
– |
– |
Ga2O |
Solid |
(925) |
(8.5) |
(9.2) |
|
Liquid |
(1000) |
(20) |
(20) |
Ga2O3 |
Solid |
2013 |
(22) |
(11) |
|
Liquid |
(2900) |
(75) |
(26) |
GeO |
Solid |
983 |
(50) |
(51) |
GeO2 |
Solid (α,β) |
1389 |
10.5 |
7.56 |
|
Liquid |
(2625) |
(61) |
(23) |
In2O |
Solid |
(600) |
(4.5) |
(7.5) |
|
Liquid |
(800) |
(16) |
(20) |
InO |
Solid |
(1325) |
(4.0) |
(3.0) |
|
Liquid |
(2000) |
(60) |
(30) |
In2O3 |
Solid |
(2000) |
(20) |
(10) |
|
Liquid |
(3600) |
(85) |
(24) |
Ir2O3 |
Solid |
(1450) |
(10) |
(6.8) |
|
Liquid |
(2250) |
(50) |
(22) |
IrO2 |
Solid |
dec. 1373 |
– |
– |
|
|
|
|
|
Source: data from Weast, R. C., Ed., Handbook of Chemistry and Physics, 55th ed., CRC Press, Cleveland, 1974, D-58.
©2001 CRC Press LLC

Table 69. PHASE CHANGE THERMODYNAMIC PROPERTIES
OF OXIDES (SHEET 4 OF 10)
|
|
Transition |
Heat of |
Entropy of |
|
|
Transition |
||
|
|
Temperature |
Transition |
|
|
|
(kcal • g mole-1) |
||
Oxide |
Phase |
(K) |
(e.u.) |
|
|
|
|
|
|
|
|
|
|
|
K2O |
Solid |
(980) |
(6.8) |
(6.9) |
|
Liquid |
dec. |
– |
– |
K2O2 |
Solid |
763 |
(7.0) |
(9.2) |
|
Liquid |
(1800) |
(45) |
(25) |
K2O3 |
Solid |
703 |
(6.1) |
(8.7) |
|
Liquid |
(975) |
(25) |
(26) |
KO2 |
Solid |
653 |
(4.9) |
(7.5) |
|
Liquid |
dec. |
– |
– |
La2O3 |
Solid |
2590 |
(18) |
(7) |
Li2O |
Solid |
2000 |
(14) |
(7) |
|
Liquid |
2600 |
(56) |
(22) |
Li2O2 |
Solid |
dec.470 |
– |
– |
MgO |
Solid |
3075 |
18.5 |
5.8 |
MgO2 |
Solid |
dec. 361 |
– |
– |
MnO |
Solid |
2058 |
13.0 |
6.32 |
|
Liquid |
dec. |
– |
– |
Mn3O4 |
Solid, α |
1445 |
4.97 |
3.44 |
|
Solid, β |
1863 |
(33) |
(18) |
|
Liquid |
(2900) |
(75) |
(26) |
Mn2O3 |
Solid |
dec. 1620 |
– |
– |
MnO2 |
Solid |
dec. 1120 |
– |
– |
MoO2 |
Solid |
(2200) |
(16) |
(7.3) |
|
Liquid |
dec. 2250 |
– |
– |
MoO3 |
Solid |
1068 |
12.54 |
11.74 |
|
Liquid |
1530 |
33 |
22 |
N2O |
Gas |
– |
– |
– |
|
|
|
|
|
Source: data from Weast, R. C., Ed., Handbook of Chemistry and Physics, 55th ed., CRC Press, Cleveland, 1974, D-58.
©2001 CRC Press LLC
Table 69. PHASE CHANGE THERMODYNAMIC PROPERTIES
OF OXIDES (SHEET 5 OF 10)
|
|
Transition |
Heat of |
Entropy of |
|
|
Transition |
||
|
|
Temperature |
Transition |
|
|
|
(kcal • g mole-1) |
||
Oxide |
Phase |
(K) |
(e.u.) |
|
|
|
|
|
|
|
|
|
|
|
Na2O |
Solid |
1193 |
(7.1) |
(6.0) |
|
Liquid |
dec. |
– |
– |
Na2O2 |
Solid |
dec. 919 |
– |
– |
NaO2 |
Solid |
(825) |
(6.2) |
(7.5) |
|
Liquid |
(1300) |
(28) |
(22) |
NbO |
Solid |
(2650) |
(16) |
(6.0) |
NbO2 |
Solid |
(2275) |
(16) |
(7.0) |
|
Liquid |
(3800) |
(85) |
(22) |
Nb2O5 |
Solid |
1733 |
(28) |
(16) |
|
Liquid |
(3200) |
(80) |
(25) |
Nd2O3 |
Solid |
2545 |
(22) |
(8.8) |
NiO |
Solid |
2230 |
(12.1) |
(5.43) |
|
Liquid |
dec. |
– |
– |
NpO2 |
Solid |
(2600) |
(15) |
(5.7) |
Np2O5 |
Solid |
dec. |
– |
– |
|
|
800–900 K |
|
|
OsO2 |
Solid |
dec. 923 |
– |
– |
OsO4 |
Solid |
313.3 |
3.41 |
10.9 |
|
Liquid |
403 |
9.45 |
23.4 |
P2O3 |
Liquid |
448.5 |
4.5 |
10 |
PO2 |
Solid |
(350) |
(2.7) |
(7.7) |
|
Liquid |
(dec.) |
– |
– |
P2O5 |
Solid |
631 |
8.8 |
13.9 |
PaO2 |
Solid |
(2560) |
(20) |
(7.8) |
Pa2O5 |
Solid |
(2050) |
(26) |
(13) |
|
Liquid |
(3350) |
(95) |
(28) |
|
|
|
|
|
Source: data from Weast, R. C., Ed., Handbook of Chemistry and Physics, 55th ed., CRC Press, Cleveland, 1974, D-58.
©2001 CRC Press LLC

Table 69. PHASE CHANGE THERMODYNAMIC PROPERTIES
OF OXIDES (SHEET 6 OF 10)
|
|
Transition |
Heat of |
Entropy of |
|
|
Transition |
||
|
|
Temperature |
Transition |
|
|
|
(kcal • g mole-1) |
||
Oxide |
Phase |
(K) |
(e.u.) |
|
|
|
|
|
|
|
|
|
|
|
PbO |
Solid, red |
762 |
(0.4) |
(0.5) |
|
Solid, yellow |
1159 |
2.8 |
2.4 |
|
Liquid |
1745 |
51 |
29 |
Pb2O4 |
Solid |
dec. |
– |
– |
PbO2 |
Solid |
dec. |
– |
– |
PdO |
Solid |
dec. 1150 |
– |
– |
PoO2 |
Solid |
(825) |
(5.5) |
(6.7) |
|
Liquid |
(dec.) |
– |
– |
Pr2O3 |
Solid |
(2200) |
(22) |
(10) |
|
Liquid |
(4000 |
(90) |
(23) |
PrO2 |
Solid |
dec. 700 |
– |
– |
PtO |
Solid |
dec. 780 |
– |
– |
Pt3O4 |
Solid |
(dec.) |
– |
– |
PtO2 |
Solid |
723 |
(4.6) |
(6.4) |
|
Liquid |
dec. 750 |
– |
– |
PuO |
Solid |
(1290) |
(7.2) |
(5.6) |
|
Liquid |
(2325) |
(47) |
(20) |
Pu2O3 |
Solid |
(1880) |
(16) |
(8.5) |
|
Liquid |
(3250) |
(75) |
(23) |
PuO2 |
Solid |
(2400) |
(15) |
(6.2) |
|
Liquid |
(3500) |
(90) |
(26) |
RaO |
Solid |
(>2500) |
– |
– |
|
|
|
|
|
Source: data from Weast, R. C., Ed., Handbook of Chemistry and Physics, 55th ed., CRC Press, Cleveland, 1974, D-58.
©2001 CRC Press LLC

Table 69. PHASE CHANGE THERMODYNAMIC PROPERTIES
OF OXIDES (SHEET 7 OF 10)
|
|
Transition |
Heat of |
Entropy of |
|
|
Transition |
||
|
|
Temperature |
Transition |
|
|
|
(kcal • g mole-1) |
||
Oxide |
Phase |
(K) |
(e.u.) |
|
|
|
|
|
|
|
|
|
|
|
Rb2O |
Solid |
(910) |
(5.7) |
(6.3) |
|
Liquid |
dec. |
– |
– |
Rb2O2 |
Solid |
843 |
(7.3) |
(8.7) |
|
Liquid |
(dec.) |
– |
– |
Rb2O3 |
Solid |
762 |
(7.6) |
(10) |
|
Liquid |
dec. |
– |
– |
RbO2 |
Solid |
685 |
(4.1) |
(6.0) |
|
Liquid |
dec. |
– |
– |
ReO2 |
Solid |
(1475) |
(12) |
(8.1) |
|
Liquid |
(3250) |
(80) |
(25) |
ReO3 |
Solid |
433 |
5.2 |
12 |
|
Liquid |
dec. |
– |
– |
Re2O7 |
Solid |
569 |
15.8 |
27.8 |
|
Liquid |
635.5 |
17.7 |
27.9 |
ReO4 |
Solid |
420 |
(4.2) |
(10) |
|
Liquid |
(460) |
(9.3) |
(20) |
Rh2O |
Solid |
dec. 1400 |
– |
– |
RhO |
Solid |
dec. 1394 |
– |
– |
Rh2O3 |
Solid |
dec. 1388 |
– |
– |
RuO2 |
Solid |
dec. 1400 |
– |
– |
RuO4 |
Solid |
300 |
(3.2) |
(11) |
|
Liquid |
dec. |
– |
– |
SO2 |
Gas |
– |
– |
– |
Sb2O3 |
Solid |
928 |
14.74 |
15.88 |
|
Liquid |
1698 |
8.92 |
5.25 |
|
|
|
|
|
Source: data from Weast, R. C., Ed., Handbook of Chemistry and Physics, 55th ed., CRC Press, Cleveland, 1974, D-58.
©2001 CRC Press LLC

Table 69. PHASE CHANGE THERMODYNAMIC PROPERTIES
OF OXIDES (SHEET 8 OF 10)
|
|
Transition |
Heat of |
Entropy of |
|
|
Transition |
||
|
|
Temperature |
Transition |
|
|
|
(kcal • g mole-1) |
||
Oxide |
Phase |
(K) |
(e.u.) |
|
|
|
|
|
|
|
|
|
|
|
SbO2 |
Solid |
dec. |
– |
– |
Sb2O5 |
Solid |
dec. |
– |
– |
Sc2O3 |
Solid |
(2500) |
(23) |
(9.3) |
SeO |
Solid |
(1375) |
(7.6) |
(5.5) |
|
Liquid |
(2075) |
(45) |
(22) |
SeO2 |
Solid |
603 |
(24.5) |
(40.6) |
SiO |
Solid |
(2550) |
(12) |
(4.7) |
SiO2 |
Solid, β |
856 |
0.15 |
0.18 |
|
Solid, α |
1883 |
2.04 |
1.08 |
|
Liquid |
dec. 2250 |
– |
– |
Sm2O3 |
Solid |
(2150) |
(20) |
(9.3) |
|
Liquid |
(3800) |
(80) |
(21) |
SnO |
Solid |
(1315) |
(6.4) |
(4.9) |
|
Liquid |
(1800) |
(60) |
(33) |
SnO2 |
Solid |
1898 |
(11.39) |
(5.95) |
|
Liquid |
(3200) |
(75) |
(23) |
SrO |
Solid |
2703 |
16.7 |
6.2 |
SrO2 |
Solid |
dec.488 |
– |
– |
Ta2O5 |
Solid |
2150 |
(16) |
(7.4) |
|
Liquid |
– |
– |
– |
TcO2 |
Solid |
(2400) |
(18) |
(7.5) |
|
Liquid |
(4000) |
(105) |
(26) |
TcO3 |
Solid |
(dec. <1200) |
– |
– |
Tc2O7 |
Solid |
392.7 |
(11) |
(28) |
|
Liquid |
583.8 |
(14) |
(24) |
|
|
|
|
|
Source: data from Weast, R. C., Ed., Handbook of Chemistry and Physics, 55th ed., CRC Press, Cleveland, 1974, D-58.
©2001 CRC Press LLC

Table 69. PHASE CHANGE THERMODYNAMIC PROPERTIES
OF OXIDES (SHEET 9 OF 10)
|
|
Transition |
Heat of |
Entropy of |
|
|
Transition |
||
|
|
Temperature |
Transition |
|
|
|
(kcal • g mole-1) |
||
Oxide |
Phase |
(K) |
(e.u.) |
|
|
|
|
|
|
|
|
|
|
|
TeO |
Solid |
(1020) |
(7.1) |
(7.0) |
|
Liquid |
(1775) |
(50) |
(28) |
TeO3 |
Solid |
1006 |
3.2 |
3.2 |
|
Liquid |
dec. |
– |
– |
TeO2 |
Solid |
(2150) |
(13) |
(6.0) |
|
Liquid |
(3250) |
(65) |
(20) |
ThO2 |
Solid |
3225 |
(18) |
(5.6) |
TiO |
Solid, α |
1264 |
0.82 |
0.65 |
|
Solid, β |
dec. 2010 |
– |
– |
Ti2O3 |
Solid, α |
473 |
0.215 |
0.455 |
|
Solid, β |
2400 |
(24) |
(10) |
|
Liquid |
3300 |
|
|
Ti3O5 |
Solid, α |
450 |
2.24 |
4.98 |
|
Solid, β |
(2450) |
(50) |
(20) |
|
Liquid |
(3600) |
(85) |
(24) |
TiO2 |
Solid |
2128 |
(16) |
(7.5) |
|
Liquid |
dec. 3200 |
|
|
Ti2O |
Solid |
573 |
(5.0) |
(8.7) |
|
Liquid |
773 |
(17) |
(22) |
Tl2O3 |
Solid |
990 |
(12.4) |
(13) |
|
Liquid |
(dec.) |
– |
– |
UO |
Solid |
(2750) |
(14) |
(5.1) |
UO2 |
Solid |
3000 |
– |
– |
U3O8 |
Solid |
dec. |
– |
– |
UO3 |
Solid |
dec. 925 |
– |
– |
|
|
|
|
|
Source: data from Weast, R. C., Ed., Handbook of Chemistry and Physics, 55th ed., CRC Press, Cleveland, 1974, D-58.
©2001 CRC Press LLC

Table 69. PHASE CHANGE THERMODYNAMIC PROPERTIES
OF OXIDES (SHEET 10 OF 10)
|
|
Transition |
Heat of |
Entropy of |
|
|
Transition |
||
|
|
Temperature |
Transition |
|
|
|
(kcal • g mole-1) |
||
Oxide |
Phase |
(K) |
(e.u.) |
|
|
|
|
|
|
|
|
|
|
|
VO |
Solid |
(2350) |
(15) |
(6.4) |
|
Liquid |
(3400) |
(70) |
(21) |
V2O3 |
Solid |
2240 |
(24) |
(11) |
|
Liquid |
dec. 3300 |
– |
– |
V3O4 |
Solid |
(2100) |
(42) |
(20) |
|
Liquid |
(dec.) |
– |
– |
VO2 |
Solid, α |
345 |
1.02 |
2.96 |
|
Solid, β |
1818 |
13.60 |
7.48 |
|
Liquid |
dec. 3300 |
– |
– |
V2O5 |
Solid |
943 |
15.56 |
16.50 |
|
Liquid |
(2325) |
(63) |
(27) |
WO2 |
Solid |
(1543) |
(11.5) |
(7.45) |
|
Liquid |
dec. 2125 |
– |
– |
WO3 |
Solid |
1743 |
(17) |
(9.8) |
|
Liquid |
(2100) |
(43) |
(20) |
Y2O3 |
Solid |
(2500) |
(25) |
(10) |
ZnO |
Solid |
dec. |
– |
– |
ZrO2 |
Solid, α |
1478 |
1.420 |
0.961 |
|
Solid, β |
2950 |
20.8 |
7.0 |
|
|
|
|
|
Source: data from Weast, R. C., Ed., Handbook of Chemistry and Physics, 55th ed., CRC Press, Cleveland, 1974, D-58.
©2001 CRC Press LLC

Table 70. MELTING POINTS OF THE ELEMENTS
(SHEET 1 OF 4)
|
|
|
Melting |
At. |
|
|
Point |
No. |
Element |
Symbol |
(˚C) |
|
|
|
|
|
|
|
|
1 |
Hydrogen |
H |
-259.14 |
2 |
Helium |
He |
-272.2 |
3 |
Lithium |
Li |
180.54 |
4 |
Beryllium |
Be |
1278 |
5 |
Boron |
B |
2300 |
6 |
Carbon |
C |
~3550 |
7 |
Nitrogen |
N |
-209.86 |
8 |
Oxygen |
O |
-218.4 |
9 |
Fluorine |
F |
-219.62 |
10 |
Neon |
N |
-248.67 |
11 |
Sodium |
Na |
97.81 |
12 |
Magnesium |
Mg |
648.8 |
13 |
Aluminum |
Al |
660.37 |
14 |
Silicon |
Si |
1410 |
15 |
Phosphorus |
P |
44.1 |
|
(White) |
|
|
16 |
Sulfur |
S |
112.8 |
17 |
Chlorine |
Cl |
-100.98 |
18 |
Argon |
Ar |
-189.2 |
19 |
Potassium |
K |
63.65 |
20 |
Calcium |
Ca |
839 |
21 |
Scandium |
Sc |
1539 |
22 |
Titanium |
Ti |
1660 |
23 |
Vanadium |
V |
1890 |
24 |
Chromium |
Cr |
1857 |
25 |
Manganese |
Mn |
1244 |
26 |
Iron |
Fe |
1535 |
27 |
Cobalt |
Co |
1495 |
|
|
|
|
Source: data from James F. Shackelford, Introduction to Materials Science for Engineers, Second Edition, Macmillan Publishing Company, New York, pp.686-688, (1988).
©2001 CRC Press LLC

Table 70. MELTING POINTS OF THE ELEMENTS
(SHEET 2 OF 4)
|
|
|
Melting |
At. |
|
|
Point |
No. |
Element |
Symbol |
(˚C) |
|
|
|
|
|
|
|
|
28 |
Nickel |
Ni |
1453 |
29 |
Copper |
Cu |
1083.4 |
30 |
Zinc |
Zn |
419.58 |
31 |
Gallium |
Ga |
29.78 |
32 |
Germanium |
Ge |
937.4 |
33 |
Arsenic |
As |
817 |
34 |
Selenium |
Se |
217 |
35 |
Bromine |
Br |
-7.2 |
36 |
Krypton |
Kr |
-156.6 |
37 |
Rubidium |
Rb |
38.89 |
38 |
Strontium |
Sr |
769 |
39 |
Yttrium |
Y |
1523 |
40 |
Zirconium |
Zr |
1852 |
41 |
Niobium |
Nb |
2408 |
42 |
Molybdenum |
Mo |
2617 |
43 |
Technetium |
Tc |
2172 |
44 |
Ruthenium |
Ru |
2310 |
45 |
Rhodium |
Rh |
1966 |
46 |
Palladium |
Pd |
1552 |
47 |
Silver |
Ag |
961.93 |
48 |
Cadmium |
Cd |
320.9 |
49 |
Indium |
In |
156.61 |
50 |
Tin |
Sn |
231.9681 |
51 |
Antimony |
Sb |
630.74 |
52 |
Tellurium |
Te |
449.5 |
53 |
Iodine |
I |
113.5 |
54 |
Xenon |
Xe |
-111.9 |
55 |
Cesium (-10˚) |
Ce |
28.4 |
|
|
|
|
Source: data from James F. Shackelford, Introduction to Materials Science for Engineers, Second Edition, Macmillan Publishing Company, New York, pp.686-688, (1988).
©2001 CRC Press LLC

Table 70. MELTING POINTS OF THE ELEMENTS
(SHEET 3 OF 4)
|
|
|
Melting |
At. |
|
|
Point |
No. |
Element |
Symbol |
(˚C) |
|
|
|
|
|
|
|
|
56 |
Barium |
Ba |
7.25 |
57 |
Lantium |
La |
920 |
58 |
Cerium |
Ce |
798 |
59 |
Praseodymium |
Pr |
931 |
60 |
Neodymium |
Nd |
1010 |
61 |
Promethium |
Pm |
~1080 |
62 |
Samarium |
Sm |
1072 |
63 |
Europium |
Eu |
822 |
64 |
Gadolinium |
Gd |
1311 |
65 |
Terbium |
Tb |
1360 |
66 |
Dysprosium |
Dy |
1409 |
67 |
Holmium |
Ho |
1470 |
68 |
Erbium |
Er |
1522 |
69 |
Thulium |
Tm |
1545 |
70 |
Ytterbium |
Yb |
824 |
71 |
Lutetium |
Lu |
1659 |
72 |
Hafnium |
Hf |
2227 |
73 |
Tantalum |
Ta |
2996 |
74 |
Tungsten |
W |
3410 |
75 |
Rhenium |
Re |
3180 |
76 |
Osmium |
Os |
3045 |
77 |
Iridium |
Ir |
2410 |
78 |
Platinum |
Pt |
1772 |
79 |
Gold |
Au |
1064.43 |
80 |
Mercury |
Hg |
-38.87 |
81 |
Thallium |
Tl |
303.5 |
82 |
Lead |
Pb |
327.502 |
83 |
Bismuth |
Bi |
271.3 |
|
|
|
|
Source: data from James F. Shackelford, Introduction to Materials Science for Engineers, Second Edition, Macmillan Publishing Company, New York, pp.686-688, (1988).
©2001 CRC Press LLC

Table 70. MELTING POINTS OF THE ELEMENTS
(SHEET 4 OF 4)
|
|
|
Melting |
At. |
|
|
Point |
No. |
Element |
Symbol |
(˚C) |
|
|
|
|
|
|
|
|
84 |
Polonium |
Po |
254 |
85 |
Asatine |
At |
302 |
86 |
Radon |
Rn |
-71 |
87 |
Francium |
Fr |
~27 |
88 |
Radium |
Ra |
700 |
89 |
Actinium |
Ac |
1050 |
90 |
Thorium |
Th |
1750 |
91 |
Protoactinium |
Pa |
<1600 |
92 |
Uranium |
U |
1132 |
93 |
Neptunium |
Np |
640 |
94 |
Plutonium |
Pu |
641 |
95 |
Americium |
Am |
994 |
96 |
Curium |
Cm |
1340 |
|
|
|
|
Source: data from James F. Shackelford, Introduction to Materials Science for Engineers, Second Edition, Macmillan Publishing Company, New York, pp.686-688, (1988).
©2001 CRC Press LLC
Table 71. MELTING POINTS OF ELEMENTS AND
INORGANIC COMPOUNDS (SHEET 1 OF 13)
|
|
Melting Point |
Compound |
Formula |
˚C |
|
|
|
|
|
|
Actinium227 |
Ac |
1050±50 |
Aluminum |
Al |
658.5 |
Aluminum bromide |
Al2Br6 |
87.4 |
Aluminum chloride |
Al2Cl6 |
192.4 |
Aluminum iodide |
Al2I6 |
190.9 |
Aluminum oxide |
Al2O3 |
2045.0 |
Antimony |
Sb |
630 |
Antimony pentachloride |
SbCl5 |
4.0 |
Antimony tribromide |
SbBr3 |
96.8 |
Antimony trichloride |
SbCl3 |
73.3 |
Antimony trioxide |
Sb4O6 |
655.0 |
Antimony trisulfide |
Sb4S6 |
546.0 |
Argon |
Ar |
190.2 |
Arsenic |
As |
816.8 |
Arsenic pentafluoride |
AsF5 |
80.8 |
Arsenic tribromide |
AsBr3 |
30.0 |
Arsenic trichloride |
AsCl3 |
–16.0 |
Arsenic trifluoride |
AsF3 |
–6.0 |
Arsenic trioxide |
As4O6 |
312.8 |
Barium |
Ba |
725 |
Barium bromide |
BaBr2 |
846.8 |
Barium chloride |
BaCl2 |
959.8 |
Barium fluoride |
BaF2 |
1286.8 |
Barium iodide |
BaI2 |
710.8 |
|
|
|
Source: data from: Weast, R C., Ed., Handbook of Chemistry and Physics, 55th ed., CRC Press, Cleveland, (1974); and Bolz, R. E. and Tuve, G. L., Eds., Handbook of Tables for Applied Engineering Science, 2nd ed., CRC Press, Cleveland, (1973), p.479 .
©2001 CRC Press LLC

Table 71. MELTING POINTS OF ELEMENTS AND
INORGANIC COMPOUNDS (SHEET 2 OF 13)
|
|
Melting Point |
Compound |
Formula |
˚C |
|
|
|
|
|
|
Barium nitrate |
Ba(NO3)2 |
594.8 |
Barium oxide |
BaO |
1922.8 |
Barium phosphate |
Ba3(PO4)2 |
1727 |
Barium sulfate |
BaSO4 |
1350 |
Beryllium |
Be |
1278 |
Beryllium bromide |
BeBr2 |
487.8 |
Beryllium chloride |
BeCl2 |
404.8 |
Beryllium oxide |
BeO |
2550.0 |
Bismuth |
Bi |
271 |
Bismuth trichloride |
BiCl3 |
223.8 |
Bismuth trifluoride |
BiF3 |
726.0 |
Bismuth trioxide |
Bi2O3 |
815.8 |
Boron |
B |
2300 |
Boron tribromide |
BBr3 |
–48.8 |
Boron trichloride |
BCl3 |
–107.8 |
Boron trifluoride |
BF3 |
–128.0 |
Boron trioxide |
B2O3 |
448.8 |
Bromine |
Br2 |
–7.2 |
Bromine pentafluoride |
BrF5 |
–61.4 |
Cadmium |
Cd |
320.8 |
Cadmium bromide |
CdBr2 |
567.8 |
Cadmium chloride |
CdCl2 |
567.8 |
Cadmium fluoride |
CdF2 |
1110 |
Cadmium iodide |
CdI2 |
386.8 |
|
|
|
Source: data from: Weast, R C., Ed., Handbook of Chemistry and Physics, 55th ed., CRC Press, Cleveland, (1974); and Bolz, R. E. and Tuve, G. L., Eds., Handbook of Tables for Applied Engineering Science, 2nd ed., CRC Press, Cleveland, (1973), p.479 .
©2001 CRC Press LLC

Table 71. MELTING POINTS OF ELEMENTS AND
INORGANIC COMPOUNDS (SHEET 3 OF 13)
|
|
Melting Point |
Compound |
Formula |
˚C |
|
|
|
|
|
|
Cadmium sulfate |
CdSO4 |
1000 |
Calcium |
Ca |
851 |
Calcium bromide |
CaBr2 |
729.8 |
Calcium carbonate |
CaCO3 |
1282 |
Calcium chloride |
CaCl2 |
782 |
Calcium fluoride |
CaF2 |
1382 |
Calcium metasilicate |
CaSiO3 |
1512 |
Calcium nitrate |
Ca(NO3)2 |
560.8 |
Calcium oxide |
CaO |
2707 |
Calcium sulfate |
CaSO4 |
1297 |
Carbon dioxide |
CO2 |
–57.6 |
Carbon monoxide |
CO |
–205 |
Cyanogen |
C2N2 |
–27.2 |
Cyanogen chloride |
CNCl |
–5.2 |
Cerium |
Ce |
775 |
Cesium |
Cs |
28.3 |
Cesium chloride |
CsCl |
38.5 |
Cesium nitrate |
CsNO3 |
406.8 |
Chlorine |
Cl2 |
–103±5 |
Chromium |
Cr |
1890 |
Chromium (II) chloride |
CrCl2 |
814 |
Chromium (III) sequioxide |
Cr2O3 |
2279 |
Chromium trioxide |
CrO3 |
197 |
Cobalt |
Co |
1490 |
|
|
|
Source: data from: Weast, R C., Ed., Handbook of Chemistry and Physics, 55th ed., CRC Press, Cleveland, (1974); and Bolz, R. E. and Tuve, G. L., Eds., Handbook of Tables for Applied Engineering Science, 2nd ed., CRC Press, Cleveland, (1973), p.479 .
©2001 CRC Press LLC

Table 71. MELTING POINTS OF ELEMENTS AND
INORGANIC COMPOUNDS (SHEET 4 OF 13)
|
|
Melting Point |
Compound |
Formula |
˚C |
|
|
|
|
|
|
Cobalt (II) chloride |
CoCl2 |
727 |
Copper |
Cu |
1083 |
Copper (II) chloride |
CuCl2 |
430 |
Copper (I) chloride |
CuCl |
429 |
Copper(l) cyanide |
Cu2(CN)2 |
473 |
Copper (I) iodide |
CuI |
587 |
Copper (II) oxide |
CuO |
1446 |
Copper (I) oxide |
Cu2O |
1230 |
Copper (I) sulfide |
Cu2S |
1129 |
Dysprosium |
Dy |
1407 |
Erbium |
Er |
1496 |
Europium |
Eu |
826 |
Europium trichloride |
EuCl3 |
622 |
Fluorine |
F2 |
–219.6 |
Gadolinium |
Gd |
1312 |
Gallium |
Ga |
29 |
Germanium |
Ge |
959 |
Gold |
Au |
1063 |
Hafnium |
Hf |
2214 |
Holmium |
Ho |
1461 |
Hydrogen |
H2 |
–259.25 |
Hydrogen bromide |
HBr |
–86.96 |
Hydrogen chloride |
HCl |
–114.3 |
Hydrogen fluoride |
HF |
83.11 |
Hydrogen iodide |
HI |
–50.91 |
Hydrogen nitrate |
HNO3 |
–47.2 |
Hydrogen oxide (water) |
H2O |
0 |
Deuterium oxide |
D2O |
3.78 |
|
|
|
Source: data from: Weast, R C., Ed., Handbook of Chemistry and Physics, 55th ed., CRC Press, Cleveland, (1974); and Bolz, R. E. and Tuve, G. L., Eds., Handbook of Tables for Applied Engineering Science, 2nd ed., CRC Press, Cleveland, (1973), p.479 .
©2001 CRC Press LLC

Table 71. MELTING POINTS OF ELEMENTS AND
INORGANIC COMPOUNDS (SHEET 5 OF 13)
|
|
Melting Point |
Compound |
Formula |
˚C |
|
|
|
|
|
|
Hydrogen peroxide |
H2O2 |
–0.7 |
Hydrogen selenate |
H2SeO4 |
57.8 |
Hydrogen sulfate |
H2SO4 |
10.4 |
Hydrogen sulfide |
H2S |
–85.6 |
Hydrogen sulfide, di– |
H2S2 |
–89.7 |
Hydrogen telluride |
H2Te |
–49.0 |
Indium |
In |
156.3 |
lodine |
I2 |
112.9 |
lodine chloride (α) |
ICl |
17.1 |
lodine chloride (β) |
ICl |
13.8 |
Iron |
Fe |
1530.0 |
Iron carbide |
Fe3C |
1226.8 |
Iron (III) chloride |
Fe2Cl6 |
303.8 |
Iron (II) chloride |
FeCl2 |
677 |
Iron (II) oxide |
FeO |
1380 |
Iron oxide |
Fe3O4 |
1596 |
Iron pentacarbonyl |
Fe(CO)5 |
–21.2 |
Iron (II) sulfide |
FeS |
1195 |
Lanthanum |
La |
920 |
Lead |
Pb |
327.3 |
Leadbromide |
PbBr2 |
487.8 |
Lead chloride |
PbCl2 |
497.8 |
Lead fluoride |
PbF2 |
823 |
Lead iodide |
PbI2 |
412 |
|
|
|
Source: data from: Weast, R C., Ed., Handbook of Chemistry and Physics, 55th ed., CRC Press, Cleveland, (1974); and Bolz, R. E. and Tuve, G. L., Eds., Handbook of Tables for Applied Engineering Science, 2nd ed., CRC Press, Cleveland, (1973), p.479 .
©2001 CRC Press LLC

Table 71. MELTING POINTS OF ELEMENTS AND
INORGANIC COMPOUNDS (SHEET 6 OF 13)
|
|
Melting Point |
Compound |
Formula |
˚C |
|
|
|
|
|
|
Lead molybdate |
PbMoO4 |
1065 |
Lead oxide |
PbO |
890 |
Lead sulfate |
PbSO4 |
1087 |
Lead sulfide |
PbS |
1114 |
Lithium |
Li |
178.8 |
Lithium bromide |
LiBr |
552 |
Lithium chloride |
LiCl |
614 |
Lithium fluoride |
LiF |
896 |
Lithium hydroxide |
LiOH |
462 |
Lithium iodide |
LiI |
440 |
Lithium metasilicate |
Li2SiO3 |
1177 |
Lithium molybdate |
Li2MoO4 |
705 |
Lithium nitrate |
LiNO3 |
250 |
Lithium orthosilicate |
Li4SiO4 |
1249 |
Lithium sulfate |
Li2SO4 |
857 |
Lithium tungstate |
Li2WO4 |
742 |
Lutetium |
Lu |
1651 |
Magnesium |
Mg |
650 |
Magnesium bromide |
MgBr2 |
711 |
Magnesium chloride |
MgCl2 |
712 |
Magnesium fluoride |
MgF2 |
1221 |
Magnesium oxide |
MgO |
2642 |
Magnesium silicate |
MgSiO3 |
1524 |
Magnesium sulfate |
MgSO4 |
1327 |
|
|
|
Source: data from: Weast, R C., Ed., Handbook of Chemistry and Physics, 55th ed., CRC Press, Cleveland, (1974); and Bolz, R. E. and Tuve, G. L., Eds., Handbook of Tables for Applied Engineering Science, 2nd ed., CRC Press, Cleveland, (1973), p.479 .
©2001 CRC Press LLC

Table 71. MELTING POINTS OF ELEMENTS AND
INORGANIC COMPOUNDS (SHEET 7 OF 13)
|
|
Melting Point |
Compound |
Formula |
˚C |
|
|
|
|
|
|
Manganese |
Mn |
1220 |
Manganese dichloride |
MnCl2 |
650 |
Manganese metasilicate |
MnSiO3 |
1274 |
Manganese (II) oxide |
MnO |
1784 |
Manganese oxide |
Mn3O4 |
1590 |
Mercury |
Hg |
–39 |
Mercury bromide |
HgBr2 |
241 |
Mercury chloride |
HgCl2 |
276.8 |
Mercury iodide |
HgI2 |
250 |
Mercury sulfate |
HgSO4 |
850 |
Molybdenum |
Mo |
2622 |
Molybdenum dichloride |
MoCl2 |
726.8 |
Molybdenum hexafluoride |
MoF6 |
17 |
Molybdenum trioxide |
MoO3 |
795 |
Neodymium |
Nd |
1020 |
Neon |
Ne |
– 248.6 |
Nickel |
Ni |
1452 |
Nickel chloride |
NiCl2 |
1030 |
Nickel subsulfide |
Ni3S2 |
790 |
Niobium |
Nb |
2496 |
Niobium pentachloride |
NbCl5 |
21 l |
Niobium pentoxide |
Nb2O5 |
1511 |
Nitric oxide |
NO |
–163.7 |
Nitrogen |
N2 |
–210 |
|
|
|
Source: data from: Weast, R C., Ed., Handbook of Chemistry and Physics, 55th ed., CRC Press, Cleveland, (1974); and Bolz, R. E. and Tuve, G. L., Eds., Handbook of Tables for Applied Engineering Science, 2nd ed., CRC Press, Cleveland, (1973), p.479 .
©2001 CRC Press LLC

Table 71. MELTING POINTS OF ELEMENTS AND
INORGANIC COMPOUNDS (SHEET 8 OF 13)
|
|
Melting Point |
Compound |
Formula |
˚C |
|
|
|
|
|
|
Nitrogen tetroxide |
N2O4 |
–13.2 |
Nitrous oxide |
N2O |
–90.9 |
Osmium |
Os |
2700 |
Osmium tetroxide (white) |
OsO4 |
41.8 |
Osmium tetroxide (yellow) |
OsO4 |
55.8 |
Oxygen |
O2 |
–218.8 |
Palladium |
Pd |
1555 |
Phosphoric acid |
H3PO4 |
42.3 |
Phosphoric acid. hypo– |
H4P2O6 |
54.8 |
Phosphorus acid, hypo– |
H3PO2 |
17.3 |
Phosphorus acid, ortho– |
H3PO3 |
73.8 |
Phosphorus oxychloride |
POCl3 |
1.0 |
Phosphorus pentoxide |
P4O10 |
569.0 |
Phosphorus trioxide |
P4O6 |
23.7 |
Phosphorus, yellow |
P4 |
44.1 |
Platinum |
Pt |
1770 |
Potassium |
K |
63.4 |
Potassium borate, meta– |
KBO2 |
947 |
Potassium bromide |
KBr |
742 |
Potassium carbonate |
K2CO3 |
897 |
Potassium chloride |
KCl |
770 |
Potassium chromate |
K2CrO4 |
984 |
Potassium cyanide |
KCN |
623 |
Potassium dichromate |
K2Cr2O7 |
398 |
|
|
|
Source: data from: Weast, R C., Ed., Handbook of Chemistry and Physics, 55th ed., CRC Press, Cleveland, (1974); and Bolz, R. E. and Tuve, G. L., Eds., Handbook of Tables for Applied Engineering Science, 2nd ed., CRC Press, Cleveland, (1973), p.479 .
©2001 CRC Press LLC

Table 71. MELTING POINTS OF ELEMENTS AND
INORGANIC COMPOUNDS (SHEET 9 OF 13)
|
|
Melting Point |
Compound |
Formula |
˚C |
|
|
|
|
|
|
Potassium fluoride |
KF |
875 |
Potassium hydroxide |
KOH |
360 |
Potassium iodide |
Kl |
682 |
Potassium nitrate |
KNO3 |
338 |
Potassium peroxide |
K2O2 |
490 |
Potassium phosphate |
K3PO4 |
1340 |
Potassium pyro– phosphate |
K4P2O7 |
1092 |
Potassium sulfate |
K2SO4 |
1074 |
Potassium thiocyanate |
KSCN |
179 |
Praseodymium |
Pr |
931 |
Rhenium |
Re |
3167±60 |
Rhenium heptoxide |
Re2O7 |
296 |
Rhenium hexafluoride |
ReF6 |
19.0 |
Rubidium |
Rb |
38 .9 |
Rubidium bromide |
RbBr |
677 |
Rubidium chloride |
RbCl |
717 |
Rubidium fluoride |
RbF |
833 |
Rubidium iodide |
Rbl |
638 |
Rubidium nitrate |
RbNO3 |
305 |
Samarium |
Sm |
1072 |
Scandium |
Sc |
1538 |
Selenium |
Se |
217 |
Seleniumoxychloride |
SeOCl3 |
9.8 |
Silane, hexaHuoro– |
Si2F6 |
–28.6 |
Silicon |
Si |
1427 |
Silicon dioxide (Cristobalite) |
SiO2 |
1723 |
Silicon tetrachloride |
SiCl4 |
–67.7 |
|
|
|
Source: data from: Weast, R C., Ed., Handbook of Chemistry and Physics, 55th ed., CRC Press, Cleveland, (1974); and Bolz, R. E. and Tuve, G. L., Eds., Handbook of Tables for Applied Engineering Science, 2nd ed., CRC Press, Cleveland, (1973), p.479 .
©2001 CRC Press LLC

Table 71. MELTING POINTS OF ELEMENTS AND
INORGANIC COMPOUNDS (SHEET 10 OF 13)
|
|
Melting Point |
Compound |
Formula |
˚C |
|
|
|
|
|
|
Silver |
Ag |
961 |
Silver bromide |
AgBr |
430 |
Silver chloride |
AgCl |
455 |
Silver cyanide |
AgCN |
350 |
Silver iodide |
Agl |
557 |
Silver nitrate |
AgNO3 |
209 |
Silver sulfate |
Ag2SO4 |
657 |
Silver sulfide |
Ag2S |
841 |
Sodium |
Na |
97.8 |
Sodium borate, meta– |
NaBO2 |
966 |
Sodium bromide |
NaBr |
747 |
Sodium carbonate |
Na2CO3 |
854 |
Sodium chlorate |
NaClO3 |
255 |
Sodium chloride |
NaCl |
800 |
Sodium cyanide |
NaCN |
562 |
Sodium fluoride |
NaF |
992 |
Sodium hydroxide |
NaOH |
322 |
Sodium iodide |
Nal |
662 |
Sodium molybdate |
Na2MoO4 |
687 |
Sodium nitrate |
NaNO3 |
310 |
Sodium peroxide |
Na2O2 |
460 |
Sodium phosphate, meta– |
NaPO3 |
988 |
Sodium pyrophosphate |
Na4P2O7 |
970 |
Sodiumsilicate,aluminum– |
NaAlSi3O8 |
1107 |
|
|
|
Source: data from: Weast, R C., Ed., Handbook of Chemistry and Physics, 55th ed., CRC Press, Cleveland, (1974); and Bolz, R. E. and Tuve, G. L., Eds., Handbook of Tables for Applied Engineering Science, 2nd ed., CRC Press, Cleveland, (1973), p.479 .
©2001 CRC Press LLC
Table 71. MELTING POINTS OF ELEMENTS AND
INORGANIC COMPOUNDS (SHEET 11 OF 13)
|
|
Melting Point |
Compound |
Formula |
˚C |
|
|
|
|
|
|
Sodium silicate, di– |
Na2Si2O5 |
884 |
Sodium silicate, meta– |
Na2SiO3 |
1087 |
Sodium sulfate |
Na2SO4 |
884 |
Sodium sulfide |
Na2S |
920 |
Sodium thiocyanate |
NaSCN |
323 |
Sodium tungstate |
Na2WO4 |
702 |
Strontium |
Sr |
757 |
Strontium bromide |
SrBr2 |
643 |
Strontium chloride |
SrCl2 |
872 |
Strontium fluoride |
SrF2 |
1400 |
Strontium oxide |
SrO |
2430 |
Sulfur (monatomic) |
S |
119, |
Sulfur dioxide |
SO2 |
– 73.2 |
Sulfur trioxide (α) |
SO3 |
16.8 |
Sulfur trioxide (β) |
SO3 |
32.3 |
Sulfur trioxide (γ) |
SO3 |
62.1 |
Tantalum |
Ta |
2996 ± 50 |
Tantalum pentachloride |
TaCl5 |
206.8 |
Tantalum pentoxide |
Ta2O5 |
1877 |
Tellurium |
Te |
453 |
Terbium |
Tb |
1356 |
Thallium |
Tl |
302.4 |
Thallium bromide, mono– |
TlBr |
460 |
Thallium carbonate |
Tl2CO3 |
273 |
|
|
|
Source: data from: Weast, R C., Ed., Handbook of Chemistry and Physics, 55th ed., CRC Press, Cleveland, (1974); and Bolz, R. E. and Tuve, G. L., Eds., Handbook of Tables for Applied Engineering Science, 2nd ed., CRC Press, Cleveland, (1973), p.479 .
©2001 CRC Press LLC

Table 71. MELTING POINTS OF ELEMENTS AND
INORGANIC COMPOUNDS (SHEET 12 OF 13)
|
|
Melting Point |
Compound |
Formula |
˚C |
|
|
|
|
|
|
Thallium chloride, mono– |
TICl |
427 |
Thallium iodide, mono– |
TlI |
440 |
Thallium nitrate |
TINO3 |
207 |
Thallium sulfate |
Tl2SO4 |
632 |
Thallium sulfide |
Tl2S |
449 |
Thorium |
Th |
1845 |
Thorium chloride |
ThCl4 |
765 |
Thorium dioxide |
ThO2 |
2952 |
Thulium |
Tm |
1545 |
Tin |
Sn |
231.7 |
Tin bromide, di– |
SnBr2 |
231.8 |
Tin bromide, tetra– |
SnBr4 |
29.8 |
Tin chloride, di– |
SnCl2 |
247 |
Tinchloride,tetra– |
SnCl4 |
–33.3 |
Tin iodide, tetra– |
SnI4 |
143.4 |
Tin oxide |
SnO |
1042 |
Titanium |
Ti |
1800 |
Titanium bromide, tetra– |
TiBr4 |
38 |
Titanium chloride, tetra– |
TiCl4 |
–23.2 |
Titanium dioxide |
TiO2 |
1825 |
Titanium oxide |
TiO |
991 |
Tungsten |
W |
3387 |
Tungsten dioxide |
WO2 |
1270 |
Tungsten hexafluoride |
WF6 |
–0.5 |
|
|
|
Source: data from: Weast, R C., Ed., Handbook of Chemistry and Physics, 55th ed., CRC Press, Cleveland, (1974); and Bolz, R. E. and Tuve, G. L., Eds., Handbook of Tables for Applied Engineering Science, 2nd ed., CRC Press, Cleveland, (1973), p.479 .
©2001 CRC Press LLC

Table 71. MELTING POINTS OF ELEMENTS AND
INORGANIC COMPOUNDS (SHEET 13 OF 13)
|
|
Melting Point |
Compound |
Formula |
˚C |
|
|
|
|
|
|
Tungsten tetrachloride |
WCl4 |
327 |
Tungsten trioxide |
WO3 |
1470 |
Uranium235 |
U |
~1133 |
Uranium tetrachloride |
UCl4 |
590 |
Vanadium |
V |
1917 |
Vanadium dichloride |
VCl2 |
1027 |
Vanadium oxide |
VO |
2077 |
Vanadium pentoxide |
V2O5 |
670 |
Xenon |
Xe |
–111.6 |
Ytterbium |
Yb |
823 |
Yttrium |
Y |
1504 |
Yttrium oxide |
Y2O3 |
2227 |
Zinc |
Zn |
419.4 |
Zincchloride |
ZnCl2 |
283 |
Zinc oxide |
ZnO |
1975 |
Zinc sulfide |
ZnS |
1745 |
Zirconium |
Zr |
1857 |
Zirconium dichloride |
ZrCl2 |
727 |
Zirconium oxide |
ZrO2 |
2715 |
|
|
|
Source: data from: Weast, R C., Ed., Handbook of Chemistry and Physics, 55th ed., CRC Press, Cleveland, (1974); and Bolz, R. E. and Tuve, G. L., Eds., Handbook of Tables for Applied Engineering Science, 2nd ed., CRC Press, Cleveland, (1973), p.479 .
©2001 CRC Press LLC

Table 72. MELTING POINTS OF CERAMICS
|
(SHEET 1 OF 11) |
|
|
|
|
Compound |
|
(K) |
|
|
|
|
|
|
AgBr |
|
703 |
AgCl |
|
728 |
AgF |
|
708 |
AgI |
|
831 |
AgNO3 |
|
483 |
Ag2O |
|
573 |
Ag2SO4 |
|
933 |
Ag2S |
|
1098 |
AlBr3 |
|
371 |
Al4C3 |
|
2000 |
AlCl3 |
|
465 |
AlF3 |
|
1564 |
AlI |
|
464 |
AlN |
|
>2475 |
Al2O3 |
|
2322 |
Al2(SO4)3 |
|
1043 |
Al2S3 |
|
1373 |
BBr3 |
|
227 |
B4C |
|
2720 |
BCl3 |
|
166 |
BF3 |
|
146 |
BN |
|
3000 |
B2O3 |
|
723 |
BS4 |
|
663 |
|
|
|
Source: data from: Lynch, Charles T., Ed., CRC Handbook of Materials Science, Vol. 1, CRC Press, Boca Raton, 1974, 348.
©2001 CRC Press LLC

Table 72. MELTING POINTS OF CERAMICS
|
(SHEET 2 OF 11) |
|
|
|
|
Compound |
|
(K) |
|
|
|
|
|
|
BaB4 |
|
2543 |
BaBr2 |
|
1123 |
BaCl2 |
|
1235 |
BaF2 |
|
1627 |
BaI2 |
|
1013 |
Ba(NO3)2 |
|
865 |
BaO |
|
2283 |
BaSO4 |
|
1853 |
BaS |
|
1473 |
BeB2 |
|
>2243 |
BeBr2 |
|
793 |
Be2C |
|
>2375 |
BeCl2 |
|
713 |
BeF2 |
|
813 |
BeI2 |
|
783 |
Be3N2 |
|
2513 |
BeO |
|
2725 |
BeSO4 |
|
848 |
BiBr3 |
|
491 |
BiCl3 |
|
507 |
BiF3 |
|
1000 |
BiI3 |
|
681 |
B2O3 |
|
1098 |
Bi(SO4)3 |
|
678 |
|
|
|
Source: data from: Lynch, Charles T., Ed., CRC Handbook of Materials Science, Vol. 1, CRC Press, Boca Raton, 1974, 348.
©2001 CRC Press LLC

Table 72. MELTING POINTS OF CERAMICS
|
(SHEET 3 OF 11) |
|
|
|
|
Compound |
|
(K) |
|
|
|
|
|
|
Bi2S3 |
|
1020 |
CaBr2 |
|
1003 |
CaCl2 |
|
1055 |
CaF2 |
|
1675 |
CaI2 |
|
848 |
Ca(NO3)2 |
|
623 |
Ca3N2 |
|
1468 |
CaO |
|
3183 |
CaSO4 |
|
1723 |
CdBr2 |
|
841 |
CdCl2 |
|
841 |
CdF2 |
|
1373 |
CdI2 |
|
423 |
Cd(NO3)2 |
|
834 |
CdO |
|
1773 |
CdSO4 |
|
1273 |
CdS |
|
2023 |
CeB6 |
|
2463 |
CeCl3 |
|
1095 |
CeF2 |
|
1710 |
CeI3 |
|
1025 |
CeO2 |
|
>2873 |
CeS |
|
2400 |
Ce(SO4)2 |
|
468 |
|
|
|
Source: data from: Lynch, Charles T., Ed., CRC Handbook of Materials Science, Vol. 1, CRC Press, Boca Raton, 1974, 348.
©2001 CRC Press LLC

Table 72. MELTING POINTS OF CERAMICS
|
(SHEET 4 OF 11) |
|
|
|
|
Compound |
|
(K) |
|
|
|
|
|
|
CrB2 |
|
2123 |
Cr3C2 |
|
2168 |
CrN |
|
1770 |
Cr2O3 |
|
>2603 |
CrSi2 |
|
1843 |
CuBr |
|
777 |
CuCl |
|
695 |
CuF2 |
|
1129 |
CuI |
|
878 |
Cu3N |
|
573 |
Cu2O |
|
1508 |
Cu4Si |
|
1123 |
Cu2S |
|
1400 |
FeBr2 |
|
955 |
Fe3C |
|
2110 |
FeCl2 |
|
945 |
FeF3 |
|
>1275 |
Fe2O3 |
|
1864 |
Fe2(SO4)3 |
|
753 |
FeS |
|
1468 |
InBr3 |
|
709 |
InCl |
|
498 |
InF3 |
|
1443 |
InI3 |
|
483 |
|
|
|
Source: data from: Lynch, Charles T., Ed., CRC Handbook of Materials Science, Vol. 1, CRC Press, Boca Raton, 1974, 348.
©2001 CRC Press LLC

Table 72. MELTING POINTS OF CERAMICS
|
(SHEET 5 OF 11) |
|
|
|
|
Compound |
|
(K) |
|
|
|
|
|
|
In2O3 |
|
2183 |
In2S3 |
|
1323 |
KBr |
|
1008 |
KCl |
|
1043 |
KF |
|
1131 |
KI |
|
958 |
KNO3 |
|
610 |
K2O3 |
|
703 |
K2SO4 |
|
1342 |
K2S |
|
1113 |
LiBr |
|
823 |
LiCl |
|
883 |
LiF |
|
1119 |
LiI |
|
722 |
LiNO3 |
|
527 |
Li3N |
|
1118 |
Li2O |
|
>1975 |
Li2SO4 |
|
1132 |
Li2S |
|
1198 |
MgBr2 |
|
984 |
MgCl2 |
|
987 |
MgF2 |
|
1535 |
MgI2 |
|
<910 |
MgO |
|
3098 |
Mg2Si |
|
1375 |
MgS |
|
>2275 |
MgSO4 |
|
1397 |
MnCl2 |
|
923 |
|
|
|
Source: data from: Lynch, Charles T., Ed., CRC Handbook of Materials Science, Vol. 1, CRC Press, Boca Raton, 1974, 348.
©2001 CRC Press LLC

Table 72. MELTING POINTS OF CERAMICS
|
(SHEET 6 OF 11) |
|
|
|
|
Compound |
|
(K) |
|
|
|
|
|
|
MnF2 |
|
1129 |
MnO |
|
1840 |
MoB |
|
2625 |
Mo2C |
|
2963 |
MoF6 |
|
290 |
MoI4 |
|
373 |
MoO3 |
|
1068 |
MoSi2 |
|
2553 |
MoS2 |
|
1458 |
NaBr |
|
1023 |
NaC2 |
|
973 |
NaCl |
|
1073 |
NaF |
|
1267 |
NaI |
|
935 |
NaNO3 |
|
583 |
Na2N |
|
573 |
Na2SO4 |
|
1157 |
Na2S |
|
1453 |
NbB |
|
>2270 |
NbC |
|
3770 |
NbN |
|
2323 |
Nb2O5 |
|
1764 |
NbSi2 |
|
2203 |
NiBr2 |
|
1236 |
NiCl3 |
|
1274 |
NiF2 |
|
1273 |
NiI2 |
|
1070 |
NiO |
|
2257 |
|
|
|
Source: data from: Lynch, Charles T., Ed., CRC Handbook of Materials Science, Vol. 1, CRC Press, Boca Raton, 1974, 348.
©2001 CRC Press LLC

Table 72. MELTING POINTS OF CERAMICS
|
(SHEET 7 OF 11) |
|
|
|
|
Compound |
|
(K) |
|
|
|
|
|
|
NiSO4 |
|
1121 |
NiS |
|
1070 |
PbBr2 |
|
643 |
PbCl2 |
|
771 |
PbF2 |
|
1095 |
PbI2 |
|
675 |
Pb(NO3)2 |
|
743 |
PbO |
|
1159 |
PbSO4 |
|
1443 |
PbS |
|
1387 |
PtBr2 |
|
523 |
PtCl2 |
|
854 |
PtI2 |
|
633 |
PtS2 |
|
508 |
SbBr3 |
|
370 |
SbCl3 |
|
346 |
SbF3 |
|
565 |
SbI3 |
|
443 |
Sb2O3 |
|
928 |
SbS3 |
|
820 |
SiC |
|
2970 |
SiF4 |
|
183 |
Si3N4 |
|
2715 |
SiO2 |
|
1978 |
|
|
|
Source: data from: Lynch, Charles T., Ed., CRC Handbook of Materials Science, Vol. 1, CRC Press, Boca Raton, 1974, 348.
©2001 CRC Press LLC
Table 72. MELTING POINTS OF CERAMICS
|
(SHEET 8 OF 11) |
|
|
|
|
Compound |
|
(K) |
|
|
|
|
|
|
SnBr2 |
|
488 |
SnCl2 |
|
581 |
SnF4 |
|
978 |
SnI2 |
|
788 |
SnO |
|
1353 |
SnSO4 |
|
>635 |
SnS |
|
1153 |
SrB6 |
|
2508 |
SrBr2 |
|
916 |
SrC2 |
|
>1970 |
SrCl2 |
|
1148 |
SrF2 |
|
1736 |
SrI2 |
|
593 |
Sr(NO3)2 |
|
643 |
SrO |
|
2933 |
SrSO4 |
|
1878 |
SrS |
|
>2275 |
TaB |
|
>2270 |
TaBr5 |
|
538 |
TaC |
|
3813 |
TaCl5 |
|
489 |
TaF5 |
|
370 |
Ta2N |
|
3360 |
Ta2O5 |
|
2100 |
|
|
|
Source: data from: Lynch, Charles T., Ed., CRC Handbook of Materials Science, Vol. 1, CRC Press, Boca Raton, 1974, 348.
©2001 CRC Press LLC

Table 72. MELTING POINTS OF CERAMICS
|
(SHEET 9 OF 11) |
|
|
|
|
Compound |
|
(K) |
|
|
|
|
|
|
TaSi2 |
|
2670 |
TaS4 |
|
>1575 |
TeBr2 |
|
612 |
TeCl2 |
|
448 |
TeO2 |
|
1006 |
ThB4 |
|
>2270 |
ThBr4 |
|
883 |
ThC |
|
2898 |
ThCl4 |
|
1043 |
ThF4 |
|
1375 |
ThN |
|
2903 |
ThO2 |
|
3493 |
ThS2 |
|
2198 |
TiB2 |
|
3253 |
TiBr4 |
|
312 |
TiC |
|
3433 |
TiCl4 |
|
250 |
TiF3 |
|
1475 |
TiI2 |
|
873 |
TiN |
|
3200 |
TiO2 |
|
2113 |
TiSi2 |
|
1813 |
UB2 |
|
>1770 |
UBr4 |
|
789 |
|
|
|
Source: data from: Lynch, Charles T., Ed., CRC Handbook of Materials Science, Vol. 1, CRC Press, Boca Raton, 1974, 348.
©2001 CRC Press LLC

Table 72. MELTING POINTS OF CERAMICS
|
(SHEET 10 OF 11) |
|
|
|
|
Compound |
|
(K) |
|
|
|
|
|
|
UC |
|
2863 |
UCl4 |
|
843 |
UF4 |
|
1233 |
UI4 |
|
779 |
UN |
|
3123 |
UO2 |
|
3151 |
USi2 |
|
1970 |
US2 |
|
>1375 |
VB2 |
|
2373 |
VC |
|
3600 |
VCl4 |
|
245 |
VF3 |
|
>1075 |
FI2 |
|
1048 |
VN |
|
2593 |
V2O5 |
|
947 |
VSi2 |
|
2023 |
V2S3 |
|
>875 |
WB |
|
3133 |
WC |
|
2900 |
WCl6 |
|
548 |
WO3 |
|
1744 |
WSi2 |
|
2320 |
WS2 |
|
1523 |
ZnBr2 |
|
667 |
ZnCl2 |
|
548 |
ZnF2 |
|
1145 |
ZnI2 |
|
719 |
ZnO |
|
2248 |
|
|
|
Source: data from: Lynch, Charles T., Ed., CRC Handbook of Materials Science, Vol. 1, CRC Press, Boca Raton, 1974, 348.
©2001 CRC Press LLC

Table 72. MELTING POINTS OF CERAMICS
|
(SHEET 11 OF 11) |
|
|
|
|
Compound |
|
(K) |
|
|
|
|
|
|
ZnSO4 |
|
873 |
ZrB2 |
|
3313 |
ZrBr2 |
|
>625 |
ZrC |
|
3533 |
ZrCl2 |
|
623 |
ZrF4 |
|
873 |
ZrI4 |
|
772 |
ZrN |
|
3250 |
ZrO2 |
|
3123 |
Zr(SO4)2 |
|
683 |
ZrS2 |
|
1823 |
|
|
|
Source: data from: Lynch, Charles T., Ed., CRC Handbook of Materials Science, Vol. 1, CRC Press, Boca Raton, 1974, 348.
©2001 CRC Press LLC

Table 73. HEAT OF FUSION FOR ELEMENTS AND
INORGANIC COMPOUNDS (SHEET 1 OF 16)
|
|
Melting |
Heat of fusion |
|
|
|
|
|
|
|
|
point |
|
|
|
|
|
|
|
Compound |
Formula |
˚C |
cal/g |
cal/g mole |
Actinium227 |
Ac |
1050±50 |
(11.0) |
(3400) |
Aluminum |
Al |
658.5 |
94.5 |
2550 |
Aluminum bromide |
Al2Br6 |
87.4 |
10.1 |
5420 |
Aluminum chloride |
Al2Cl6 |
192.4 |
63.6 |
19600 |
Aluminum iodide |
Al2I6 |
190.9 |
9.8 |
7960 |
Aluminum oxide |
Al2O3 |
2045.0 |
(256.0) |
(26000) |
Antimony |
Sb |
630 |
39.1 |
4770 |
Antimony pentachloride |
SbCl5 |
4.0 |
8.0 |
2400 |
Antimony tribromide |
SbBr3 |
96.8 |
9.7 |
3510 |
Antimony trichloride |
SbCl3 |
73.3 |
13.3 |
3030 |
Antimony trioxide |
Sb4O6 |
655.0 |
(46.3) |
(26990) |
Antimony trisulfide |
Sb4S6 |
546.0 |
33.0 |
11200 |
Argon |
Ar |
190.2 |
7.25 |
290 |
Arsenic |
As |
816.8 |
(22.0) |
(6620) |
Arsenic pentafluoride |
AsF5 |
80.8 |
16.5 |
2800 |
Arsenic tribromide |
AsBr3 |
30.0 |
8.9 |
2810 |
Arsenic trichloride |
AsCl3 |
–16.0 |
13.3 |
2420 |
Arsenic trifluoride |
AsF3 |
–6.0 |
18.9 |
2486 |
Arsenic trioxide |
As4O6 |
312.8 |
22.2 |
8000 |
Barium |
Ba |
725 |
13.3 |
1830 |
For heat of fusion in J/kg, multiply values in cal/g by 4184.
For heat of fusion in J/mol, multiply values in cal/g-mol (=cal/mol) by 4.184. For melting point in K, add 273.15 to values in ˚C.
Values in parentheses are of uncertain reliability.
Source: data from Weast, R C., Ed., Handbook of Chemistry and Physics, 55th ed., CRC Press, Cleveland, (1974); and Bolz, R. E. and Tuve, G. L., Eds., Handbook of Tables for Applied Engineering Science, 2nd ed., CRC Press, Cleveland, (1973)
©2001 CRC Press LLC

Table 73. HEAT OF FUSION FOR ELEMENTS AND
INORGANIC COMPOUNDS (SHEET 2 OF 16)
|
|
Melting |
Heat of fusion |
|
|
|
|
|
|
|
|
point |
|
|
|
|
|
|
|
Compound |
Formula |
˚C |
cal/g |
cal/g mole |
|
|
|
|
|
|
|
|
|
|
Barium bromide |
BaBr2 |
846.8 |
21.9 |
6000 |
Barium chloride |
BaCl2 |
959.8 |
25.9 |
5370 |
Barium fluoride |
BaF2 |
1286.8 |
17.1 |
3000 |
Barium iodide |
BaI2 |
710.8 |
(17.3) |
(6800) |
Barium nitrate |
Ba(NO3)2 |
594.8 |
(22.6) |
(5900) |
Barium oxide |
BaO |
1922.8 |
93.2 |
13800 |
Barium phosphate |
Ba3(PO4)2 |
1727 |
30.9 |
18600 |
Barium sulfate |
BaSO4 |
1350 |
41.6 |
9700 |
Beryllium |
Be |
1278 |
260.0 |
– |
Beryllium bromide |
BeBr2 |
487.8 |
(26.6) |
(4500) |
Beryllium chloride |
BeCl2 |
404.8 |
(30) |
(3000) |
Beryllium oxide |
BeO |
2550.0 |
679.7 |
17000 |
Bismuth |
Bi |
271 |
12.0 |
2505 |
Bismuth trichloride |
BiCl3 |
223.8 |
8.2 |
2600 |
Bismuth trifluoride |
BiF3 |
726.0 |
(23.3) |
(6200) |
Bismuth trioxide |
Bi2O3 |
815.8 |
14.6 |
6800 |
Boron |
B |
2300 |
(490) |
(5300) |
Boron tribromide |
BBr3 |
–48.8 |
(2.9) |
(700) |
Boron trichloride |
BCl3 |
–107.8 |
(4.3) |
(500) |
Boron trifluoride |
BF3 |
–128.0 |
7.0 |
480 |
|
|
|
|
|
For heat of fusion in J/kg, multiply values in cal/g by 4184.
For heat of fusion in J/mol, multiply values in cal/g-mol (=cal/mol) by 4.184. For melting point in K, add 273.15 to values in ˚C.
Values in parentheses are of uncertain reliability.
Source: data from Weast, R C., Ed., Handbook of Chemistry and Physics, 55th ed., CRC Press, Cleveland, (1974); and Bolz, R. E. and Tuve, G. L., Eds., Handbook of Tables for Applied Engineering Science, 2nd ed., CRC Press, Cleveland, (1973)
©2001 CRC Press LLC

Table 73. HEAT OF FUSION FOR ELEMENTS AND
INORGANIC COMPOUNDS (SHEET 3 OF 16)
|
|
Melting |
Heat of fusion |
|
|
|
|
|
|
|
|
point |
|
|
|
|
|
|
|
Compound |
Formula |
˚C |
cal/g |
cal/g mole |
|
|
|
|
|
|
|
|
|
|
Boron trioxide |
B2O3 |
448.8 |
78.9 |
5500 |
Bromine |
Br2 |
–7.2 |
16.1 |
2580 |
Bromine pentafluoride |
BrF5 |
–61.4 |
7.07 |
1355 |
Cadmium |
Cd |
320.8 |
12.9 |
1460 |
Cadmium bromide |
CdBr2 |
567.8 |
(18.4) |
(5000) |
Cadmium chloride |
CdCl2 |
567.8 |
28.8 |
5300 |
Cadmium fluoride |
CdF2 |
1110 |
(35.9) |
(5400) |
Cadmium iodide |
CdI2 |
386.8 |
10.0 |
3660 |
Cadmium sulfate |
CdSO4 |
1000 |
22.9 |
4790 |
Calcium |
Ca |
851 |
55.7 |
2230 |
Calcium bromide |
CaBr2 |
729.8 |
20.9 |
4180 |
Calcium carbonate |
CaCO3 |
1282 |
(126) |
(12700) |
Calcium chloride |
CaCl2 |
782 |
55 |
6100 |
Calcium fluoride |
CaF2 |
1382 |
52.5 |
4100 |
Calcium metasilicate |
CaSiO3 |
1512 |
115.4 |
13400 |
Calcium nitrate |
Ca(NO3)2 |
560.8 |
31.2 |
5120 |
Calcium oxide |
CaO |
2707 |
(218.1) |
(12240) |
Calcium sulfate |
CaSO4 |
1297 |
49.2 |
6700 |
Carbon dioxide |
CO2 |
–57.6 |
43.2 |
1900 |
Carbon monoxide |
CO |
–205 |
7.13 |
199.7 |
|
|
|
|
|
For heat of fusion in J/kg, multiply values in cal/g by 4184.
For heat of fusion in J/mol, multiply values in cal/g-mol (=cal/mol) by 4.184. For melting point in K, add 273.15 to values in ˚C.
Values in parentheses are of uncertain reliability.
Source: data from Weast, R C., Ed., Handbook of Chemistry and Physics, 55th ed., CRC Press, Cleveland, (1974); and Bolz, R. E. and Tuve, G. L., Eds., Handbook of Tables for Applied Engineering Science, 2nd ed., CRC Press, Cleveland, (1973)
©2001 CRC Press LLC

Table 73. HEAT OF FUSION FOR ELEMENTS AND
INORGANIC COMPOUNDS (SHEET 4 OF 16)
|
|
Melting |
Heat of fusion |
|
|
|
|
|
|
|
|
point |
|
|
|
|
|
|
|
Compound |
Formula |
˚C |
cal/g |
cal/g mole |
Cyanogen |
C2N2 |
–27.2 |
39.6 |
2060 |
Cyanogen chloride |
CNCl |
–5.2 |
36.4 |
2240 |
Cerium |
Ce |
775 |
27.2 |
2120 |
Cesium |
Cs |
28.3 |
3.7 |
500 |
Cesium chloride |
CsCl |
38.5 |
21.4 |
3600 |
Cesium nitrate |
CsNO3 |
406.8 |
16.6 |
3250 |
Chlorine |
Cl2 |
–103±5 |
22.8 |
1531 |
Chromium |
Cr |
1890 |
62.1 |
3660 |
Chromium (II) chloride |
CrCl2 |
814 |
65.9 |
7700 |
Chromium (III) sequioxide |
Cr2O3 |
2279 |
27.6 |
4200 |
Chromium trioxide |
CrO3 |
197 |
37.7 |
3770 |
Cobalt |
Co |
1490 |
62.1 |
3640 |
Cobalt (II) chloride |
CoCl2 |
727 |
56.9 |
7390 |
Copper |
Cu |
1083 |
49.0 |
3110 |
Copper (II) chloride |
CuCl2 |
430 |
24.7 |
4890 |
Copper (I) chloride |
CuCl |
429 |
26.4 |
2620 |
Copper(l) cyanide |
Cu2(CN)2 |
473 |
(30.1) |
(5400) |
Copper (I) iodide |
CuI |
587 |
(13.6) |
(2600) |
Copper (II) oxide |
CuO |
1446 |
35.4 |
2820 |
Copper (I) oxide |
Cu2O |
1230 |
(93.6) |
(l3400) |
For heat of fusion in J/kg, multiply values in cal/g by 4184.
For heat of fusion in J/mol, multiply values in cal/g-mol (=cal/mol) by 4.184. For melting point in K, add 273.15 to values in ˚C.
Values in parentheses are of uncertain reliability.
Source: data from Weast, R C., Ed., Handbook of Chemistry and Physics, 55th ed., CRC Press, Cleveland, (1974); and Bolz, R. E. and Tuve, G. L., Eds., Handbook of Tables for Applied Engineering Science, 2nd ed., CRC Press, Cleveland, (1973)
©2001 CRC Press LLC

Table 73. HEAT OF FUSION FOR ELEMENTS AND
INORGANIC COMPOUNDS (SHEET 5 OF 16)
|
|
Melting |
Heat of fusion |
|
|
|
|
|
|
|
|
point |
|
|
|
|
|
|
|
Compound |
Formula |
˚C |
cal/g |
cal/g mole |
|
|
|
|
|
|
|
|
|
|
Copper (I) sulfide |
Cu2S |
1129 |
62.3 |
5500 |
Dysprosium |
Dy |
1407 |
25.2 |
4100 |
Erbium |
Er |
1496 |
24.5 |
4100 |
Europium |
Eu |
826 |
16.4 |
2500 |
Europium trichloride |
EuCl3 |
622 |
(20.9) |
(8000) |
Fluorine |
F2 |
–219.6 |
6.4 |
244.0 |
Gadolinium |
Gd |
1312 |
23.8 |
3700 |
Gallium |
Ga |
29 |
19.1 |
1336 |
Germanium |
Ge |
959 |
(114.3) |
(8300) |
Gold |
Au |
1063 |
(15.3) |
3030 |
Hafnium |
Hf |
2214 |
(34.1) |
(6000) |
Holmium |
Ho |
1461 |
24.8 |
4100 |
Hydrogen |
H2 |
–259.25 |
13.8 |
28 |
Hydrogen bromide |
HBr |
–86.96 |
7.1 |
575.1 |
Hydrogen chloride |
HCl |
–114.3 |
13.0 |
476.0 |
Hydrogen fluoride |
HF |
83.11 |
54.7 |
1094 |
Hydrogen iodide |
HI |
–50.91 |
5.4 |
686.3 |
Hydrogen nitrate |
HNO3 |
–47.2 |
9.5 |
601 |
Hydrogen oxide (water) |
H2O |
0 |
79.72 |
1436 |
Deuterium oxide |
D2O |
3.78 |
75.8 |
1516 |
|
|
|
|
|
For heat of fusion in J/kg, multiply values in cal/g by 4184.
For heat of fusion in J/mol, multiply values in cal/g-mol (=cal/mol) by 4.184. For melting point in K, add 273.15 to values in ˚C.
Values in parentheses are of uncertain reliability.
Source: data from Weast, R C., Ed., Handbook of Chemistry and Physics, 55th ed., CRC Press, Cleveland, (1974); and Bolz, R. E. and Tuve, G. L., Eds., Handbook of Tables for Applied Engineering Science, 2nd ed., CRC Press, Cleveland, (1973)
©2001 CRC Press LLC

Table 73. HEAT OF FUSION FOR ELEMENTS AND
INORGANIC COMPOUNDS (SHEET 6 OF 16)
|
|
Melting |
Heat of fusion |
|
|
|
|
|
|
|
|
point |
|
|
|
|
|
|
|
Compound |
Formula |
˚C |
cal/g |
cal/g mole |
|
|
|
|
|
|
|
|
|
|
Hydrogen peroxide |
H2O2 |
–0.7 |
8.58 |
2920 |
Hydrogen selenate |
H2SeO4 |
57.8 |
23.8 |
3450 |
Hydrogen sulfate |
H2SO4 |
10.4 |
24.0 |
2360 |
Hydrogen sulfide |
H2S |
–85.6 |
16.8 |
5683 |
Hydrogen sulfide, di– |
H2S2 |
–89.7 |
27.3 |
1805 |
Hydrogen telluride |
H2Te |
–49.0 |
12.9 |
1670 |
Indium |
In |
156.3 |
6.8 |
781 |
lodine |
I2 |
112.9 |
14.3 |
3650 |
lodine chloride (α) |
ICl |
17.1 |
16.4 |
2660 |
lodine chloride (β) |
ICl |
13.8 |
13.3 |
2270 |
Iron |
Fe |
1530.0 |
63.7 |
3560 |
Iron carbide |
Fe3C |
1226.8 |
68.6 |
12330 |
Iron (III) chloride |
Fe2Cl6 |
303.8 |
63.2 |
20500 |
Iron (II) chloride |
FeCl2 |
677 |
61.5 |
7800 |
Iron (II) oxide |
FeO |
1380 |
(107.2) |
(7700) |
Iron oxide |
Fe3O4 |
1596 |
142.5 |
33000 |
Iron pentacarbonyl |
Fe(CO)5 |
–21.2 |
16.5 |
3250 |
Iron (II) sulfide |
FeS |
1195 |
56.9 |
5000 |
Lanthanum |
La |
920 |
17.4 |
2400 |
Lead |
Pb |
327.3 |
5.9 |
1224 |
|
|
|
|
|
For heat of fusion in J/kg, multiply values in cal/g by 4184.
For heat of fusion in J/mol, multiply values in cal/g-mol (=cal/mol) by 4.184. For melting point in K, add 273.15 to values in ˚C.
Values in parentheses are of uncertain reliability.
Source: data from Weast, R C., Ed., Handbook of Chemistry and Physics, 55th ed., CRC Press, Cleveland, (1974); and Bolz, R. E. and Tuve, G. L., Eds., Handbook of Tables for Applied Engineering Science, 2nd ed., CRC Press, Cleveland, (1973)
©2001 CRC Press LLC
Table 73. HEAT OF FUSION FOR ELEMENTS AND
INORGANIC COMPOUNDS (SHEET 7 OF 16)
|
|
Melting |
Heat of fusion |
|
|
|
|
|
|
|
|
point |
|
|
|
|
|
|
|
Compound |
Formula |
˚C |
cal/g |
cal/g mole |
|
|
|
|
|
|
|
|
|
|
Leadbromide |
PbBr2 |
487.8 |
11 7 |
4290 |
Lead chloride |
PbCl2 |
497 8 |
20.3 |
5650 |
Lead fluoride |
PbF2 |
823 |
7.6 |
1860 |
Lead iodide |
PbI2 |
412 |
17.9 |
5970 |
Lead molybdate |
PbMoO4 |
1065 |
70.8 |
(25800) |
Lead oxide |
PbO |
890 |
12.6 |
2820 |
Lead sulfate |
PbSO4 |
1087 |
31.6 |
9600 |
Lead sulfide |
PbS |
1114 |
17.3 |
4150 |
Lithium |
Li |
178.8 |
158.5 |
1100 |
Lithium bromide |
LiBr |
552 |
33 4 |
2900 |
Lithium chloride |
LiCl |
614 |
75.5 |
3200 |
Lithium fluoride |
LiF |
896 |
(91.1) |
(2360) |
Lithium hydroxide |
LiOH |
462 |
103.3 |
2480 |
Lithium iodide |
LiI |
440 |
(10.6) |
(1420) |
Lithium metasilicate |
Li2SiO3 |
1177 |
80.2 |
7210 |
Lithium molybdate |
Li2MoO4 |
705 |
24.1 |
4200 |
Lithium nitrate |
LiNO3 |
250 |
87.8 |
6060 |
Lithium orthosilicate |
Li4SiO4 |
1249 |
60.5 |
7430 |
Lithium sulfate |
Li2SO4 |
857 |
27.6 |
3040 |
Lithium tungstate |
Li2WO4 |
742 |
(25.6) |
(6700) |
|
|
|
|
|
For heat of fusion in J/kg, multiply values in cal/g by 4184.
For heat of fusion in J/mol, multiply values in cal/g-mol (=cal/mol) by 4.184. For melting point in K, add 273.15 to values in ˚C.
Values in parentheses are of uncertain reliability.
Source: data from Weast, R C., Ed., Handbook of Chemistry and Physics, 55th ed., CRC Press, Cleveland, (1974); and Bolz, R. E. and Tuve, G. L., Eds., Handbook of Tables for Applied Engineering Science, 2nd ed., CRC Press, Cleveland, (1973)
©2001 CRC Press LLC

Table 73. HEAT OF FUSION FOR ELEMENTS AND
INORGANIC COMPOUNDS (SHEET 8 OF 16)
|
|
Melting |
Heat of fusion |
|
|
|
|
|
|
|
|
point |
|
|
|
|
|
|
|
Compound |
Formula |
˚C |
cal/g |
cal/g mole |
|
|
|
|
|
|
|
|
|
|
Lutetium |
Lu |
1651 |
26.3 |
4600 |
Magnesium |
Mg |
650 |
88.9 |
2160 |
Magnesium bromide |
MgBr2 |
711 |
45.0 |
8300 |
Magnesium chloride |
MgCl2 |
712 |
82.9 |
8100 |
Magnesium fluoride |
MgF2 |
1221 |
94.7 |
5900 |
Magnesium oxide |
MgO |
2642 |
459.0 |
18500 |
Magnesium silicate |
MgSiO3 |
1524 |
146.4 |
14700 |
Magnesium sulfate |
MgSO4 |
1327 |
28.9 |
3500 |
Manganese |
Mn |
1220 |
62.7 |
3450 |
Manganese dichloride |
MnCl2 |
650 |
58.4 |
7340 |
Manganese metasilicate |
MnSiO3 |
1274 |
(62.6) |
(8200) |
Manganese (II) oxide |
MnO |
1784 |
183.3 |
13000 |
Manganese oxide |
Mn3O4 |
1590 |
(170.4) |
(39000) |
Mercury |
Hg |
–39 |
2.7 |
557.2 |
Mercury bromide |
HgBr2 |
241 |
10.9 |
3960 |
Mercury chloride |
HgCl2 |
276.8 |
15.3 |
4150 |
Mercury iodide |
HgI2 |
250 |
9.9 |
4500 |
Mercury sulfate |
HgSO4 |
850 |
(4.8) |
(1440) |
Molybdenum |
Mo |
2622 |
(68.4) |
(6600) |
Molybdenum dichloride |
MoCl2 |
726.8 |
3.58 |
6000 |
|
|
|
|
|
For heat of fusion in J/kg, multiply values in cal/g by 4184.
For heat of fusion in J/mol, multiply values in cal/g-mol (=cal/mol) by 4.184. For melting point in K, add 273.15 to values in ˚C.
Values in parentheses are of uncertain reliability.
Source: data from Weast, R C., Ed., Handbook of Chemistry and Physics, 55th ed., CRC Press, Cleveland, (1974); and Bolz, R. E. and Tuve, G. L., Eds., Handbook of Tables for Applied Engineering Science, 2nd ed., CRC Press, Cleveland, (1973)
©2001 CRC Press LLC

Table 73. HEAT OF FUSION FOR ELEMENTS AND
INORGANIC COMPOUNDS (SHEET 9 OF 16)
|
|
Melting |
Heat of fusion |
|
|
|
|
|
|
|
|
point |
|
|
|
|
|
|
|
Compound |
Formula |
˚C |
cal/g |
cal/g mole |
|
|
|
|
|
|
|
|
|
|
Molybdenum hexafluoride |
MoF6 |
17 |
11.9 |
2500 |
Molybdenum trioxide |
MoO3 |
795 |
(17.3) |
(2500) |
Neodymium |
Nd |
1020 |
11.8 |
1700 |
Neon |
Ne |
– 248.6 |
3.83 |
77.4 |
Nickel |
Ni |
1452 |
71.5 |
4200 |
Nickel chloride |
NiCl2 |
1030 |
142 5 |
18470 |
Nickel subsulfide |
Ni3S2 |
790 |
25.8 1 |
5800 |
Niobium |
Nb |
2496 |
(68.9) |
(6500) |
Niobium pentachloride |
NbCl5 |
21.1 |
30 8 |
8400 |
Niobium pentoxide |
Nb2O5 |
1511 |
91.0 |
24200 |
Nitric oxide |
NO |
–163.7 |
18.3 |
549.5 |
Nitrogen |
N2 |
–210 |
6.15 |
172.3 |
Nitrogen tetroxide |
N2O4 |
–13.2 |
60.2 |
5540 |
Nitrous oxide |
N2O |
–90.9 |
35.5 |
1563 |
Osmium |
Os |
2700 |
(36.7) |
(7000) |
Osmium tetroxide (white) |
OsO4 |
41.8 |
9.2 |
2340 |
Osmium tetroxide (yellow) |
OsO4 |
55.8 |
15.5 |
4060 |
Oxygen |
O2 |
–218.8 |
3.3 |
106.3 |
Palladium |
Pd |
1555 |
38.6 |
4120 |
Phosphoric acid |
H3PO4 |
42.3 |
25.8 |
2520 |
|
|
|
|
|
For heat of fusion in J/kg, multiply values in cal/g by 4184.
For heat of fusion in J/mol, multiply values in cal/g-mol (=cal/mol) by 4.184. For melting point in K, add 273.15 to values in ˚C.
Values in parentheses are of uncertain reliability.
Source: data from Weast, R C., Ed., Handbook of Chemistry and Physics, 55th ed., CRC Press, Cleveland, (1974); and Bolz, R. E. and Tuve, G. L., Eds., Handbook of Tables for Applied Engineering Science, 2nd ed., CRC Press, Cleveland, (1973)
©2001 CRC Press LLC

Table 73. HEAT OF FUSION FOR ELEMENTS AND
INORGANIC COMPOUNDS (SHEET 10 OF 16)
|
|
Melting |
Heat of fusion |
|
|
|
|
|
|
|
|
point |
|
|
|
|
|
|
|
Compound |
Formula |
˚C |
cal/g |
cal/g mole |
|
|
|
|
|
|
|
|
|
|
Phosphoric acid. hypo– |
H4P2O6 |
54.8 |
51.2 |
8300 |
Phosphorus acid, hypo– |
H3PO2 |
17.3 |
35.0 |
2310 |
Phosphorus acid, ortho– |
H3PO3 |
73.8 |
37.4 |
3070 |
Phosphorus oxychloride |
POCl3 |
1.0 |
20.3 |
3110 |
Phosphorus pentoxide |
P4O10 |
569.0 |
60.1 |
17080 |
Phosphorus trioxide |
P4O6 |
23.7 |
15.3 |
3360 |
Phosphorus, yellow |
P4 |
44.1 |
4.8 |
600 |
Platinum |
Pt |
1770 |
24.1 |
4700 |
Potassium |
K |
63.4 |
14.6 |
574 |
Potassium borate, meta– |
KBO2 |
947 |
(69.1) |
(5660) |
Potassium bromide |
KBr |
742 |
42.0 |
5000 |
Potassium carbonate |
K2CO3 |
897 |
56.4 |
7800 |
Potassium chloride |
KCl |
770 |
85.9 |
6410 |
Potassium chromate |
K2CrO4 |
984 |
35.6 |
6920 |
Potassium cyanide |
KCN |
623 |
(53.7) |
(3500) |
Potassium dichromate |
K2Cr2O7 |
398 |
29.8 |
8770 |
Potassium fluoride |
KF |
875 |
111.9 |
6500 |
Potassium hydroxide |
KOH |
360 |
(35.3) |
(1980) |
Potassium iodide |
Kl |
682 |
24.7 |
4100 |
Potassium nitrate |
KNO3 |
338 |
78.1 |
2840 |
|
|
|
|
|
For heat of fusion in J/kg, multiply values in cal/g by 4184.
For heat of fusion in J/mol, multiply values in cal/g-mol (=cal/mol) by 4.184. For melting point in K, add 273.15 to values in ˚C.
Values in parentheses are of uncertain reliability.
Source: data from Weast, R C., Ed., Handbook of Chemistry and Physics, 55th ed., CRC Press, Cleveland, (1974); and Bolz, R. E. and Tuve, G. L., Eds., Handbook of Tables for Applied Engineering Science, 2nd ed., CRC Press, Cleveland, (1973)
©2001 CRC Press LLC

Table 73. HEAT OF FUSION FOR ELEMENTS AND
INORGANIC COMPOUNDS (SHEET 11 OF 16)
|
|
Melting |
Heat of fusion |
|
|
|
|
|
|
|
|
point |
|
|
|
|
|
|
|
Compound |
Formula |
˚C |
cal/g |
cal/g mole |
|
|
|
|
|
|
|
|
|
|
Potassium peroxide |
K2O2 |
490 |
55.3 |
6100 |
Potassium phosphate |
K3PO4 |
1340 |
41.9 |
8900 |
Potassium pyro– phosphate |
K4P2O7 |
1092 |
42.4 |
14000 |
Potassium sulfate |
K2SO4 |
1074 |
46.4 |
8100 |
Potassium thiocyanate |
KSCN |
179 |
23.1 |
2250 |
Praseodymium |
Pr |
931 |
19.0 |
2700 |
Rhenium |
Re |
3167±60 |
(42.4) |
(7900) |
Rhenium heptoxide |
Re2O7 |
296 |
30.1 |
15340 |
Rhenium hexafluoride |
ReF6 |
19.0 |
16.6 |
5000 |
Rubidium |
Rb |
38 .9 |
6. 1 |
525 |
Rubidium bromide |
RbBr |
677 |
22.4 |
3700 |
Rubidium chloride |
RbCl |
717 |
36.4 |
4400 |
Rubidium fluoride |
RbF |
833 |
39.5 |
4130 |
Rubidium iodide |
Rbl |
638 |
14.0 |
2990 |
Rubidium nitrate |
RbNO3 |
305 |
9.1 |
1340 |
Samarium |
Sm |
1072 |
17.3 |
2600 |
Scandium |
Sc |
1538 |
84.4 |
3800 |
Selenium |
Se |
217 |
15.4 |
1220 |
Seleniumoxychloride |
SeOCl3 |
9.8 |
6.1 |
1010 |
Silane, hexaHuoro– |
Si2F6 |
–28.6 |
22.9 |
3900 |
|
|
|
|
|
For heat of fusion in J/kg, multiply values in cal/g by 4184.
For heat of fusion in J/mol, multiply values in cal/g-mol (=cal/mol) by 4.184. For melting point in K, add 273.15 to values in ˚C.
Values in parentheses are of uncertain reliability.
Source: data from Weast, R C., Ed., Handbook of Chemistry and Physics, 55th ed., CRC Press, Cleveland, (1974); and Bolz, R. E. and Tuve, G. L., Eds., Handbook of Tables for Applied Engineering Science, 2nd ed., CRC Press, Cleveland, (1973)
©2001 CRC Press LLC

Table 73. HEAT OF FUSION FOR ELEMENTS AND
INORGANIC COMPOUNDS (SHEET 12 OF 16)
|
|
Melting |
Heat of fusion |
||
|
|
|
|
||
|
|
point |
|
|
|
|
|
|
|
||
Compound |
Formula |
˚C |
cal/g |
cal/g mole |
|
|
|
|
|
|
|
|
|
|
|
|
|
Silicon |
Si |
1427 |
337.0 |
9470 |
|
Silicon dioxide |
SiO2 |
1723 |
35.0 |
2100 |
|
(Cristobalite) |
|||||
|
|
|
|
||
Silicon tetrachloride |
SiCl4 |
–67.7 |
10.8 |
1845 |
|
Silver |
Ag |
961 |
25.0 |
2700 |
|
Silver bromide |
AgBr |
430 |
11.6 |
2180 |
|
Silver chloride |
AgCl |
455 |
22.0 |
3155 |
|
Silver cyanide |
AgCN |
350 |
20.5 |
2750 |
|
Silver iodide |
AgI |
557 |
9.5 |
2250 |
|
Silver nitrate |
AgNO3 |
209 |
16.2 |
2755 |
|
Silver sulfate |
Ag2SO4 |
657 |
(13.7) |
(4280) |
|
Silver sulfide |
Ag2S |
841 |
13.5 |
3360 |
|
Sodium |
Na |
97.8 |
27.4 |
630 |
|
Sodium borate, meta– |
NaBO2 |
966 |
134.6 |
8660 |
|
Sodium bromide |
NaBr |
747 |
59.7 |
6140 |
|
Sodium carbonate |
Na2CO3 |
854 |
66.0 |
7000 |
|
Sodium chlorate |
NaClO3 |
255 |
49.7 |
5290 |
|
Sodium chloride |
NaCl |
800 |
123.5 |
7220 |
|
Sodium cyanide |
NaCN |
562 |
(88.9) |
(4360) |
|
Sodium fluoride |
NaF |
992 |
166.7 |
7000 |
|
Sodium hydroxide |
NaOH |
322 |
50.0 |
2000 |
|
|
|
|
|
|
|
For heat of fusion in J/kg, multiply values in cal/g by 4184.
For heat of fusion in J/mol, multiply values in cal/g-mol (=cal/mol) by 4.184. For melting point in K, add 273.15 to values in ˚C.
Values in parentheses are of uncertain reliability.
Source: data from Weast, R C., Ed., Handbook of Chemistry and Physics, 55th ed., CRC Press, Cleveland, (1974); and Bolz, R. E. and Tuve, G. L., Eds., Handbook of Tables for Applied Engineering Science, 2nd ed., CRC Press, Cleveland, (1973)
©2001 CRC Press LLC

Table 73. HEAT OF FUSION FOR ELEMENTS AND
INORGANIC COMPOUNDS (SHEET 13 OF 16)
|
|
Melting |
Heat of fusion |
|
|
|
|
|
|
|
|
point |
|
|
|
|
|
|
|
Compound |
Formula |
˚C |
cal/g |
cal/g mole |
|
|
|
|
|
|
|
|
|
|
Sodium iodide |
NaI |
662 |
35.1 |
5340 |
Sodium molybdate |
Na2MoO4 |
687 |
17.5 |
3600 |
Sodium nitrate |
NaNO3 |
310 |
44.2 |
3760 |
Sodium peroxide |
Na2O2 |
460 |
75.1 |
5860 |
Sodium phosphate, meta– |
NaPO3 |
988 |
(48.6) |
(4960) |
Sodium pyrophosphate |
Na4P2O7 |
970 |
(51.5) |
(13700) |
Sodiumsilicate,aluminum– |
NaAlSi3O8 |
1107 |
50.1 |
13150 |
Sodium silicate, di– |
Na2Si2O5 |
884 |
46.4 |
8460 |
Sodium silicate, meta– |
Na2SiO3 |
1087 |
84.4 |
10300 |
Sodium sulfate |
Na2SO4 |
884 |
41.0 |
5830 |
Sodium sulfide |
Na2S |
920 |
15.4 |
(1200) |
Sodium thiocyanate |
NaSCN |
323 |
54.8 |
4450 |
Sodium tungstate |
Na2WO4 |
702 |
19.6 |
5800 |
Strontium |
Sr |
757 |
25.0 |
2190 |
Strontium bromide |
SrBr2 |
643 |
19.3 |
4780 |
Strontium chloride |
SrCl2 |
872 |
26.5 |
4100 |
Strontium fluoride |
SrF2 |
1400 |
34.0 |
4260 |
Strontium oxide |
SrO |
2430 |
161.2 |
16700 |
Sulfur (monatomic) |
S |
119 |
9.2 |
295 |
Sulfur dioxide |
SO2 |
–73.2 |
32.2 |
2060 |
|
|
|
|
|
For heat of fusion in J/kg, multiply values in cal/g by 4184.
For heat of fusion in J/mol, multiply values in cal/g-mol (=cal/mol) by 4.184. For melting point in K, add 273.15 to values in ˚C.
Values in parentheses are of uncertain reliability.
Source: data from Weast, R C., Ed., Handbook of Chemistry and Physics, 55th ed., CRC Press, Cleveland, (1974); and Bolz, R. E. and Tuve, G. L., Eds., Handbook of Tables for Applied Engineering Science, 2nd ed., CRC Press, Cleveland, (1973)
©2001 CRC Press LLC

Table 73. HEAT OF FUSION FOR ELEMENTS AND
INORGANIC COMPOUNDS (SHEET 14 OF 16)
|
|
Melting |
Heat of fusion |
|
|
|
|
|
|
|
|
point |
|
|
|
|
|
|
|
Compound |
Formula |
˚C |
cal/g |
cal/g mole |
|
|
|
|
|
|
|
|
|
|
Sulfur trioxide (α) |
SO3 |
16.8 |
25.8 |
2060 |
Sulfur trioxide (β) |
SO3 |
32.3 |
36.1 |
2890 |
Sulfur trioxide (γ) |
SO3 |
62.1 |
79.0 |
6310 |
Tantalum |
Ta |
2996 ± 50 |
34.6–41.5 |
(7500) |
Tantalum pentachloride |
TaCl5 |
206.8 |
25.1 |
9000 |
Tantalum pentoxide |
Ta2O5 |
1877 |
108.6 |
48000 |
Tellurium |
Te |
453 |
25.3 |
3230 |
Terbium |
Tb |
1356 |
24.6 |
3900 |
Thallium |
Tl |
302.4 |
5.0 |
1030 |
Thallium bromide, mono– |
TlBr |
460 |
21.0 |
5990 |
Thallium carbonate |
Tl2CO3 |
273 |
9.5 |
4400 |
Thallium chloride, mono– |
TICl |
427 |
17.7 |
4260 |
Thallium iodide, mono– |
TlI |
440 |
9.4 |
3125 |
Thallium nitrate |
TINO3 |
207 |
8.6 |
2290 |
Thallium sulfate |
Tl2SO4 |
632 |
10.9 |
5500 |
Thallium sulfide |
Tl2S |
449 |
6.8 |
3000 |
Thorium |
Th |
1845 |
(<19.8) |
(<4600) |
Thorium chloride |
ThCl4 |
765 |
61.6 |
22500 |
Thorium dioxide |
ThO2 |
2952 |
1102.0 |
291100 |
Thulium |
Tm |
1545 |
26.0 |
4400 |
|
|
|
|
|
For heat of fusion in J/kg, multiply values in cal/g by 4184.
For heat of fusion in J/mol, multiply values in cal/g-mol (=cal/mol) by 4.184. For melting point in K, add 273.15 to values in ˚C.
Values in parentheses are of uncertain reliability.
Source: data from Weast, R C., Ed., Handbook of Chemistry and Physics, 55th ed., CRC Press, Cleveland, (1974); and Bolz, R. E. and Tuve, G. L., Eds., Handbook of Tables for Applied Engineering Science, 2nd ed., CRC Press, Cleveland, (1973)
©2001 CRC Press LLC

Table 73. HEAT OF FUSION FOR ELEMENTS AND
INORGANIC COMPOUNDS (SHEET 15 OF 16)
|
|
Melting |
Heat of fusion |
|
|
|
|
|
|
|
|
point |
|
|
|
|
|
|
|
Compound |
Formula |
˚C |
cal/g |
cal/g mole |
|
|
|
|
|
|
|
|
|
|
Tin |
Sn |
231.7 |
14.4 |
1720 |
Tin bromide, di– |
SnBr2 |
231.8 |
(6.1) |
(1720) |
Tin bromide, tetra– |
SnBr4 |
29.8 |
6.8 |
3000 |
Tin chloride, di– |
SnCl2 |
247 |
16.0 |
3050 |
Tin chloride,tetra– |
SnCl4 |
–33.3 |
8.4 |
2190 |
Tin iodide, tetra– |
SnI4 |
143.4 |
(6.9) |
(4330) |
Tin oxide |
SnO |
1042 |
(46.8) |
(6400) |
Titanium |
Ti |
1800 |
(104.4) |
(5000) |
Titanium bromide, tetra– |
TiBr4 |
38 |
(5.6) |
(2060) |
Titanium chloride, tetra– |
TiCl4 |
–23.2 |
11.9 |
2240 |
Titanium dioxide |
TiO2 |
1825 |
(142.7) |
(11400) |
Titanium oxide |
TiO |
991 |
219 |
14000 |
Tungsten |
W |
3387 |
(45.8) |
(8420) |
Tungsten dioxide |
WO2 |
1270 |
60 1 |
13940 |
Tungsten hexafluoride |
WF6 |
–0.5 |
6.0 |
1800 |
Tungsten tetrachloride |
WCl4 |
327 |
18.4 |
6000 |
Tungsten trioxide |
WO3 |
1470 |
60 1 |
13940 |
Uranium235 |
U |
~1133 |
20 |
3700 |
Uranium tetrachloride |
UCl4 |
590 |
27.1 |
10300 |
Vanadium |
V |
1917 |
(70) |
(4200) |
|
|
|
|
|
For heat of fusion in J/kg, multiply values in cal/g by 4184.
For heat of fusion in J/mol, multiply values in cal/g-mol (=cal/mol) by 4.184. For melting point in K, add 273.15 to values in ˚C.
Values in parentheses are of uncertain reliability.
Source: data from Weast, R C., Ed., Handbook of Chemistry and Physics, 55th ed., CRC Press, Cleveland, (1974); and Bolz, R. E. and Tuve, G. L., Eds., Handbook of Tables for Applied Engineering Science, 2nd ed., CRC Press, Cleveland, (1973)
©2001 CRC Press LLC

Table 73. HEAT OF FUSION FOR ELEMENTS AND
INORGANIC COMPOUNDS (SHEET 16 OF 16)
|
|
Melting |
Heat of fusion |
|
|
|
|
|
|
|
|
point |
|
|
|
|
|
|
|
Compound |
Formula |
˚C |
cal/g |
cal/g mole |
|
|
|
|
|
|
|
|
|
|
Vanadium dichloride |
VCl2 |
1027 |
65.6 |
8000 |
Vanadium oxide |
VO |
2077 |
224.0 |
15000 |
Vanadium pentoxide |
V2O5 |
670 |
85.5 |
15560 |
Xenon |
Xe |
–111.6 |
5.6 |
740 |
Ytterbium |
Yb |
823 |
12.7 |
2200 |
Yttrium |
Y |
1504 |
46.1 |
4100 |
Yttrium oxide |
Y2O3 |
2227 |
110.7 |
25000 |
Zinc |
Zn |
419.4 |
24.4 |
1595 |
Zinc chloride |
ZnCl2 |
283 |
(406) |
(5540) |
Zinc oxide |
ZnO |
1975 |
54.9 |
4470 |
Zinc sulfide |
ZnS |
1745 |
(93.3) |
(9100) |
Zirconium |
Zr |
1857 |
(60) |
(5500) |
Zirconium dichloride |
ZrCl2 |
727 |
45.0 |
7300 |
Zirconium oxide |
ZrO2 |
2715 |
168.8 |
20800 |
|
|
|
|
|
For heat of fusion in J/kg, multiply values in cal/g by 4184.
For heat of fusion in J/mol, multiply values in cal/g-mol (=cal/mol) by 4.184. For melting point in K, add 273.15 to values in ˚C.
Values in parentheses are of uncertain reliability.
Source: data from Weast, R C., Ed., Handbook of Chemistry and Physics, 55th ed., CRC Press, Cleveland, (1974); and Bolz, R. E. and Tuve, G. L., Eds., Handbook of Tables for Applied Engineering Science, 2nd ed., CRC Press, Cleveland, (1973)
©2001 CRC Press LLC
Table 74. HEATS OF SUBLIMATION OF METALS
AND THEIR OXIDES
|
kcal/mole |
kJ/mole |
Metal |
(25˚C) |
(25˚C) |
|
|
|
|
|
|
Al |
78 |
326 |
Cu |
81 |
338 |
Fe |
100 |
416 |
Mg |
113 |
473 |
Metal Oxide |
|
|
FeO |
122 |
509 |
MgO |
145 |
605 |
α-TiO |
143 |
597 |
TiO2 (rutile) |
153 |
639 |
|
|
|
Data from: JANAF Thermochemical Tables, 2nd ed., National Standard Reference Data Series, Natl. Bur. Std. (U.S.), 37 (1971) and Supplement in J. Phys. Chem. Ref. Data 4(1), 1- 175 (1975).
©2001 CRC Press LLC
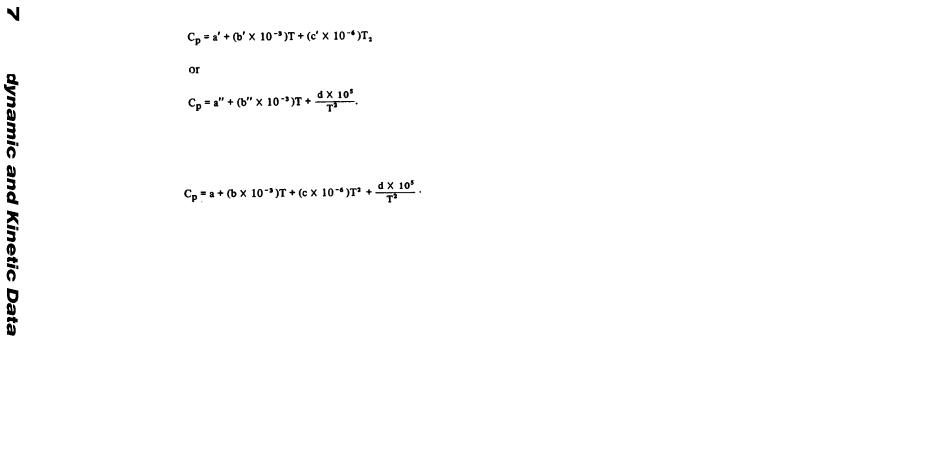
Table 75. KEY TO TABLES OF THERMODYNAMIC COEFFICIENTS
(SHEET 1 OF 4)
Thermodynamic calculations over a wide range of temperatures are generally made with the aid of algebraic equations representing the characteristic properties of the substances being considered. The necessary integrations and differentiations, or other mathematical manipulations, are then most easily effected. The most convenient starting point in making such calculations for a given substance is the heat capacity at constant pressure. From this quantity and a knowledge of the properties of any phase transitions, the other thermodynamic properties may be computed by the well-known equations given in standard texts on thermodynamics. Please note that the units for a, b, c, and d are cal/g mole, whereas those for A are kcal/g mole. The necessary adjustment must be made when the data are substituted into the equations. Empirical heat capacity equations are generated in the form of a power series, with the absolute temperature T as the independent variable:
Since both forms are used in the following, let
©2001 CRC Press LLC
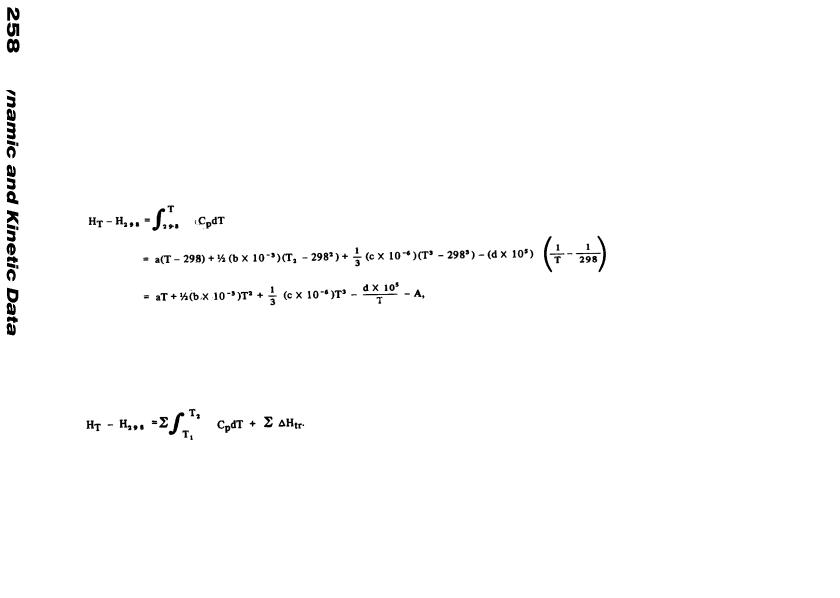
Table 75. KEY TO TABLES OF THERMODYNAMIC COEFFICIENTS
(SHEET 2 OF 4)
The constants a, b, c, and d are to be determined either experimentally or by some theoretical or semi-empirical approach. The heat content, or enthalpy (H), is determined from the heat capacity by a simple integration of the range of temperatures for which the formula for cp is valid. Thus, if 298K is taken as a reference temperature,
where all the constants on the right-hand side of the equation have been incorporated in the term –A.
In general, the enthalpy is given by a sum of terms for each phase of the substance involved in the temperature range considered plus terms that represent the heats of transitions:
In a similar manner, the entropy S is obtained by performing the integration
©2001 CRC Press LLC
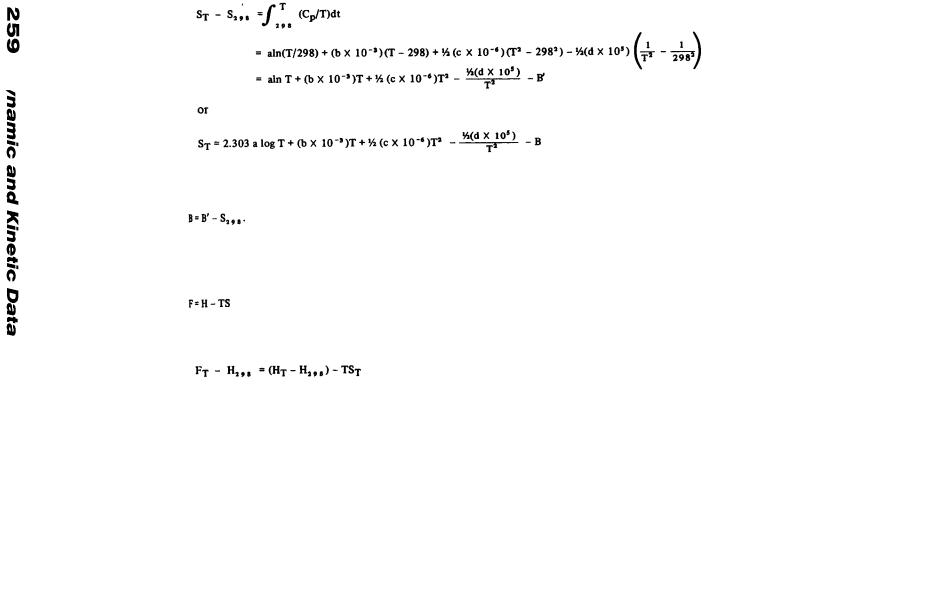
Table 75. KEY TO TABLES OF THERMODYNAMIC COEFFICIENTS
(SHEET 3 OF 4)
where
From the definition of free energy (F):
the quantity
©2001 CRC Press LLC
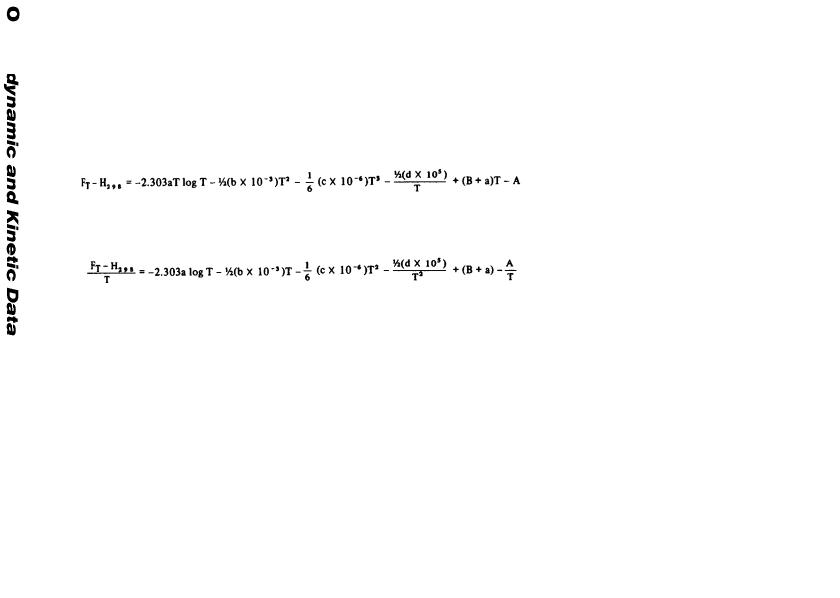
Table 75. KEY TO TABLES OF THERMODYNAMIC COEFFICIENTS
(SHEET 4 OF 4)
may be written as:
and also the free energy function
Values of these thermodynamic coefficients are given in the following tables. The first column in each table lists the material. The second column gives the phase to which the coefficients are applicable. The remaining columns list the values of the constants a, b, c, d, A, and B required in the thermodynamic equations. All values that represent estimates are enclosed in parentheses. The heat capacities at temperatures beyond the range of experimental determination were estimated by extrapolation. Where no experimental values were found, analogy with compounds of neighboring elements in the periodic table was used.
©2001 CRC Press LLC

Table 76. THERMODYNAMIC COEFFICIENTS FOR SELECTED ELEMENTS *
(SHEET 1 OF 14)
|
|
a |
b |
c |
d |
A |
B |
Element |
Phase |
– |
– |
(cal • g mole-1 ) |
– |
(kcal • g mole-1) |
(e.u.) |
|
|
|
|
|
|
|
|
|
|
|
|
|
|
|
|
Ac |
solid |
(5.4) |
(3.0) |
– |
– |
(1.743) |
(18.7) |
|
liquid |
(8) |
– |
– |
– |
(0.295) |
(31.3) |
Ag |
solid |
5.09 |
1.02 |
– |
0.36 |
1.488 |
19.21 |
|
liquid |
7.30 |
– |
– |
– |
0.164 |
30.12 |
|
gas |
(4.97) |
– |
– |
– |
(–66.34) |
(–12.52) |
Al |
solid |
4.94 |
2.96 |
– |
– |
1.604 |
22.26 |
|
liquid |
7.0 |
– |
– |
– |
0.33 |
30.83 |
Am |
solid |
(4.9) |
(4.4) |
– |
– |
(1.657) |
(16.2) |
|
liquid |
(8.5) |
– |
– |
– |
(0.409) |
(34.5) |
As |
solid |
5.17 |
2.34 |
– |
– |
1.646 |
21.8 |
Au |
solid |
6.14 |
–0.175 |
0.92 |
– |
1.831 |
23.65 |
|
liquid |
7.00 |
– |
– |
– |
–0.631 |
26.99 |
B |
solid |
1.54 |
4.40 |
– |
– |
0.655 |
8.67 |
|
liquid |
(6.0) |
– |
– |
– |
(–4.599) |
(31.4) |
|
|
|
|
|
|
|
|
Source: data from Weast, R. C. Ed., Handbook of Chemistry and Physics, 69th ed., CRC Press, Boca Raton, Fla., 1988, D44.
©2001 CRC Press LLC

Table 76. THERMODYNAMIC COEFFICIENTS FOR SELECTED ELEMENTS *
(SHEET 2 OF 14)
|
|
a |
b |
c |
d |
A |
B |
Element |
Phase |
– |
– |
(cal • g mole-1 ) |
– |
(kcal • g mole-1) |
(e.u.) |
|
|
|
|
|
|
|
|
|
|
|
|
|
|
|
|
Ba |
solid, α |
5.55 |
4.50 |
– |
– |
1.722 |
16.1 |
|
solid, β |
5.55 |
1.50 |
– |
– |
1.582 |
15.9 |
|
liquid |
(7.4) |
– |
– |
– |
(0.843) |
(25.3) |
|
gas |
(497) |
– |
– |
– |
(–39.65) |
(–11.7) |
Be |
solid |
5.07 |
1.21 |
– |
–1.15 |
1.951 |
27.62 |
|
liquid |
5.27 |
– |
– |
– |
–1.611 |
25.68 |
Bi |
solid |
5.38 |
2.60 |
– |
– |
1.720 |
17.8 |
|
liquid |
7.60 |
– |
– |
– |
–0.087 |
25.6 |
|
gas |
(4.97) |
– |
– |
– |
(–46.19) |
(–15.9) |
C |
solid |
4.10 |
1.02 |
– |
–2.10 |
1.972 |
23.484 |
Ca |
solid, α |
5.24 |
3.50 |
– |
– |
1.718 |
2095 |
|
solid, β |
6.29 |
1.40 |
– |
– |
1.689 |
26.01 |
|
liquid |
7.4 |
– |
– |
– |
–0.147 |
30.28 |
|
gas |
(4.97) |
– |
– |
– |
(–43.015) |
(–9.88) |
|
|
|
|
|
|
|
|
Source: data from Weast, R. C. Ed., Handbook of Chemistry and Physics, 69th ed., CRC Press, Boca Raton, Fla., 1988, D44.
©2001 CRC Press LLC

Table 76. THERMODYNAMIC COEFFICIENTS FOR SELECTED ELEMENTS *
(SHEET 3 OF 14)
|
|
a |
b |
c |
d |
A |
B |
Element |
Phase |
– |
– |
(cal • g mole-1 ) |
– |
(kcal • g mole-1) |
(e.u.) |
|
|
|
|
|
|
|
|
|
|
|
|
|
|
|
|
Cd |
solid |
5.31 |
2.94 |
– |
– |
1.714 |
18.8 |
|
liquid |
7.10 |
– |
– |
– |
0.798 |
26.1 |
|
gas |
(4.97) |
– |
– |
– |
(–25.28) |
(–11.7) |
Ce |
solid |
4.40 |
6.0 |
– |
– |
1.579 |
13.1 |
|
liquid |
(7.9) |
– |
– |
– |
(–0.148) |
(29.1) |
Cl2 |
gas |
8.76 |
0.27 |
– |
–0.65 |
2.845 |
–2.929 |
Co |
solid, α |
4.72 |
4.30 |
– |
– |
1.598 |
21.4 |
|
solid, β |
3.30 |
5.86 |
– |
– |
0.974 |
3.1 |
|
solid, γ |
9.60 |
– |
– |
– |
3.961 |
50.5 |
|
liquid |
8.30 |
– |
– |
– |
–2.034 |
38.7 |
Cr |
solid |
5.35 |
2.36 |
– |
–0.44 |
1.848 |
25.75 |
|
liquid |
9.40 |
– |
– |
– |
1.556 |
50.13 |
|
gas |
(4.97) |
– |
– |
– |
(–82.47) |
(–13.8) |
|
|
|
|
|
|
|
|
Source: data from Weast, R. C. Ed., Handbook of Chemistry and Physics, 69th ed., CRC Press, Boca Raton, Fla., 1988, D44.
©2001 CRC Press LLC

Table 76. THERMODYNAMIC COEFFICIENTS FOR SELECTED ELEMENTS *
(SHEET 4 OF 14)
|
|
a |
b |
c |
d |
A |
B |
Element |
Phase |
– |
– |
(cal • g mole-1 ) |
– |
(kcal • g mole-1) |
(e.u.) |
|
|
|
|
|
|
|
|
|
|
|
|
|
|
|
|
Cs |
solid |
7.42 |
– |
– |
– |
2.212 |
22.5 |
|
liquid |
8.00 |
– |
– |
– |
1.887 |
24.1 |
|
gas |
(4.97) |
– |
– |
– |
(–17.35) |
(–13.6) |
Cu |
solid |
5.41 |
1.50 |
– |
– |
1.680 |
23.30 |
|
liquid |
7.50 |
– |
– |
– |
0.024 |
34.05 |
F2 |
gas |
8.29 |
0.44 |
– |
–0.80 |
2.760 |
–0.76 |
Fe |
solid, α |
3.37 |
7.10 |
– |
0.43 |
1.176 |
14.59 |
|
solid, β |
10.40 |
– |
– |
– |
4.281 |
55.66 |
|
solid, γ |
4.85 |
3.00 |
– |
– |
0.396 |
19.76 |
|
solid, δ |
10.30 |
– |
– |
– |
4.382 |
55.11 |
|
liquid |
10.00 |
– |
– |
– |
–0.021 |
50.73 |
Ga |
solid |
5.237 |
3.33 |
– |
– |
1.710 |
21.01 |
|
liquid |
(6.645) |
– |
– |
– |
(0.648) |
(23.64) |
|
|
|
|
|
|
|
|
Source: data from Weast, R. C. Ed., Handbook of Chemistry and Physics, 69th ed., CRC Press, Boca Raton, Fla., 1988, D44.
©2001 CRC Press LLC

Table 76. THERMODYNAMIC COEFFICIENTS FOR SELECTED ELEMENTS *
(SHEET 5 OF 14)
|
|
a |
b |
c |
d |
A |
B |
Element |
Phase |
– |
– |
(cal • g mole-1 ) |
– |
(kcal • g mole-1) |
(e.u.) |
|
|
|
|
|
|
|
|
|
|
|
|
|
|
|
|
Ge |
solid |
5.90 |
1.13 |
– |
– |
1.764 |
23.8 |
|
liquid |
(7.3) |
– |
– |
– |
(–5.668) |
(25.7) |
H2 |
gas |
6.62 |
0.81 |
– |
– |
2.010 |
6.75 |
Hf |
solid |
(6.00) |
(0.52) |
– |
– |
(1.812) |
(21.2) |
Hg |
liquid |
6.61 |
– |
– |
– |
1.971 |
19.20 |
|
gas |
4.969 |
– |
– |
– |
–13.048 |
–13.54 |
In |
solid |
5.81 |
2.50 |
– |
– |
1.844 |
19.97 |
|
liquid |
7.50 |
– |
– |
– |
1.564 |
27.34 |
|
gas |
(4.97) |
– |
– |
– |
(–58.42) |
(–14.46) |
Ir |
solid |
5.56 |
1.42 |
– |
– |
1.721 |
23.4 |
K |
solid |
1.3264 |
19.405 |
– |
– |
1.258 |
–1.86 |
|
liquid |
8.8825 |
4.565 |
2.9369 |
– |
1.923 |
32.55 |
|
gas |
(4.97) |
– |
– |
– |
(–19.689) |
(–9.46) |
|
|
|
|
|
|
|
|
Source: data from Weast, R. C. Ed., Handbook of Chemistry and Physics, 69th ed., CRC Press, Boca Raton, Fla., 1988, D44.
©2001 CRC Press LLC
Table 76. THERMODYNAMIC COEFFICIENTS FOR SELECTED ELEMENTS *
(SHEET 6 OF 14)
|
|
a |
b |
c |
d |
A |
B |
Element |
Phase |
– |
– |
(cal • g mole-1 ) |
– |
(kcal • g mole-1) |
(e.u.) |
|
|
|
|
|
|
|
|
|
|
|
|
|
|
|
|
La |
solid |
6.17 |
1.60 |
– |
– |
1.911 |
21.9 |
|
liquid |
(7.3) |
– |
– |
– |
(–0.15) |
(26.0) |
Li |
solid |
3.05 |
8.60 |
– |
– |
1.292 |
12.92 |
|
liquid |
7.0 |
– |
– |
– |
1.509 |
32.00 |
|
gas |
(4.97) |
– |
– |
– |
(–34.30) |
(–2.84) |
Mg |
solid |
5.33 |
2.45 |
– |
–0.103 |
1.733 |
23.39 |
|
liquid |
(8.0) |
– |
– |
– |
0.942 |
36.967 |
|
gas |
(4.97) |
– |
– |
– |
(–34.78) |
(–7.60) |
Mn |
solid, α |
6.70 |
3.38 |
– |
–0.37 |
1.974 |
26.11 |
|
solid, β |
8.33 |
0.66 |
– |
– |
2.672 |
41.02 |
|
solid, γ |
10.70 |
– |
– |
– |
4.760 |
56.84 |
|
solid, δ |
11.30 |
– |
– |
– |
5.176 |
60.88 |
|
liquid |
11.00 |
– |
– |
– |
1.221 |
56.38 |
|
gas |
6.26 |
– |
|
|
–63.704 |
–3.13 |
Mo |
solid |
5.48 |
1.30 |
– |
– |
1.692 |
24.78 |
|
|
|
|
|
|
|
|
Source: data from Weast, R. C. Ed., Handbook of Chemistry and Physics, 69th ed., CRC Press, Boca Raton, Fla., 1988, D44.
©2001 CRC Press LLC

Table 76. THERMODYNAMIC COEFFICIENTS FOR SELECTED ELEMENTS *
(SHEET 7 OF 14)
|
|
a |
b |
c |
d |
A |
B |
Element |
Phase |
– |
– |
(cal • g mole-1 ) |
– |
(kcal • g mole-1) |
(e.u.) |
|
|
|
|
|
|
|
|
|
|
|
|
|
|
|
|
N2 |
gas |
6.76 |
0.606 |
0.13 |
– |
2.044 |
–7.064 |
Na |
solid |
5.657 |
3.252 |
0.5785 |
– |
1.836 |
20.92 |
|
liquid |
8.954 |
–4.577 |
2.540 |
– |
1.924 |
36.0 |
|
|
(4.97) |
– |
– |
– |
(–24.40) |
(–8.7) |
Nb |
solid |
5.66 |
0.96 |
– |
– |
1.730 |
24.24 |
Nd |
solid |
5.61 |
5.34 |
– |
– |
1.910 |
19.7 |
|
liquid |
(9.1) |
– |
– |
– |
(–0.606) |
35.8 |
Ni |
solid α |
4.06 |
7.04 |
– |
– |
1.523 |
18.095 |
|
solid β |
6.00 |
1.80 |
– |
– |
1.619 |
27.16 |
|
liquid |
9.20 |
– |
– |
– |
0.251 |
45.47 |
Np |
solid |
(5.3) |
(3.4) |
– |
– |
(1.731) |
(17.9) |
|
liquid |
(9.0) |
– |
– |
– |
(1.392) |
(37.5) |
O2 |
gas |
8.27 |
0.258 |
– |
–1.877 |
3.007 |
–0.750 |
|
|
|
|
|
|
|
|
Source: data from Weast, R. C. Ed., Handbook of Chemistry and Physics, 69th ed., CRC Press, Boca Raton, Fla., 1988, D44.
©2001 CRC Press LLC
Table 76. THERMODYNAMIC COEFFICIENTS FOR SELECTED ELEMENTS *
(SHEET 8 OF 14)
|
|
a |
b |
c |
d |
A |
B |
Element |
Phase |
– |
– |
(cal • g mole-1 ) |
– |
(kcal • g mole-1) |
(e.u.) |
|
|
|
|
|
|
|
|
|
|
|
|
|
|
|
|
Os |
solid |
5.69 |
0.88 |
– |
– |
1.736 |
24.9 |
P4 |
solid, white |
13.62 |
28.72 |
– |
– |
5.338 |
43.8 |
|
liquid |
19.23 |
0.51 |
– |
–2.98 |
6.035 |
66.7 |
|
gas |
(19.5) |
(–0.4) |
(1.3) |
– |
(–6.32) |
(46.1) |
Pa |
solid |
(5.2) |
(4.0) |
– |
– |
(1.728) |
(17.3) |
|
liquid |
(8.0) |
– |
– |
– |
(–3.823) |
(28.8) |
Pb |
solid |
5.64 |
2.30 |
– |
– |
1.784 |
17.33 |
|
liquid |
7.75 |
–0.73 |
– |
– |
1.362 |
27.11 |
|
gas |
(4.97) |
– |
– |
– |
(–45.25) |
(–13.6) |
Pd |
solid |
5.80 |
1.38 |
– |
– |
1.791 |
24.6 |
|
liquid |
(9.0) |
– |
– |
– |
(1.215) |
(43.8) |
Po |
solid |
(5.2) |
(3.2) |
– |
– |
(1.693) |
(17.6) |
|
liquid |
(9.0) |
– |
– |
– |
(0.847) |
(35.2) |
|
gas |
(4.97) |
– |
– |
– |
(–28.73) |
(–13.5) |
|
|
|
|
|
|
|
|
Source: data from Weast, R. C. Ed., Handbook of Chemistry and Physics, 69th ed., CRC Press, Boca Raton, Fla., 1988, D44.
©2001 CRC Press LLC

Table 76. THERMODYNAMIC COEFFICIENTS FOR SELECTED ELEMENTS *
(SHEET 9 OF 14)
|
|
a |
b |
c |
d |
A |
B |
Element |
Phase |
– |
– |
(cal • g mole-1 ) |
– |
(kcal • g mole-1) |
(e.u.) |
|
|
|
|
|
|
|
|
|
|
|
|
|
|
|
|
Pr |
solid |
(5.0) |
(4.6) |
– |
– |
(1.705) |
(16.4) |
|
liquid |
(8.0) |
– |
– |
– |
(–0.519) |
(30.0) |
Pt |
solid |
5.74 |
1.34 |
– |
0.10 |
1.737 |
23.0 |
|
liquid |
(9.0) |
– |
– |
– |
(0.406) |
(42.6) |
Pu |
solid |
(5.2) |
(3.6) |
– |
– |
(1.710) |
(17.7) |
|
liquid |
(8.0) |
– |
– |
– |
(0.506) |
(31.0) |
Ra |
solid |
(5.8) |
(1.2) |
– |
– |
(1.783) |
(16.4) |
|
liquid |
(8.0) |
– |
– |
– |
(1.284) |
(28.6) |
|
gas |
(4.97) |
– |
– |
– |
(–38.87) |
(–14.5) |
Rb |
solid |
3.27 |
13.1 |
– |
– |
1.557 |
5.9 |
|
liquid |
7.85 |
– |
– |
– |
1.814 |
26.5 |
|
gas |
(4.97) |
– |
– |
– |
(–19.04) |
(–12.3) |
Re |
solid |
(5.85) |
(0.8) |
– |
– |
(1.780) |
(24.7) |
|
|
|
|
|
|
|
|
Source: data from Weast, R. C. Ed., Handbook of Chemistry and Physics, 69th ed., CRC Press, Boca Raton, Fla., 1988, D44.
©2001 CRC Press LLC
Table 76. THERMODYNAMIC COEFFICIENTS FOR SELECTED ELEMENTS *
(SHEET 10 OF 14)
|
|
a |
b |
c |
d |
A |
B |
Element |
Phase |
– |
– |
(cal • g mole-1 ) |
– |
(kcal • g mole-1) |
(e.u.) |
|
|
|
|
|
|
|
|
|
|
|
|
|
|
|
|
Rh |
solid |
5.40 |
2.19 |
– |
– |
1.707 |
23.8 |
|
liquid |
(9.0) |
– |
– |
– |
(–0.923) |
(44.4) |
Ru |
solid, α |
5.25 |
1.50 |
– |
– |
1.632 |
23.5 |
|
solid, β |
7.20 |
– |
– |
– |
2.867 |
35.5 |
|
solid, γ |
7.20 |
– |
– |
– |
2.867 |
35.5 |
|
solid, δ |
7.50 |
– |
– |
– |
3.169 |
37.6 |
S |
solid, α |
3.58 |
6.24 |
– |
– |
1.345 |
14.64 |
|
solid, β |
3.56 |
6.95 |
– |
– |
1.298 |
14.54 |
|
liquid |
5.4 |
5.0 |
– |
– |
1.576 |
24.02 |
1/2 S2 |
gas |
(4.25) |
(0.15) |
– |
(–1.0) |
(–2.859) |
(9.57) |
Sb |
solid, α, β, γ |
5.51 |
1.74 |
– |
– |
1.720 |
21.4 |
|
liquid |
7.50 |
– |
– |
– |
1.992 |
28.1 |
1/2 Sb2 |
gas |
4.47 |
– |
– |
–0.11 |
–53.876 |
–21.7 |
|
|
|
|
|
|
|
|
Source: data from Weast, R. C. Ed., Handbook of Chemistry and Physics, 69th ed., CRC Press, Boca Raton, Fla., 1988, D44.
©2001 CRC Press LLC

Table 76. THERMODYNAMIC COEFFICIENTS FOR SELECTED ELEMENTS *
(SHEET 11 OF 14)
|
|
a |
b |
c |
d |
A |
B |
Element |
Phase |
– |
– |
(cal • g mole-1 ) |
– |
(kcal • g mole-1) |
(e.u.) |
|
|
|
|
|
|
|
|
|
|
|
|
|
|
|
|
Sc |
solid |
(5.13) |
(3.0) |
– |
– |
1.663 |
21.1 |
|
liquid |
(7.50) |
– |
|
|
(–2.563) |
31.3 |
Se |
solid |
3.30 |
8.80 |
– |
– |
1.375 |
11.28 |
|
liquid |
7.0 |
– |
– |
– |
0.881 |
27.34 |
Si |
solid |
5.70 |
1.02 |
– |
–1.06 |
2.100 |
28.88 |
|
liquid |
7.4 |
– |
|
|
7.646 |
33.17 |
Sm |
solid |
(6.7) |
(3.4) |
– |
– |
(2.149) |
(24.2) |
|
liquid |
(9.0) |
– |
– |
– |
(–2.296) |
(33.4) |
Sn |
solid, α, β |
4.42 |
6.30 |
– |
– |
1.598 |
14.8 |
|
liquid |
7.30 |
– |
– |
– |
0.559 |
26.2 |
|
gas |
(4.97) |
– |
– |
– |
60.21) |
(–14.3) |
Sr |
solid |
(5.60) |
(1.37) |
– |
– |
(1.731) |
(19.3) |
|
liquid |
(7.7) |
– |
– |
– |
(0.976) |
(30.4) |
|
gas |
(4.97) |
– |
– |
– |
(37.16) |
(–10.2) |
|
|
|
|
|
|
|
|
Source: data from Weast, R. C. Ed., Handbook of Chemistry and Physics, 69th ed., CRC Press, Boca Raton, Fla., 1988, D44.
©2001 CRC Press LLC

Table 76. THERMODYNAMIC COEFFICIENTS FOR SELECTED ELEMENTS *
(SHEET 12 OF 14)
|
|
|
|
a |
b |
c |
d |
A |
B |
Element |
Phase |
– |
– |
(cal • g mole-1 ) |
– |
(kcal • g mole-1) |
(e.u.) |
||
|
|
|
|
|
|
|
|
|
|
|
|
|
|
|
|
|
|
|
|
Ta |
|
solid |
5.82 |
0.78 |
– |
– |
1.770 |
23.4 |
|
Tc |
|
solid |
(5.6) |
(2.0) |
– |
– |
(1.759) |
(24.5) |
|
|
|
|
liquid |
– |
– |
– |
– |
(3.459) |
(59.4) |
Te |
|
solid, α |
4.58 |
5.25 |
– |
– |
1.599 |
15.78 |
|
|
|
|
solid, β |
4.58 |
5.25 |
– |
– |
1.469 |
15.57 |
|
|
|
liquid |
9.0 |
– |
– |
– |
–0.988 |
34.96 |
1/ |
Te |
2 |
gas |
4.47 |
– |
– |
–0.10 |
–19.048 |
–6.47 |
2 |
|
|
|
|
|
|
|
|
|
Th |
|
solid |
8.2 |
–0.77 |
2.04 |
– |
2.591 |
33.64 |
|
|
|
|
liquid |
(8.0) |
– |
– |
– |
(–7.602) |
(26.84) |
Ti |
|
solid, α |
5.25 |
2.52 |
– |
– |
1.677 |
23.33 |
|
|
|
|
solid, β |
7.50 |
– |
– |
– |
1.645 |
35.46 |
|
|
|
liquid |
(7.8) |
– |
– |
– |
(–2.355) |
(35.45) |
|
|
|
|
|
|
|
|
|
|
Source: data from Weast, R. C. Ed., Handbook of Chemistry and Physics, 69th ed., CRC Press, Boca Raton, Fla., 1988, D44.
©2001 CRC Press LLC

Table 76. THERMODYNAMIC COEFFICIENTS FOR SELECTED ELEMENTS *
(SHEET 13 OF 14)
|
|
a |
b |
c |
d |
A |
B |
Element |
Phase |
– |
– |
(cal • g mole-1 ) |
– |
(kcal • g mole-1) |
(e.u.) |
|
|
|
|
|
|
|
|
|
|
|
|
|
|
|
|
Tl |
solid, α |
5.26 |
3.46 |
– |
– |
1.722 |
15.6 |
|
solid, β |
7.30 |
– |
– |
– |
2.230 |
26.4 |
|
liquid |
7.50 |
– |
– |
– |
1.315 |
25.9 |
|
gas |
(4.97) |
– |
– |
– |
(–41.88) |
(–15.4) |
U |
solid, α |
3.25 |
8.15 |
– |
0.80 |
1.063 |
8.47 |
|
solid, β |
10.28 |
– |
– |
– |
3.493 |
48.27 |
|
solid, γ |
9.12 |
– |
– |
– |
1.110 |
39.09 |
|
liquid |
(8.99) |
– |
– |
– |
(–2.073) |
36.01 |
V |
solid |
5.57 |
0.97 |
– |
– |
1.704 |
24.97 |
|
liquid |
(8.6) |
– |
– |
– |
1.827 |
44.06 |
W |
solid |
5.74 |
0.76 |
– |
– |
1.745 |
24.9 |
Y |
solid |
(5.6) |
(2.2) |
– |
– |
(1.767) |
(21.6) |
|
liquid |
(7.5) |
– |
– |
– |
2.277) |
(29.6) |
|
|
|
|
|
|
|
|
Source: data from Weast, R. C. Ed., Handbook of Chemistry and Physics, 69th ed., CRC Press, Boca Raton, Fla., 1988, D44.
©2001 CRC Press LLC

Table 76. THERMODYNAMIC COEFFICIENTS FOR SELECTED ELEMENTS *
(SHEET 14 OF 14)
|
|
a |
b |
c |
d |
A |
B |
Element |
Phase |
– |
– |
(cal • g mole-1 ) |
– |
(kcal • g mole-1) |
(e.u.) |
|
|
|
|
|
|
|
|
|
|
|
|
|
|
|
|
Zn |
solid |
5.35 |
2.40 |
– |
– |
1.702 |
21.25 |
|
liquid |
7.50 |
– |
– |
– |
1.020 |
31.35 |
|
|
(4.97) |
– |
– |
– |
(–29.407) |
(–9.81) |
Zr |
solid, α |
6.83 |
1.12 |
– |
–0.87 |
2.378 |
30.45 |
|
solid, β |
7.27 |
– |
– |
– |
1.159 |
31.43 |
|
liquid |
(8.0) |
– |
– |
– |
(–2.190) |
(34.7) |
|
|
|
|
|
|
|
|
Source: data from Weast, R. C. Ed., Handbook of Chemistry and Physics, 69th ed., CRC Press, Boca Raton, Fla., 1988, D44.
*Please refer to Table 75, ”Key to Tables of Thermodynamic Coefficients” on page 257 for an explanation of the coefficients.
©2001 CRC Press LLC

Table 77. THERMODYNAMIC COEFFICIENTS FOR OXIDES
(SHEET 1 OF 23)
|
|
a |
b |
c |
d |
A |
B |
Oxide |
Phase |
– |
(cal • g mole-1 ) |
– |
– |
(kcal • g mole-1) |
(e.u.) |
|
|
|
|
|
|
|
|
|
|
|
|
|
|
|
|
Ac2O3 |
Solid |
(20.0) |
(20.4) |
– |
– |
(6.870) |
(80.9) |
|
Liquid |
(40) |
– |
– |
– |
(–19.767) |
(180.5) |
Ag2O |
Solid |
13.26 |
7.04 |
– |
– |
4.266 |
48.56 |
Ag2O2 |
Solid |
(16.4) |
(12.2) |
– |
– |
(5.432) |
(76.7) |
Al2O3 |
Solid |
26.12 |
4.388 |
– |
–7.269 |
10.422 |
142.03 |
|
Liquid |
(33) |
– |
– |
– |
(– 11.655) |
(174.1) |
Am2O3 |
Solid |
(20.0) |
(15.6) |
– |
– |
(6.657) |
(81.6) |
|
Liquid |
(38.5) |
– |
– |
– |
(–7.796) |
(181.8) |
AmO2 |
Solid |
(14.0) |
(6.8) |
– |
– |
(4.477) |
(61.8) |
|
|
|
|
|
|
|
|
For discussion of these coefficients, please see Table 75, Key to Tables of Thermodynamic Coefficients on page 257
Source: data from Weast, R. C., Ed., Handbook of Chemistry and Physics, 55th ed., CRC Press, Cleveland, 1974, D-58.
©2001 CRC Press LLC
Table 77. THERMODYNAMIC COEFFICIENTS FOR OXIDES
(SHEET 2 OF 23)
|
|
a |
b |
c |
d |
A |
B |
Oxide |
Phase |
– |
(cal • g mole-1 ) |
– |
– |
(kcal • g mole-1) |
(e.u.) |
|
|
|
|
|
|
|
|
|
|
|
|
|
|
|
|
As2O3 |
Solid, α |
8.37 |
48.6 |
– |
– |
4.656 |
36.6 |
|
Solid, β |
8.37 |
48.6 |
– |
– |
0.556 |
28.4 |
|
Liquid |
(39) |
– |
– |
– |
(5.760) |
(187.6) |
|
Gas |
(21.5) |
– |
– |
– |
(–14.164) |
(62.5) |
AsO2 |
Solid |
(8.5) |
(9.4) |
– |
– |
(2.952) |
(38.2) |
|
Liquid |
(21) |
– |
– |
– |
(2.184) |
(108.0) |
As2O5 |
Solid |
(31.1) |
(16.4) |
– |
(–5.4) |
(11.813) |
(159.9) |
Au2O3 |
Solid |
(23.5) |
(4.8) |
– |
– |
(7.220) |
(105.3) |
B2O3 |
Solid |
8.73 |
25.40 |
– |
–1.31 |
4.171 |
45.04 |
|
Liquid |
30.50 |
– |
– |
– |
7.822 |
161.59 |
Ba2O |
Solid |
(20.0) |
(2.2) |
– |
– |
(6.061) |
(91.1) |
|
Liquid |
(22) |
– |
– |
– |
(1.769) |
(96.8) |
|
Gas |
(15) |
– |
– |
– |
(–25.51) |
(29.0) |
|
|
|
|
|
|
|
|
For discussion of these coefficients, please see Table 75, Key to Tables of Thermodynamic Coefficients on page 257
Source: data from Weast, R. C., Ed., Handbook of Chemistry and Physics, 55th ed., CRC Press, Cleveland, 1974, D-58.
©2001 CRC Press LLC

Table 77. THERMODYNAMIC COEFFICIENTS FOR OXIDES
(SHEET 3 OF 23)
|
|
a |
b |
c |
d |
A |
B |
Oxide |
Phase |
– |
(cal • g mole-1 ) |
– |
– |
(kcal • g mole-1) |
(e.u.) |
|
|
|
|
|
|
|
|
|
|
|
|
|
|
|
|
BaO |
Solid |
12.74 |
1.040 |
– |
–1.984 |
4.510 |
57.2 |
|
Liquid |
(13.9) |
– |
– |
– |
(–9.341) |
(57.5) |
BaO2 |
Solid |
(13.6) |
(2.0) |
– |
– |
(4.144) |
(59.6) |
|
Liquid |
(21) |
– |
– |
– |
(3.241) |
(99.0) |
BeO |
Solid |
8.69 |
3.65 |
– |
–3.13 |
3.803 |
48.99 |
BiO |
Solid |
(9.7) |
(3.0) |
– |
– |
(3.025) |
(41.2) |
|
Liquid |
(14) |
– |
– |
– |
(2.306) |
(64.9) |
|
Gas |
(8.9) |
– |
– |
– |
(–61.49) |
(–1.8) |
Bi2O3 |
Solid |
23.27 |
11.05 |
– |
– |
7.429 |
99.7 |
|
Liquid |
(35.7) |
– |
– |
– |
(7.614) |
(168.3) |
CO |
Gas |
6.60 |
1.2 |
– |
– |
2.021 |
–9.34 |
CO2 |
Gas |
7.70 |
5.3 |
–0.83 |
– |
2.490 |
–5.64 |
CaO |
Solid |
10.00 |
4.84 |
– |
–1.08 |
3.559 |
49.5 |
|
|
|
|
|
|
|
|
For discussion of these coefficients, please see Table 75, Key to Tables of Thermodynamic Coefficients on page 257
Source: data from Weast, R. C., Ed., Handbook of Chemistry and Physics, 55th ed., CRC Press, Cleveland, 1974, D-58.
©2001 CRC Press LLC
Table 77. THERMODYNAMIC COEFFICIENTS FOR OXIDES
(SHEET 4 OF 23)
|
|
a |
b |
c |
d |
A |
B |
Oxide |
Phase |
– |
(cal • g mole-1 ) |
– |
– |
(kcal • g mole-1) |
(e.u.) |
|
|
|
|
|
|
|
|
|
|
|
|
|
|
|
|
CdO |
Solid |
9.65 |
2.08 |
– |
– |
2.970 |
42.5 |
Ce2O3 |
Solid |
(–23.0) |
(9.0) |
– |
– |
(7.258) |
(100.2) |
|
Liquid |
(37) |
– |
– |
– |
(–2.591) |
(178.5) |
CeO2 |
Solid |
15.0 |
2.5 |
– |
– |
4.579 |
68.5 |
CoO |
Solid |
(9.8) |
(2.2) |
– |
– |
(3.020) |
(46.0) |
|
Liquid |
(15.5) |
– |
– |
– |
(–1.886) |
(79.2) |
Co3O4 |
Solid |
(29.5) |
(17.0) |
– |
– |
(9.551) |
(137.6) |
Cr2O3 |
Solid |
28.53 |
2.20 |
– |
–3.736 |
9.857 |
145.9 |
CrO2 |
Solid |
(16.1) |
(3.0) |
– |
(–3.0) |
(5.946) |
(82.8) |
CrO3 |
Solid |
(18.1) |
(4.0) |
– |
(–2.0) |
(6.245) |
(87.9) |
|
Liquid |
(27) |
– |
– |
– |
(3.381) |
(127.0) |
|
Gas |
(20) |
– |
– |
– |
(–28.62) |
(53.6) |
|
|
|
|
|
|
|
|
For discussion of these coefficients, please see Table 75, Key to Tables of Thermodynamic Coefficients on page 257
Source: data from Weast, R. C., Ed., Handbook of Chemistry and Physics, 55th ed., CRC Press, Cleveland, 1974, D-58.
©2001 CRC Press LLC

Table 77. THERMODYNAMIC COEFFICIENTS FOR OXIDES
(SHEET 5 OF 23)
|
|
a |
b |
c |
d |
A |
B |
Oxide |
Phase |
– |
(cal • g mole-1 ) |
– |
– |
(kcal • g mole-1) |
(e.u.) |
|
|
|
|
|
|
|
|
|
|
|
|
|
|
|
|
Cs2O |
Solid |
(16.51) |
(5.4) |
– |
– |
(5.160) |
(72.6) |
|
Liquid |
(22) |
– |
– |
– |
(3.205) |
(99.0) |
Cs2O2 |
Solid |
(21.4) |
(11.4) |
– |
– |
(6.887) |
(85.3) |
|
Liquid |
(29.5) |
– |
– |
– |
(4.125) |
(123.8) |
Cs2O3 |
Solid |
(24.0) |
(22.6) |
– |
– |
(8.160) |
(96.5) |
|
Liquid |
(35) |
– |
– |
– |
(2.148) |
(142.2) |
Cu2O |
Solid |
(13.4) |
(8.6) |
– |
– |
(4.378) |
(96.0) |
|
Liquid |
(21.5) |
– |
– |
– |
(3.721) |
(54.9) |
CuO |
Solid |
14.34 |
6.2 |
– |
– |
4.551 |
61.11 |
|
Liquid |
(22) |
– |
– |
– |
(–4.339) |
(98.91) |
FeO |
Solid |
9.27 |
4.80 |
– |
– |
(2.977) |
(43.8) |
|
Liquid |
(14.5) |
– |
– |
– |
(–3.721) |
(69.2) |
Fe3O4 |
Solid, α |
12.38 |
1.62 |
– |
–0.38 |
3.826 |
58.3 |
|
Solid, β |
(14.5) |
– |
– |
– |
(–2.399) |
(66.7) |
|
|
|
|
|
|
|
|
For discussion of these coefficients, please see Table 75, Key to Tables of Thermodynamic Coefficients on page 257
Source: data from Weast, R. C., Ed., Handbook of Chemistry and Physics, 55th ed., CRC Press, Cleveland, 1974, D-58.
©2001 CRC Press LLC

Table 77. THERMODYNAMIC COEFFICIENTS FOR OXIDES
(SHEET 6 OF 23)
|
|
a |
b |
c |
d |
A |
B |
Oxide |
Phase |
– |
(cal • g mole-1 ) |
– |
– |
(kcal • g mole-1) |
(e.u.) |
|
|
|
|
|
|
|
|
|
|
|
|
|
|
|
|
Fe2O3 |
Solid, α |
|
|
|
|
|
|
|
Solid, β |
21.88 |
48.20 |
– |
– |
8.666 |
104.0 |
|
Solid, γ |
48.00 |
18.6 |
– |
– |
12.652 |
238.3 |
Ga2O |
Solid |
23.49 |
18.6 |
– |
–3.55 |
9.021 |
119.9 |
|
Liquid |
36.00 |
– |
– |
– |
11.979 |
187.6 |
|
Gas |
31.71 |
1.8 |
– |
– |
8.467 |
159.7 |
Ga2O3 |
Solid |
(13.8) |
– |
– |
– |
(4.497) |
(58.7) |
|
Liquid |
(21.5) |
– |
– |
– |
(–0.559) |
(94.1) |
GeO |
Solid |
(14) |
– |
– |
– |
(–28.06) |
(22.3) |
|
Gas |
11.77 |
25.2 |
– |
– |
(4.630) |
(54.35) |
GeO2 |
Solid (α,β) |
(35.5) |
– |
– |
– |
(–20.66) |
(173.2) |
|
Liquid |
(10.4) |
(2.6) |
– |
(–0.5) |
(3.3) |
(47.8) |
|
|
|
|
|
|
|
|
For discussion of these coefficients, please see Table 75, Key to Tables of Thermodynamic Coefficients on page 257
Source: data from Weast, R. C., Ed., Handbook of Chemistry and Physics, 55th ed., CRC Press, Cleveland, 1974, D-58.
©2001 CRC Press LLC

Table 77. THERMODYNAMIC COEFFICIENTS FOR OXIDES
(SHEET 7 OF 23)
|
|
a |
b |
c |
d |
A |
B |
Oxide |
Phase |
– |
(cal • g mole-1 ) |
– |
– |
(kcal • g mole-1) |
(e.u.) |
|
|
|
|
|
|
|
|
|
|
|
|
|
|
|
|
In2O |
Solid |
(14.7) |
(7.8) |
– |
– |
(4.730) |
(58.1) |
|
Liquid |
(22) |
– |
– |
– |
(3.206) |
(92.6) |
|
Gas |
(15) |
– |
– |
– |
(–18.39) |
(25.8) |
InO |
Solid |
(10.0) |
(3.2) |
– |
– |
(3.124) |
(43.4) |
|
Liquid |
(14) |
– |
– |
– |
(1.615) |
(64.9) |
|
Gas |
(9.0) |
– |
– |
– |
(–68.38) |
(–3.1) |
In2O3 |
Solid |
(22.6) |
(6.0) |
– |
– |
(7.005) |
(100.5) |
|
Liquid |
(35) |
– |
– |
– |
(–0.195) |
(172.8) |
Ir2O3 |
Solid |
(21.8) |
(14.4) |
– |
– |
(7.140) |
(102.0) |
|
Liquid |
(35) |
– |
– |
– |
(0.706) |
(170.3) |
|
Gas |
(20) |
(10) |
– |
– |
(–57.73) |
(54.8) |
IrO2 |
Solid |
9.17 |
15.20 |
– |
– |
3.410 |
40.9 |
K2O |
Solid |
(15.9) |
(6.4) |
– |
– |
(5.025) |
(69.5) |
|
Liquid |
(22) |
– |
– |
– |
(1.130) |
(98.3) |
|
|
|
|
|
|
|
|
For discussion of these coefficients, please see Table 75, Key to Tables of Thermodynamic Coefficients on page 257
Source: data from Weast, R. C., Ed., Handbook of Chemistry and Physics, 55th ed., CRC Press, Cleveland, 1974, D-58.
©2001 CRC Press LLC

Table 77. THERMODYNAMIC COEFFICIENTS FOR OXIDES
(SHEET 8 OF 23)
|
|
a |
b |
c |
d |
A |
B |
Oxide |
Phase |
– |
(cal • g mole-1 ) |
– |
– |
(kcal • g mole-1) |
(e.u.) |
|
|
|
|
|
|
|
|
|
|
|
|
|
|
|
|
K2O2 |
Solid |
(20.8) |
(5.4) |
– |
– |
(6.442) |
(93.1) |
|
Liquid |
(29) |
– |
– |
– |
(4.127) |
(134.2) |
|
Gas |
(20) |
– |
– |
– |
(–57.07) |
(41.7) |
K2O3 |
Solid |
(19.1) |
(23.2) |
– |
– |
(6.750) |
(82.2) |
|
Liquid |
(35.5) |
– |
– |
– |
(6.447) |
(164.7) |
|
Gas |
(20) |
(5.0) |
– |
– |
(–31.29) |
(37.3) |
KO2 |
Solid |
(15.0) |
(12.0) |
– |
– |
(5.006) |
(61.1) |
|
Liquid |
(24) |
– |
– |
– |
(3.424) |
(105.5) |
La2O3 |
Solid |
28.86 |
3.076 |
– |
–3.275 |
9.840 |
(130.7) |
Li2O |
Solid |
(11.4) |
(5.4) |
– |
– |
(3.639) |
(57.5) |
|
Liquid |
(21) |
– |
– |
– |
(–1.961) |
(112.7) |
Li2O2 |
Solid |
(17.0) |
(5.4) |
– |
– |
(5.309) |
(82.0) |
|
|
|
|
|
|
|
|
For discussion of these coefficients, please see Table 75, Key to Tables of Thermodynamic Coefficients on page 257
Source: data from Weast, R. C., Ed., Handbook of Chemistry and Physics, 55th ed., CRC Press, Cleveland, 1974, D-58.
©2001 CRC Press LLC

Table 77. THERMODYNAMIC COEFFICIENTS FOR OXIDES
(SHEET 9 OF 23)
|
|
a |
b |
c |
d |
A |
B |
Oxide |
Phase |
– |
(cal • g mole-1 ) |
– |
– |
(kcal • g mole-1) |
(e.u.) |
|
|
|
|
|
|
|
|
|
|
|
|
|
|
|
|
MgO |
Solid |
10.86 |
1.197 |
– |
–2.087 |
3.991 |
57.0 |
MgO2 |
Solid |
(12.1) |
(2A) |
– |
– |
(3.714) |
(49.2) |
MnO |
Solid |
11.11 |
1.94 |
– |
–0.88 |
3.689 |
50.10 |
|
Liquid |
(13.5) |
– |
– |
– |
(–8.543) |
(58.02) |
Mn3O4 |
Solid, α |
34.64 |
10.82 |
– |
–2.20 |
11.312 |
166.3 |
|
Solid, β |
50.20 |
– |
– |
– |
17.376 |
260.4 |
|
Liquid |
(49) |
– |
– |
– |
(–17.86) |
(233.4) |
Mn2O3 |
Solid |
24.73 |
8.38 |
– |
–3.23 |
8.829 |
118.8 |
MnO2 |
Solid |
16.60 |
2.44 |
– |
–3.88 |
6.359 |
84.8 |
MoO2 |
Solid |
(16.2) |
(3.0) |
– |
(–3.0) |
(5.973) |
(80.4) |
|
Liquid |
(23) |
– |
– |
– |
(–2.463) |
(118.4) |
|
|
|
|
|
|
|
|
For discussion of these coefficients, please see Table 75, Key to Tables of Thermodynamic Coefficients on page 257
Source: data from Weast, R. C., Ed., Handbook of Chemistry and Physics, 55th ed., CRC Press, Cleveland, 1974, D-58.
©2001 CRC Press LLC

Table 77. THERMODYNAMIC COEFFICIENTS FOR OXIDES
(SHEET 10 OF 23)
|
|
a |
b |
c |
d |
A |
B |
Oxide |
Phase |
– |
(cal • g mole-1 ) |
– |
– |
(kcal • g mole-1) |
(e.u.) |
|
|
|
|
|
|
|
|
|
|
|
|
|
|
|
|
MoO3 |
Solid |
13.6 |
13.5 |
– |
– |
4.655 |
62.83 |
|
Liquid |
(28.4) |
– |
– |
– |
(0.222) |
(139.88) |
|
Gas |
(18.1) |
– |
– |
– |
(–48.54) |
(42.8) |
N2O |
Gas |
(10.92) |
2.06 |
– |
–2.04 |
4.032 |
11.40 |
Na2O |
Solid |
15.70 |
5.40 |
– |
– |
4.921 |
73.7 |
|
Liquid |
(22) |
– |
– |
– |
(1.494) |
(105.9) |
Na2O2 |
Solid |
(20.2) |
(3.8) |
– |
– |
(6.192) |
(93.6) |
NaO2 |
Solid |
(16.2) |
(3.6) |
– |
– |
(4.990) |
(65.7) |
|
Liquid |
(23) |
– |
– |
– |
(3.175) |
(100.9) |
|
Gas |
(15) |
– |
– |
– |
(–35.22) |
(22.0) |
NbO |
Solid |
(9.6) |
(4.4) |
– |
– |
(3.058) |
(44.0) |
|
|
|
|
|
|
|
|
For discussion of these coefficients, please see Table 75, Key to Tables of Thermodynamic Coefficients on page 257
Source: data from Weast, R. C., Ed., Handbook of Chemistry and Physics, 55th ed., CRC Press, Cleveland, 1974, D-58.
©2001 CRC Press LLC

Table 77. THERMODYNAMIC COEFFICIENTS FOR OXIDES
(SHEET 11 OF 23)
|
|
a |
b |
c |
d |
A |
B |
Oxide |
Phase |
– |
(cal • g mole-1 ) |
– |
– |
(kcal • g mole-1) |
(e.u.) |
|
|
|
|
|
|
|
|
|
|
|
|
|
|
|
|
NbO2 |
Solid |
(17.1) |
(1.6) |
– |
(–2.8) |
(6.109) |
(84.6) |
|
Liquid |
(24) |
– |
– |
– |
(1.033) |
(127.2) |
Nb2O5 |
Solid |
21.88 |
28.2 |
– |
– |
7.776 |
100.3 |
|
Liquid |
(44.2) |
– |
– |
– |
(–24.09) |
(201.6) |
Nd2O3 |
Solid |
28.99 |
5.760 |
– |
(–4.159) |
10.295 |
(133.9) |
NiO |
Solid |
13.69 |
0.83 |
– |
–2.915 |
5.097 |
70.67 |
|
Liquid |
(14.3) |
– |
– |
– |
(–7.861) |
(67.91) |
NpO2 |
Solid |
(17.7) |
(3.2) |
– |
(–2.6) |
(6.292) |
(84.08) |
Np2O5 |
Solid |
(32.4) |
(12.6) |
– |
– |
(10.22) |
(145.4) |
OsO2 |
Solid |
(11.5) |
(6.0) |
– |
– |
(3.696) |
(52.8) |
|
|
|
|
|
|
|
|
For discussion of these coefficients, please see Table 75, Key to Tables of Thermodynamic Coefficients on page 257
Source: data from Weast, R. C., Ed., Handbook of Chemistry and Physics, 55th ed., CRC Press, Cleveland, 1974, D-58.
©2001 CRC Press LLC
Table 77. THERMODYNAMIC COEFFICIENTS FOR OXIDES
(SHEET 12 OF 23)
|
|
a |
b |
c |
d |
A |
B |
Oxide |
Phase |
– |
(cal • g mole-1 ) |
– |
– |
(kcal • g mole-1) |
(e.u.) |
|
|
|
|
|
|
|
|
|
|
|
|
|
|
|
|
OsO4 |
Solid |
(16.4) |
(23.1) |
– |
(–2.4) |
(6.726) |
(67.0) |
|
Liquid |
(33) |
– |
– |
– |
(6.612) |
(143.0) |
|
Gas |
16.46 |
8.60 |
– |
–4.6 |
(–7.644) |
(25.3) |
P2O3 |
Liquid |
(34.5) |
– |
– |
– |
(10.287) |
(162.6) |
|
Gas |
(153) |
(10) |
– |
– |
(–1.953) |
(38.0) |
PO2 |
Solid |
(11.3) |
(5.0) |
– |
– |
(3.591) |
(54.4) |
|
Liquid |
(20) |
– |
– |
– |
(3.640) |
(95.9) |
P2O5 |
Solid |
8.375 |
5.40 |
– |
– |
4.897 |
30.3 |
|
Gas |
36.80 |
– |
– |
– |
3.284 |
165.6 |
PaO2 |
Solid |
(14.4) |
(2.6) |
– |
– |
(4.409) |
(65.0) |
Pa2O5 |
Solid |
(28.4) |
(11.4) |
– |
– |
(8.975) |
(127.7) |
|
Liquid |
(48) |
– |
– |
– |
(–0.800) |
(241.1) |
|
|
|
|
|
|
|
|
For discussion of these coefficients, please see Table 75, Key to Tables of Thermodynamic Coefficients on page 257
Source: data from Weast, R. C., Ed., Handbook of Chemistry and Physics, 55th ed., CRC Press, Cleveland, 1974, D-58.
©2001 CRC Press LLC

Table 77. THERMODYNAMIC COEFFICIENTS FOR OXIDES
(SHEET 13 OF 23)
|
|
a |
b |
c |
d |
A |
B |
Oxide |
Phase |
– |
(cal • g mole-1 ) |
– |
– |
(kcal • g mole-1) |
(e.u.) |
|
|
|
|
|
|
|
|
|
|
|
|
|
|
|
|
PbO |
Solid, red |
10.60 |
4.00 |
– |
– |
3.338 |
45.4 |
|
Solid, yellow |
9.05 |
6.40 |
– |
– |
2.454 |
36.4 |
|
Liquid |
(14.6) |
– |
– |
– |
1.788 |
65.7 |
|
Gas |
(8.1) |
(0.4) |
– |
– |
(–59.94) |
(–11.0) |
Pb2O4 |
Solid |
(31.1) |
(17.6) |
– |
– |
(10.055) |
(132.0) |
PbO2 |
Solid |
12.7 |
7.80 |
– |
– |
4.133 |
56.4 |
PdO |
Solid |
3.30 |
14.2 |
– |
– |
1.615 |
(13.9) |
PoO2 |
Solid |
(14.3) |
(5.6) |
– |
– |
(4.513) |
(66.1) |
|
Liquid |
(22) |
– |
– |
– |
(3.460) |
(106.5) |
Pr2O3 |
Solid |
(29.0) |
(4.0) |
– |
(–4.0) |
(10.166) |
(133.2) |
|
Liquid |
(36) |
– |
– |
– |
(–6.298) |
(168.3) |
PrO2 |
Solid |
(17.6) |
(3.4) |
– |
(–2.8) |
(6.338) |
(85.9) |
|
|
|
|
|
|
|
|
For discussion of these coefficients, please see Table 75, Key to Tables of Thermodynamic Coefficients on page 257
Source: data from Weast, R. C., Ed., Handbook of Chemistry and Physics, 55th ed., CRC Press, Cleveland, 1974, D-58.
©2001 CRC Press LLC
Table 77. THERMODYNAMIC COEFFICIENTS FOR OXIDES
(SHEET 14 OF 23)
|
|
a |
b |
c |
d |
A |
B |
Oxide |
Phase |
– |
(cal • g mole-1 ) |
– |
– |
(kcal • g mole-1) |
(e.u.) |
|
|
|
|
|
|
|
|
|
|
|
|
|
|
|
|
PtO |
Solid |
(9.0) |
(6.4) |
– |
– |
(2.968) |
(39.7) |
Pt3O4 |
Solid |
(30.8) |
(17.4) |
– |
– |
(9.957) |
(139.7) |
PtO2 |
Solid |
(11.1) |
(9.6) |
– |
– |
(3.736) |
(49.6) |
|
Liquid |
(21) |
– |
– |
– |
(3.785) |
(101.5) |
PuO |
Solid |
(12.0) |
(2.4) |
– |
– |
(3.685) |
(49.1) |
|
Liquid |
(14.5) |
– |
– |
– |
(–2.287) |
(58.3) |
|
Gas |
(8.9) |
– |
– |
– |
(–62.307) |
(–5.3) |
Pu2O3 |
Solid |
(21.2) |
(18.2) |
– |
– |
(7.130) |
(88.2) |
|
Liquid |
(40) |
– |
– |
– |
(–5.691) |
(187.2) |
PuO2 |
Solid |
(17.1) |
(3.4) |
– |
(–2.6) |
(6.122) |
(80.2) |
|
Liquid |
(20.5) |
– |
– |
– |
(–10.62) |
(92.2) |
RaO |
Solid |
(10.5) |
(2.0) |
– |
– |
(3.220) |
(43.4) |
|
|
|
|
|
|
|
|
For discussion of these coefficients, please see Table 75, Key to Tables of Thermodynamic Coefficients on page 257
Source: data from Weast, R. C., Ed., Handbook of Chemistry and Physics, 55th ed., CRC Press, Cleveland, 1974, D-58.
©2001 CRC Press LLC

Table 77. THERMODYNAMIC COEFFICIENTS FOR OXIDES
(SHEET 15 OF 23)
|
|
a |
b |
c |
d |
A |
B |
Oxide |
Phase |
– |
(cal • g mole-1 ) |
– |
– |
(kcal • g mole-1) |
(e.u.) |
|
|
|
|
|
|
|
|
|
|
|
|
|
|
|
|
Rb2O |
Solid |
(15.4) |
(5.8) |
– |
– |
(4.850) |
(62.5) |
|
Liquid |
(22) |
– |
– |
– |
(2.754) |
(95.9) |
Rb2O2 |
Solid |
(20.9) |
(8.0) |
– |
– |
(6.587) |
(94.0) |
|
Liquid |
(29) |
– |
– |
– |
(3.273) |
(133.2) |
Rb2O3 |
Solid |
(20.5) |
(13.0) |
– |
– |
(6.690) |
(88.2) |
|
Liquid |
(34) |
– |
– |
– |
(5.603) |
(157.8) |
RbO2 |
Solid |
(13.8) |
(6.4) |
– |
– |
(4.399) |
(59.0) |
|
Liquid |
(21) |
– |
– |
– |
(3.720) |
(95.7) |
ReO2 |
Solid |
(10.8) |
(9.8) |
– |
– |
(3.656) |
(49.5) |
|
Liquid |
(24.5) |
– |
– |
– |
(1.204) |
(127.0) |
ReO3 |
Solid |
(18.0) |
(5.8) |
– |
– |
(5.625) |
(84.5) |
|
Liquid |
29 |
– |
– |
– |
(4.644) |
(136.8) |
|
|
|
|
|
|
|
|
For discussion of these coefficients, please see Table 75, Key to Tables of Thermodynamic Coefficients on page 257
Source: data from Weast, R. C., Ed., Handbook of Chemistry and Physics, 55th ed., CRC Press, Cleveland, 1974, D-58.
©2001 CRC Press LLC
Table 77. THERMODYNAMIC COEFFICIENTS FOR OXIDES
(SHEET 16 OF 23)
|
|
a |
b |
c |
d |
A |
B |
Oxide |
Phase |
– |
(cal • g mole-1 ) |
– |
– |
(kcal • g mole-1) |
(e.u.) |
|
|
|
|
|
|
|
|
|
|
|
|
|
|
|
|
Re2O7 |
Solid |
(41.8) |
(14.8) |
– |
(–3.0) |
(14.127) |
(200.3) |
|
Liquid |
(65.7) |
– |
– |
– |
(9.203) |
(314.7) |
|
Gas |
(38.2) |
– |
– |
– |
(–25.97) |
(109.3) |
ReO4 |
Solid |
(21.4) |
(10.8) |
– |
(–2.0) |
(7.531) |
(91.8) |
|
Liquid |
(33) |
– |
– |
– |
(6.775) |
(146.7) |
|
Gas |
(16.5) |
(8.6) |
– |
(–5.0) |
(–8.118) |
(30.6) |
Rh2O |
Solid |
15.59 |
6.47 |
– |
– |
4.936 |
(65.3) |
RhO |
Solid |
(9.84) |
(553) |
– |
– |
(3.179) |
(45.7) |
Rh2O3 |
Solid |
20.73 |
13.80 |
– |
– |
6.794 |
(99.2) |
RuO2 |
Solid |
(11.4) |
(6.0) |
– |
– |
3.666 |
(54.2) |
RuO4 |
Solid |
(20) |
– |
– |
– |
(5.963) |
(81.5) |
|
Liquid |
(33) |
– |
– |
– |
(6.663) |
(144.9) |
SO2 |
Gas |
11.4 |
1.414 |
– |
–2.045 |
4.148 |
7.12 |
|
|
|
|
|
|
|
|
For discussion of these coefficients, please see Table 75, Key to Tables of Thermodynamic Coefficients on page 257
Source: data from Weast, R. C., Ed., Handbook of Chemistry and Physics, 55th ed., CRC Press, Cleveland, 1974, D-58.
©2001 CRC Press LLC

Table 77. THERMODYNAMIC COEFFICIENTS FOR OXIDES
(SHEET 17 OF 23)
|
|
a |
b |
c |
d |
A |
B |
Oxide |
Phase |
– |
(cal • g mole-1 ) |
– |
– |
(kcal • g mole-1) |
(e.u.) |
|
|
|
|
|
|
|
|
|
|
|
|
|
|
|
|
Sb2O3 |
Solid |
19.10 |
17.1 |
– |
– |
6.455 |
84.5 |
|
Liquid |
(36) |
– |
– |
– |
(0.035) |
(168.2) |
|
Gas |
(20.8) |
– |
– |
– |
(–34.70) |
(49.9) |
SbO2 |
Solid |
11.30 |
8.1 |
– |
– |
3.725 |
51.6 |
Sb2O5 |
Solid |
(22.4) |
(23.6) |
– |
– |
(7.723) |
(104.8) |
Sc2O3 |
Solid |
23.17 |
5.64 |
– |
– |
7.159 |
1089 |
SeO |
Solid |
(9.1) |
(3.8) |
– |
– |
(2.882) |
(42.0) |
|
Liquid |
(15.5) |
– |
– |
– |
(0.490) |
(77.5) |
|
Gas |
8.20 |
0.50 |
– |
–0.80 |
(–58.54) |
(0.7) |
SeO2 |
Solid |
(12.8) |
(6.1) |
– |
(–0.2) |
(4.150) |
(59.9) |
|
Gas |
(14.5) |
– |
– |
– |
(–20.45) |
(26.4) |
SiO |
Solid |
(7.3) |
(2.4) |
– |
– |
(2.283) |
(35.8) |
|
|
|
|
|
|
|
|
For discussion of these coefficients, please see Table 75, Key to Tables of Thermodynamic Coefficients on page 257
Source: data from Weast, R. C., Ed., Handbook of Chemistry and Physics, 55th ed., CRC Press, Cleveland, 1974, D-58.
©2001 CRC Press LLC
Table 77. THERMODYNAMIC COEFFICIENTS FOR OXIDES
(SHEET 18 OF 23)
|
|
a |
b |
c |
d |
A |
B |
Oxide |
Phase |
– |
(cal • g mole-1 ) |
– |
– |
(kcal • g mole-1) |
(e.u.) |
|
|
|
|
|
|
|
|
|
|
|
|
|
|
|
|
SiO2 |
Solid, β |
11.22 |
8.20 |
– |
–2.70 |
4.615 |
57.83 |
|
Solid, α |
14.41 |
1.94 |
– |
– |
4.602 |
73.67 |
|
Liquid |
(20) |
– |
– |
– |
(9.649) |
(111.08) |
Sm2O3 |
Solid |
(25.9) |
(7.0) |
– |
– |
(8.033) |
(113.2) |
|
Liquid |
(36) |
– |
– |
– |
(–6.431) |
(166.3) |
SnO |
Solid |
9.40 |
3.62 |
– |
– |
2.964 |
41.1 |
|
Liquid |
(14.5) |
– |
– |
– |
(0.141) |
(68.1) |
|
Gas |
(9.0) |
– |
– |
– |
(–69.76) |
(–6.4) |
SnO2 |
Solid |
17.66 |
2.40 |
– |
–5.16 |
7.103 |
91.7 |
|
Liquid |
(22.5) |
– |
– |
– |
(0.304) |
(117.7) |
SrO |
Solid |
12.34 |
1.120 |
– |
–1.806 |
4.335 |
58.7 |
SrO2 |
Solid |
(16.8) |
(2.2) |
– |
(–3.0) |
(6.113) |
(83.3) |
|
|
|
|
|
|
|
|
For discussion of these coefficients, please see Table 75, Key to Tables of Thermodynamic Coefficients on page 257
Source: data from Weast, R. C., Ed., Handbook of Chemistry and Physics, 55th ed., CRC Press, Cleveland, 1974, D-58.
©2001 CRC Press LLC

Table 77. THERMODYNAMIC COEFFICIENTS FOR OXIDES
(SHEET 19 OF 23)
|
|
a |
b |
c |
d |
A |
B |
Oxide |
Phase |
– |
(cal • g mole-1 ) |
– |
– |
(kcal • g mole-1) |
(e.u.) |
|
|
|
|
|
|
|
|
|
|
|
|
|
|
|
|
Ta2O5 |
Solid |
29.2 |
10.0 |
– |
– |
9.151 |
135.2 |
|
Liquid |
(46) |
– |
– |
– |
(6.158) |
(235.1) |
TcO2 |
Solid |
(10.4) |
(9.2) |
– |
– |
(3.510) |
(48.6) |
|
Liquid |
(25) |
– |
– |
– |
(–5.946) |
(132.7) |
TcO3 |
Solid |
(19.4) |
(5.2) |
– |
(–2.0) |
(6.686) |
(93.7) |
Tc2O7 |
Solid |
(39.1) |
(18.6) |
– |
(–2.4) |
(13.29) |
(187.2) |
|
Liquid |
(64) |
– |
– |
– |
(10.02) |
(299.8) |
|
Gas |
(25) |
(28) |
– |
– |
(–21.98) |
(43.8) |
TeO |
Solid |
(8.6) |
(6.2) |
– |
– |
(2.840) |
(37.8) |
|
Liquid |
(15.5) |
– |
– |
– |
(–0.448) |
(72.3) |
|
Gas |
(8.9) |
– |
– |
– |
(–62.16) |
(–5.2) |
TeO3 |
Solid |
13.85 |
6.87 |
– |
– |
4.435 |
63.97 |
|
Liquid |
(20) |
– |
– |
– |
(3.940) |
(96.4) |
|
|
|
|
|
|
|
|
For discussion of these coefficients, please see Table 75, Key to Tables of Thermodynamic Coefficients on page 257
Source: data from Weast, R. C., Ed., Handbook of Chemistry and Physics, 55th ed., CRC Press, Cleveland, 1974, D-58.
©2001 CRC Press LLC

Table 77. THERMODYNAMIC COEFFICIENTS FOR OXIDES
(SHEET 20 OF 23)
|
|
a |
b |
c |
d |
A |
B |
Oxide |
Phase |
– |
(cal • g mole-1 ) |
– |
– |
(kcal • g mole-1) |
(e.u.) |
|
|
|
|
|
|
|
|
|
|
|
|
|
|
|
|
TeO2 |
Solid |
(11.0) |
(2.4) |
– |
– |
(3.386) |
(47.4) |
|
Liquid |
(15) |
– |
– |
– |
(–6.561) |
(66.9) |
ThO2 |
Solid |
16.45 |
2.346 |
– |
–2.124 |
5.721 |
80.03 |
TiO |
Solid, α |
10.57 |
3.60 |
– |
–1.86 |
3.935 |
54.03 |
|
Solid, β |
11.85 |
3.00 |
– |
– |
4.108 |
61.71 |
Ti2O3 |
Solid, α |
7.31 |
53.52 |
– |
– |
4.559 |
38.78 |
|
Solid, β |
34.68 |
1.30 |
– |
–10.20 |
13.605 |
184.48 |
|
Liquid |
(37.5) |
– |
– |
– |
(–7.796) |
(193.2) |
Ti3O5 |
Solid, α |
35.47 |
29.50 |
– |
– |
11.887 |
179.98 |
|
Solid, β |
41.60 |
8.00 |
– |
– |
10.230 |
202.80 |
|
Liquid |
(60) |
– |
– |
– |
(–18.701) |
(306.4) |
|
|
|
|
|
|
|
|
For discussion of these coefficients, please see Table 75, Key to Tables of Thermodynamic Coefficients on page 257
Source: data from Weast, R. C., Ed., Handbook of Chemistry and Physics, 55th ed., CRC Press, Cleveland, 1974, D-58.
©2001 CRC Press LLC

Table 77. THERMODYNAMIC COEFFICIENTS FOR OXIDES
(SHEET 21 OF 23)
|
|
a |
b |
c |
d |
A |
B |
Oxide |
Phase |
– |
(cal • g mole-1 ) |
– |
– |
(kcal • g mole-1) |
(e.u.) |
|
|
|
|
|
|
|
|
|
|
|
|
|
|
|
|
TiO2 |
Solid |
17.97 |
0.28 |
– |
–4.35 |
6.829 |
92.92 |
|
Liquid |
(21.4) |
– |
– |
– |
(–2.610) |
(111.08 |
Ti2O |
Solid |
(15.8) |
(6.0) |
– |
(–0.3) |
(5.078) |
(68.2) |
|
Liquid |
(22.1) |
– |
– |
– |
(2.651) |
(96.0) |
|
Gas |
(13.7) |
– |
– |
– |
(–20.94) |
(18.0) |
Tl2O3 |
Solid |
(23.0) |
(5.0) |
– |
– |
(7.080) |
(99.0) |
|
Liquid |
(35.5) |
– |
– |
– |
(4.604) |
(167.8) |
UO |
Solid |
(10.6) |
(2.0) |
– |
– |
(3.249) |
(45.0) |
UO2 |
Solid |
19.20 |
1.62 |
– |
–3.957 |
7.124 |
93.37 |
U3O8 |
Solid |
(65) |
(7.5) |
– |
(–10.9) |
(23.37) |
(312.7) |
UO3 |
Solid |
22.09 |
2.54 |
– |
–2.973 |
7.969 |
104.72 |
VO |
Solid |
11.32 |
1.61 |
– |
–1.26 |
3.869 |
56.4 |
|
Liquid |
(14.5) |
– |
– |
– |
(–8.157) |
(70.9) |
|
|
|
|
|
|
|
|
For discussion of these coefficients, please see Table 75, Key to Tables of Thermodynamic Coefficients on page 257
Source: data from Weast, R. C., Ed., Handbook of Chemistry and Physics, 55th ed., CRC Press, Cleveland, 1974, D-58.
©2001 CRC Press LLC
Table 77. THERMODYNAMIC COEFFICIENTS FOR OXIDES
(SHEET 22 OF 23)
|
|
a |
b |
c |
d |
A |
B |
Oxide |
Phase |
– |
(cal • g mole-1 ) |
– |
– |
(kcal • g mole-1) |
(e.u.) |
|
|
|
|
|
|
|
|
|
|
|
|
|
|
|
|
V2O3 |
Solid |
29.35 |
4.76 |
– |
–5.42 |
10.780 |
148.12 |
|
Liquid |
(38) |
– |
– |
– |
(–6.028) |
(193.4) |
V3O4 |
Solid |
(36) |
(30) |
– |
– |
(12.07) |
(182.1) |
|
Liquid |
(55.6) |
– |
– |
– |
(–54.72) |
(249.1) |
VO2 |
Solid, α |
14.96 |
– |
– |
– |
4.460 |
72.92 |
|
Solid, β |
17.85 |
1.70 |
– |
–3.94 |
5.680 |
89.09 |
|
Liquid |
25.50 |
– |
– |
– |
2.962 |
135.87 |
V2O5 |
Solid |
46.54 |
–390 |
– |
–13.22 |
18.136 |
240.2 |
|
Liquid |
45.60 |
– |
– |
– |
2.122 |
220.1 |
|
Gas |
(40) |
– |
– |
– |
(–73.90) |
(149.6) |
WO2 |
Solid |
(17.6) |
(4.2) |
– |
(–4.0) |
(6.772) |
(88.8) |
|
Liquid |
(24) |
– |
– |
– |
(–0.112) |
(121.8) |
|
|
|
|
|
|
|
|
For discussion of these coefficients, please see Table 75, Key to Tables of Thermodynamic Coefficients on page 257
Source: data from Weast, R. C., Ed., Handbook of Chemistry and Physics, 55th ed., CRC Press, Cleveland, 1974, D-58.
©2001 CRC Press LLC

Table 77. THERMODYNAMIC COEFFICIENTS FOR OXIDES
(SHEET 23 OF 23)
|
|
a |
b |
c |
d |
A |
B |
Oxide |
Phase |
– |
(cal • g mole-1 ) |
– |
– |
(kcal • g mole-1) |
(e.u.) |
|
|
|
|
|
|
|
|
|
|
|
|
|
|
|
|
WO3 |
Solid |
17.33 |
7.74 |
– |
– |
5.511 |
81.15 |
|
Liquid |
(30) |
– |
– |
– |
(–1.162) |
(152.5) |
|
Gas |
(18) |
– |
– |
– |
(–69.36) |
(40.2) |
Y2O3 |
Solid |
(26.0) |
(8.2) |
– |
(–2.2) |
(8.846) |
(122.3) |
ZnO |
Solid |
11.71 |
1.22 |
– |
–2.18 |
4.277 |
57.88 |
ZrO2 |
Solid, α |
16.64 |
1.80 |
– |
–3.36 |
6.168 |
85.21 |
|
Solid, β |
17.80 |
– |
– |
– |
4.270 |
89.96 |
|
|
|
|
|
|
|
|
For discussion of these coefficients, please see Table 75, Key to Tables of Thermodynamic Coefficients on page 257
Source: data from Weast, R. C., Ed., Handbook of Chemistry and Physics, 55th ed., CRC Press, Cleveland, 1974, D-58.
©2001 CRC Press LLC

Table 78. ENTROPY OF THE ELEMENTS
(SHEET 1 OF 3)
|
|
Entropy at 298K |
Element |
Phase |
(e.u.) |
|
|
|
|
|
|
Ac |
solid |
(13) |
Ag |
solid |
10.20 |
Al |
solid |
6.769 |
Am |
solid |
(13) |
As |
solid |
8.4 |
Au |
solid |
11.32 |
B |
solid |
1.42 |
Ba |
solid, α |
16 |
Be |
solid |
2.28 |
Bi |
solid |
13.6 |
C |
solid |
1.3609 |
Ca |
solid, α |
9.95 |
Cd |
solid |
12.3 |
Ce |
solid |
13.8 |
Cl2 |
gas |
53.286 |
Co |
solid, α |
6.8 |
Cr |
solid |
5.68 |
Cs |
solid |
19.8 |
Cu |
solid |
7.97 |
F2 |
gas |
48.58 |
Fe |
solid, α |
6.491 |
Ga |
solid |
9.82 |
Ge |
solid |
10.1 |
H2 |
gas |
31.211 |
Hf |
solid |
13.1 |
Hg |
liquid |
18.46 |
In |
solid |
13.88 |
Ir |
solid |
8.7 |
|
|
|
Source: data from Weast, R. C. Ed., Handbook of Chemistry and Physics, 69th ed., CRC Press, Boca Raton, Fla., 1988, D44.
©2001 CRC Press LLC

Table 78. ENTROPY OF THE ELEMENTS
(SHEET 2 OF 3)
|
|
Entropy at 298K |
Element |
Phase |
(e.u.) |
|
|
|
|
|
|
K |
solid |
15.2 |
La |
solid |
13.7 |
Li |
solid |
6.70 |
Mg |
solid |
7.77 |
Mn |
solid, α |
7.59 |
Mo |
solid |
6.83 |
N2 |
gas |
45.767 |
Na |
solid |
12.31 |
Nb |
solid |
8.3 |
Nd |
solid |
13.9 |
Ni |
solid, α |
7.137 |
Np |
solid |
(14) |
O2 |
gas |
49.003 |
Os |
solid |
7.8 |
P4 |
solid, white |
42.4 |
Pa |
solid |
(13.5) |
Pb |
solid |
15.49 |
Pd |
solid |
8.9 |
Po |
solid |
13 |
Pr |
solid |
(13.5) |
Pt |
solid |
10.0 |
Pu |
solid |
(13.0) |
Ra |
solid |
(17) |
Rb |
solid |
16.6 |
Re |
solid |
(8.89) |
Rh |
solid |
7.6 |
Ru |
solid, α |
6.9 |
S |
solid, α |
7.62 |
|
|
|
Source: data from Weast, R. C. Ed., Handbook of Chemistry and Physics, 69th ed., CRC Press, Boca Raton, Fla., 1988, D44.
©2001 CRC Press LLC

Table 78. ENTROPY OF THE ELEMENTS
(SHEET 3 OF 3)
|
|
Entropy at 298K |
Element |
Phase |
(e.u.) |
|
|
|
|
|
|
Sb |
solid (α, β, γ) |
10.5 |
Sc |
solid |
(9.0) |
Se |
solid |
10.144 |
Si |
solid |
4.50 |
Sm |
solid |
(15) |
Sn |
solid (α, β) |
12.3 |
Sr |
solid |
13.0 |
Ta |
solid |
9.9 |
Tc |
solid |
(8.0) |
Te |
solid, α |
11.88 |
Th |
solid |
12.76 |
Ti |
solid, α |
7.334 |
Tl |
solid, α |
15.4 |
U |
solid, α |
12.03 |
V |
solid |
7.05 |
W |
solid |
8.0 |
Y |
solid |
(11) |
Zn |
solid |
9.95 |
Zr |
solid, α |
9.29 |
|
|
|
Source: data from Weast, R. C. Ed., Handbook of Chemistry and Physics, 69th ed., CRC Press, Boca Raton, Fla., 1988, D44.
©2001 CRC Press LLC

Table 79. VAPOR PRESSURE OF THE ELEMENTS
AT VERY LOW PRESSURES (SHEET 1 OF 2)
|
|
|
|
Pressure (mm Hg) |
|
|
|
|
Melting point |
|
|
|
|
|
|
|
10 -5 |
10-4 |
10-3 |
10-2 |
10-1 |
1 |
|
Element |
(˚C) |
||||||
|
|
|
|
|
|
|
|
|
|
|
|
|
|
|
|
Ag |
961 |
767 |
848 |
936 |
1047 |
1184 |
1353 |
Al |
660 |
724 |
808 |
889 |
996 |
1123 |
1279 |
Au |
1063 |
1083 |
1190 |
1316 |
1465 |
1646 |
1867 |
Ba |
717 |
418 |
476 |
546 |
629 |
730 |
858 |
Be |
1284 |
942 |
1029 |
1130 |
1246 |
1395 |
1582 |
Bi |
271 |
474 |
536 |
609 |
698 |
802 |
934 |
C |
|
2129 |
2288 |
2471 |
2681 |
2926 |
3214 |
Cd |
321 |
148 |
180 |
220 |
264 |
321 |
|
Co |
1478 |
1249 |
1362 |
1494 |
1649 |
1833 |
2056 |
Cr |
1900 |
907 |
992 |
1090 |
1205 |
1342 |
1504 |
Cu |
1083 |
946 |
1035 |
1141 |
1273 |
1432 |
1628 |
Fe |
1535 |
1094 |
1195 |
1310 |
1447 |
1602 |
1783 |
Hg |
–38.9 |
–23.9 |
–5.5 |
18.0 |
48.0 |
82.0 |
126 |
In |
157 |
667 |
746 |
840 |
952 |
1088 |
1260 |
Ir |
2454 |
1993 |
2154 |
2340 |
2556 |
2811 |
3118 |
Mg |
651 |
287 |
331 |
383 |
443 |
515 |
605 |
Mn |
1244 |
717 |
791 |
878 |
980 |
1103 |
1251 |
Mo |
2622 |
1923 |
2095 |
2295 |
2533 |
|
|
Ni |
1455 |
1157 |
1257 |
1371 |
1510 |
1679 |
1884 |
Os |
2697 |
2101 |
2264 |
2451 |
2667 |
2920 |
3221 |
|
|
|
|
|
|
|
|
To convert mm Hg (torr) to N/m2, divide by 133.3
To convert atm to MN/m2, divide by 0.1013
This table lists the temperature in degrees Celsius (Centigrade) at which an element has a vapor pressure indicated by the headings of the columns.
The values given in this table are from a variety of sources that are not always in agreement; for that reason, the table should be used only as a general guide.
Source: from Dushman, S., Scientific Foundations of Vacuum Technique, John Wiley & Sons, New York, (1949)
©2001 CRC Press LLC

Table 79. VAPOR PRESSURE OF THE ELEMENTS
AT VERY LOW PRESSURES (SHEET 2 OF 2)
|
|
|
|
Pressure (mm Hg) |
|
|
|
|
Melting point |
|
|
|
|
|
|
|
10 -5 |
10-4 |
10-3 |
10-2 |
10-1 |
1 |
|
Element |
(˚C) |
||||||
|
|
|
|
|
|
|
|
|
|
|
|
|
|
|
|
Pb |
328 |
483 |
548 |
625 |
718 |
832 |
975 |
Pd |
1555 |
1156 |
1271 |
1405 |
1566 |
1759 |
2000 |
Pt |
1774 |
1606 |
1744 |
1904 |
2090 |
2313 |
2582 |
Sb |
630 |
466 |
525 |
595 |
678 |
779 |
904 |
Si |
1410 |
1024 |
1116 |
1223 |
1343 |
1485 |
1670 |
Sn |
232 |
823 |
922 |
1042 |
1189 |
1373 |
1609 |
Ta |
2996 |
2407 |
2599 |
2820 |
|
|
|
W |
3382 |
2554 |
2767 |
3016 |
3309 |
|
|
Zn |
419 |
211 |
248 |
292 |
343 |
405 |
|
Zr |
2127 |
1527 |
1660 |
1816 |
2001 |
2212 |
2459 |
|
|
|
|
|
|
|
|
To convert mm Hg (torr) to N/m2, divide by 133.3
To convert atm to MN/m2, divide by 0.1013
This table lists the temperature in degrees Celsius (Centigrade) at which an element has a vapor pressure indicated by the headings of the columns.
The values given in this table are from a variety of sources that are not always in agreement; for that reason, the table should be used only as a general guide.
Source: from Dushman, S., Scientific Foundations of Vacuum Technique, John Wiley & Sons, New York, (1949)
©2001 CRC Press LLC

Table 80. VAPOR PRESSURE OF THE ELEMENTS
AT MODERATE PRESSURES (SHEET 1 OF 3)
|
|
|
Pressure (mm Hg) |
|
||
|
|
|
|
|
|
|
Element |
Symbol |
1 |
10 |
100 |
400 |
760 |
|
|
|
|
|
|
|
|
|
|
|
|
|
|
Aluminum |
Al |
1540 |
1780 |
2080 |
2320 |
2467 |
Antimony |
Sb |
|
960 |
1280 |
1570 |
1750 |
Arsenic |
As |
380 |
440 |
510 |
580 |
610 |
Barium |
Ba |
860 |
1050 |
1300 |
1520 |
1640 |
Beryllium |
Be |
1520 |
1860 |
2300 |
2770 |
2970 |
Bismuth |
Bi |
|
1060 |
1280 |
1450 |
1560 |
Boron |
B |
2660 |
3030 |
3460 |
3810 |
4000 |
Bromine |
Br |
–60 |
–30 |
+9 |
39 |
59 |
Cadmium |
Cd |
393 |
486 |
610 |
710 |
765 |
Calcium |
Ca |
800 |
970 |
1200 |
1390 |
1490 |
Cesium |
Cl |
|
373 |
513 |
624 |
690 |
Chlorine |
Cl |
–123 |
–101 |
–71 |
–46 |
–34 |
Chromium |
Cr |
1610 |
1840 |
2140 |
2360 |
2480 |
Cobalt |
Co |
1910 |
2170 |
2500 |
2760 |
2870 |
Copper |
Cu |
|
1870 |
2190 |
2440 |
2600 |
Fluorine |
F |
|
|
–203 |
–193 |
–188 |
Gallium |
Ca |
1350 |
1570 |
1850 |
2060 |
2180 |
Germanium |
Ge |
|
2080 |
2440 |
2710 |
2830 |
Gold |
Au |
1880 |
2160 |
2520 |
2800 |
2940 |
Indium |
In |
|
|
|
1960 |
2080 |
|
|
|
|
|
|
|
To convert mm Hg (torr) to N/m2, divide by 133.3
To convert atm to MN/m2, divide by 0.1013
This table lists the temperature in degrees Celsius (Centigrade) at which an element has a vapor pressure indicated by the headings of the columns.
The values given in this table are from a variety of sources that are not always in agreement; for that reason, the table should be used only as a general guide.
Source: from Dushman, S., Scientific Foundations of Vacuum Technique, John Wiley & Sons, New York, (1949)
©2001 CRC Press LLC

Table 80. VAPOR PRESSURE OF THE ELEMENTS
AT MODERATE PRESSURES (SHEET 2 OF 3)
|
|
|
Pressure (mm Hg) |
|
||
|
|
|
|
|
|
|
Element |
Symbol |
1 |
10 |
100 |
400 |
760 |
|
|
|
|
|
|
|
|
|
|
|
|
|
|
Iodine |
I |
40 |
72 |
115 |
160 |
185 |
Iridium |
Ir |
2830 |
3170 |
3630 |
3960 |
4130 |
Iron |
Fe |
1780 |
2040 |
2370 |
2620 |
2750 |
Lanthanum |
La |
|
|
|
3230 |
3420 |
Lead |
Pb |
970 |
1160 |
1420 |
1630 |
1740 |
Lithium |
Li |
750 |
890 |
1080 |
1240 |
1310 |
Magnesium |
Mg |
620 |
740 |
900 |
1040 |
1110 |
Manganese |
Mn |
|
1510 |
1810 |
2050 |
2100 |
Mercury |
Hg |
|
|
260 |
330 |
356.9 |
Molybdenum |
Mo |
3300 |
3770 |
4200 |
4580 |
4830 |
Neodymium |
Nd |
|
|
|
2870 |
3100 |
Nickel |
Ni |
1800 |
2090 |
2370 |
2620 |
2730 |
Palladium |
Pd |
1470 |
2290 |
2670 |
2950 |
3140 |
Phosphorus |
P |
|
127 |
199 |
253 |
283 |
Platinum |
Pt |
2600 |
2940 |
3360 |
3650 |
3830 |
Polonium |
Po |
472 |
587 |
752 |
890 |
960 |
Potassium |
K |
|
|
590 |
710 |
770 |
Rhodium |
Rh |
2530 |
2850 |
3260 |
3590 |
3760 |
Rubidium |
Rb |
|
390 |
527 |
640 |
700 |
Selenium |
Se |
|
429 |
547 |
640 |
685 |
|
|
|
|
|
|
|
To convert mm Hg (torr) to N/m2, divide by 133.3
To convert atm to MN/m2, divide by 0.1013
This table lists the temperature in degrees Celsius (Centigrade) at which an element has a vapor pressure indicated by the headings of the columns.
The values given in this table are from a variety of sources that are not always in agreement; for that reason, the table should be used only as a general guide.
Source: from Dushman, S., Scientific Foundations of Vacuum Technique, John Wiley & Sons, New York, (1949)
©2001 CRC Press LLC

Table 80. VAPOR PRESSURE OF THE ELEMENTS
AT MODERATE PRESSURES (SHEET 3 OF 3)
|
|
|
Pressure (mm Hg) |
|
||
|
|
|
|
|
|
|
Element |
Symbol |
1 |
10 |
100 |
400 |
760 |
|
|
|
|
|
|
|
|
|
|
|
|
|
|
Silver |
Ag |
1310 |
1540 |
1850 |
2060 |
2210 |
Sodium |
Na |
440 |
546 |
700 |
830 |
890 |
Strontium |
Sr |
740 |
900 |
1100 |
1280 |
1380 |
Sulfur |
S |
|
246 |
333 |
407 |
445 |
Tellurium |
Te |
520 |
633 |
792 |
900 |
962 |
Thallium |
Tl |
|
1000 |
1210 |
1370 |
1470 |
Tin |
Sn |
1610 |
1890 |
2270 |
2580 |
2750 |
Titanium |
Ti |
2180 |
2480 |
2860 |
3100 |
3260 |
Tungsten |
W |
3980 |
4490 |
5160 |
5470 |
5940 |
Uranium |
U |
2450 |
2800 |
3270 |
3620 |
3800 |
Vanadium |
V |
2290 |
2570 |
2950 |
3220 |
3380 |
Zinc |
Zn |
|
590 |
730 |
840 |
907 |
|
|
|
|
|
|
|
To convert mm Hg (torr) to N/m2, divide by 133.3
To convert atm to MN/m2, divide by 0.1013
This table lists the temperature in degrees Celsius (Centigrade) at which an element has a vapor pressure indicated by the headings of the columns.
The values given in this table are from a variety of sources that are not always in agreement; for that reason, the table should be used only as a general guide.
Source: from Dushman, S., Scientific Foundations of Vacuum Technique, John Wiley & Sons, New York, (1949)
©2001 CRC Press LLC
Table 81. VAPOR PRESSURE OF THE ELEMENTS
AT HIGH PRESSURES (SHEET 1 OF 3)
|
|
|
Pressure (atm) |
|
|
|
|
|
|
|
|
|
|
Element |
Symbol |
2 |
5 |
10 |
20 |
40 |
|
|
|
|
|
|
|
|
|
|
|
|
|
|
Aluminum |
Al |
2610 |
2850 |
3050 |
3270 |
3530 |
Antimony |
Sb |
1960 |
2490 |
|
|
|
Arsenic |
As |
|
|
|
|
|
Barium |
Ba |
1790 |
2030 |
2230 |
|
|
Beryllium |
Be |
3240 |
3730 |
4110 |
4720 |
5610 |
Bismuth |
Bi |
1660 |
1850 |
2000 |
2180 |
|
Boron |
B |
|
|
|
|
|
Bromine |
Br |
78 |
110 |
|
|
|
Cadmium |
Cd |
830 |
930 |
1030 |
1120 |
1240 |
Calcium |
Ca |
1630 |
1850 |
2020 |
2290 |
|
Cesium |
Cl |
|
|
|
|
|
Chlorine |
Cl |
–17 |
+9 |
30 |
55 |
97 |
Chromium |
Cr |
2630 |
2850 |
3010 |
3180 |
|
Cobalt |
Co |
3040 |
3270 |
|
|
|
Copper |
Cu |
2760 |
3010 |
3500 |
3460 |
3740 |
Fluorine |
F |
–180.7 |
–169.1 |
–159.6 |
|
|
Gallium |
Ca |
2320 |
2560 |
2730 |
|
|
Germanium |
Ge |
2970 |
3200 |
3430 |
|
|
Gold |
Au |
3120 |
3490 |
3630 |
3890 |
|
Indium |
In |
2230 |
2440 |
2600 |
|
|
Iodine |
I |
216 |
265 |
|
|
|
Iridium |
Ir |
4310 |
4650 |
|
|
|
Iron |
Fe |
2900 |
3150 |
3360 |
3570 |
|
Lanthanum |
La |
3620 |
3960 |
4270 |
|
|
|
|
|
|
|
|
|
To convert atm to MN/m2 divide by 0.1013
This table lists the temperature in degrees Celsius (Centigrade) at which an element has a vapor pressure indicated by the headings of the columns.
Source: from Loebel, R., in Handbook of Chemistry and Physics, 55th ed., Weast, R. C., Ed., CRC Press, Cleveland, (1974)
©2001 CRC Press LLC

Table 81. VAPOR PRESSURE OF THE ELEMENTS
AT HIGH PRESSURES (SHEET 2 OF 3)
|
|
|
|
Pressure (atm) |
|
|
|
|
|
|
|
|
|
|
|
Element |
Symbol |
2 |
5 |
|
10 |
20 |
40 |
|
|
|
|
|
|
|
|
|
|
|
|
|
|
|
|
Lead |
Pb |
1880 |
2140 |
|
2320 |
2620 |
|
Lithium |
Li |
1420 |
1518 |
|
|
|
|
Magnesium |
Mg |
1190 |
1330 |
|
1430 |
1560 |
|
Manganese |
Mn |
2360 |
2580 |
|
2850 |
|
|
Mercury |
Hg |
398 |
465 |
|
517 |
581 |
657 |
Molybdenum |
Mo |
5050 |
5340 |
|
5680 |
5980 |
|
Neodymium |
Nd |
3300 |
3680 |
|
3990 |
|
|
Nickel |
Ni |
2880 |
3120 |
|
3300 |
3310 |
|
Palladium |
Pd |
3270 |
3560 |
|
3840 |
|
|
Phosphorus |
P |
319 |
|
|
|
|
|
Platinum |
Pt |
4000 |
4310 |
|
4570 |
4860 |
|
Polonium |
Po |
1060 |
1200 |
|
1340 |
|
|
Potassium |
K |
850 |
950 |
|
1110 |
1240 |
1420 |
Rhodium |
Rh |
3930 |
4230 |
|
4440 |
|
|
Rubidium |
Rb |
|
|
|
|
|
|
Selenium |
Se |
750 |
850 |
|
920 |
1010 |
1120 |
Silver |
Ag |
2360 |
2600 |
|
2850 |
3050 |
3300 |
Sodium |
Na |
980 |
1120 |
|
1230 |
1370 |
|
Strontium |
Sr |
1480 |
1670 |
|
1850 |
2030 |
|
Sulfur |
S |
493 |
574 |
|
640 |
720 |
|
Tellurium |
Te |
1030 |
1160 |
|
1250 |
|
|
Thallium |
Tl |
1560 |
1750 |
|
1900 |
2050 |
2260 |
Tin |
Sn |
2950 |
3270 |
|
3540 |
3890 |
|
Titanium |
Ti |
3400 |
3650 |
|
3800 |
|
|
|
|
|
|
|
|
|
|
To convert atm to MN/m2 divide by 0.1013
This table lists the temperature in degrees Celsius (Centigrade) at which an element has a vapor pressure indicated by the headings of the columns.
Source: from Loebel, R., in Handbook of Chemistry and Physics, 55th ed., Weast, R. C., Ed., CRC Press, Cleveland, (1974)
©2001 CRC Press LLC

Table 81. VAPOR PRESSURE OF THE ELEMENTS
AT HIGH PRESSURES (SHEET 3 OF 3)
|
|
|
|
Pressure (atm) |
|
|
|
|
|
|
|
|
|
|
|
Element |
Symbol |
2 |
5 |
|
10 |
20 |
40 |
|
|
|
|
|
|
|
|
|
|
|
|
|
|
|
|
Tungsten |
W |
6260 |
6670 |
|
7250 |
7670 |
|
Uranium |
U |
4040 |
4420 |
|
|
|
|
Vanadium |
V |
3540 |
3800 |
|
|
|
|
Zinc |
Zn |
970 |
1090 |
|
1180 |
1290 |
|
|
|
|
|
|
|
|
|
To convert atm to MN/m2 divide by 0.1013
This table lists the temperature in degrees Celsius (Centigrade) at which an element has a vapor pressure indicated by the headings of the columns.
Source: from Loebel, R., in Handbook of Chemistry and Physics, 55th ed., Weast, R. C., Ed., CRC Press, Cleveland, (1974)
©2001 CRC Press LLC

Table 82. VAPOR PRESSURE OF ELEMENTS AND
INORGANIC COMPOUNDS* (SHEET 1 OF 5)
|
|
|
|
Temperature. Range |
|
|
|
|
of Validity |
Compound |
Formula |
a |
b |
˚C |
|
|
|
|
|
|
|
|
|
|
Aluminum Oxide |
Al2O3 |
540000 |
14.22 |
1840 to 2200 liq. |
Ammonia |
NH3 |
31211 |
9.9974 |
–127 to –78 sol. |
Ammonium Bromide |
NH4Br |
90208 |
9.9404 |
250 to 400 sol. |
Ammonium Chloride |
NH4Cl |
83486 |
10.0164 |
100 to 400 sol. |
Ammonium Cyanide |
NH4CN |
41484 |
9.978 |
7 to 17 sol. |
Ammonium Iodide |
NH4I |
95730 |
10.2700 |
300 to 400 sol. |
Ammonium Sulfhydrate |
NH4HS |
46025 |
10.7500 |
6 to 40 sol. |
Antimony |
Sb |
189000 |
9.051 |
1070 to 1325 liq. |
Argon |
Ar |
7814.5 |
7.5741 |
–208 to –189 sol. |
|
|
6826 |
6.9605 |
–189 to –183 liq. |
Arsenic |
As |
47100 |
6.692 |
800 to 860 liq. |
|
|
133000 |
10.800 |
440 to 815 sol. |
Arsenous Oxide |
As2O3 |
111350 |
12.127 |
100 to 315 sol. |
|
|
52120 |
6.513 |
315 to 490 liq. |
Barium |
Ba |
350000 |
15.765 |
930 to 1130 liq. |
Bismuth |
Bi |
200000 |
8.876 |
1210 to 1420 liq. |
Bismuth Trichloride |
BiCl3 |
13125 |
2.681 |
91 to 213 sol. |
Cadimium |
Cd |
10900 |
8.564 |
150 to 320.9 sol.. |
|
|
99900 |
7.897 |
500 to 840 liq |
Cadimium Iodide |
CdI2 |
122200 |
9.269 |
385 to 450 liq. |
Cesium |
Cs |
73400 |
6.949 |
200 to 350 liq. |
Cesium Chloride |
CsCl |
163200 |
8.340 |
986 to 1295 liq. |
Calcium |
Ca |
370000 |
16.240 |
960 to 1110 liq. |
Carbon |
C |
540000 |
9.596 |
3880 to 4430 liq. |
Carbon Dioxide |
CO2 |
26179.3 |
9.9082 |
–135 to –56.7 liq. |
Carbon Monooxide |
CO |
6354 |
6.976 |
–220 to –206 liq. |
Chlorine |
Cl |
29293 |
9.950 |
–154 to –103 liq. |
Cobalt |
Co |
309000 |
7.571 |
2375 liq. |
|
|
|
|
|
Source: data compiled by J.S. Park from CRC Handbook of Chemistry and Physics, David R. Lide, Ed., CRC Press, Boca Raton, (1990).
©2001 CRC Press LLC

Table 82. VAPOR PRESSURE OF ELEMENTS AND
INORGANIC COMPOUNDS* (SHEET 2 OF 5)
|
|
|
|
Temperature. Range |
|
|
|
|
of Validity |
Compound |
Formula |
a |
b |
˚C |
|
|
|
|
|
|
|
|
|
|
Copper |
Cu |
468000 |
12.344 |
2100 to 2310 liq. |
Cuprous Chloride |
Cu2Cl2 |
80700 |
5.454 |
878 to 1369 liq. |
Cyanogen |
(CN)2 |
32437 |
9.6539 |
–72 to –28 sol. |
|
|
23750 |
7.808 |
–32 to –6 liq. |
Ferrous Chloride |
FeCl2 |
135200 |
8.33 |
700 to 390 sol. |
Gold |
Au |
385000 |
9.853 |
2315 to 2500 liq. |
Hydriodic Acid |
HI |
24160 |
8.259 |
–97 to –51 sol. |
|
|
21580 |
7.630 |
–50 to –34 liq. |
Hydrobromic Acid |
HBr |
22420 |
8.734 |
–114 to –86 sol. |
|
|
17960 |
7.427 |
–86 ot –66 liq. |
Hydrochloric Acid |
HCl |
19588 |
8.4430 |
–158 to –110 sol. |
Hydrocyanic Acid |
HCN |
27830 |
7.7446 |
–8 to 27 liq. |
Hydrofluoric Acid |
HF |
25180 |
7.370 |
–83 to 48 liq. |
Hydrogen Peroxide |
H2O2 |
48530 |
8.853 |
10 to 90 liq. |
Hydrogen Sulfide |
H2S |
20690 |
7.880 |
–110 to –83 sol. |
Iron |
Fe |
309000 |
7.482 |
2220 to 2450 liq. |
Krypton |
Kr |
10065 |
7.1770 |
–189 to –169 sol. |
|
|
9377 |
6.92387 |
–169 to –150 liq. |
Lead |
Pb |
188500 |
7.827 |
525 to 1325 liq. |
Lead Bromide |
PbBr2 |
118000 |
7.827 |
735 to 918 liq. |
Lead Chloride |
PbCl2 |
141900 |
8.961 |
500 to 950 liq. |
Lithium Bromide |
LiBr |
152700 |
8.068 |
1010 to 1265 liq. |
Lithium Chloride |
LiCl |
155900 |
7.939 |
1045 to 1325 liq. |
Lithium Fluoride |
LiF |
218400 |
8.753 |
1398 to 1666 liq. |
Lithium Iodide |
LiI |
143600 |
8.011 |
940 to 1140 liq. |
|
|
|
|
|
Source: data compiled by J.S. Park from CRC Handbook of Chemistry and Physics, David R. Lide, Ed., CRC Press, Boca Raton, (1990).
©2001 CRC Press LLC

Table 82. VAPOR PRESSURE OF ELEMENTS AND
INORGANIC COMPOUNDS* (SHEET 3 OF 5)
|
|
|
|
Temperature. Range |
|
|
|
|
of Validity |
Compound |
Formula |
a |
b |
˚C |
|
|
|
|
|
|
|
|
|
|
Magnesium |
Mg |
260000 |
12.993 |
900 to 1070 liq. |
Magnase |
Mn |
267000 |
9.300 |
1510 to 1900 liq. |
Mercuric Bromide |
HgBr2 |
79800 |
10.181 |
111 to 235 sol. |
|
|
61250 |
8.284 |
238 to 331 lig. |
Mercuric Chloride |
HgCl2 |
85030 |
10.888 |
60 to 130 sol. |
|
|
78850 |
10.094 |
130 to 270 sol. |
|
|
61020 |
8.409 |
275 to 309 liq. |
Mercuric Iodide |
HgI2 |
82340 |
10.057 |
100 to 250 sol. |
|
|
62770 |
8.115 |
266 to 360 liq. |
Mercury |
Hg |
73000 |
10.383 |
–80 to –38.87 sol. |
|
|
58700 |
7.752 |
400 to 1300 liq. |
Molybdenum |
Mo |
680000 |
10.844 |
1800 to 2240 sol. |
Nitrogen |
N2 |
6881.3 |
7.66558 |
–215 to –210 sol. |
Nitrogen Dioxide |
NO |
16423 |
10.048 |
–200 to –161 sol. |
|
|
13040 |
8.440 |
–163.7 to –148 liq. |
Nitrogen Monoxide |
N2O |
23590 |
9.579 |
–144 to –90 sol. |
|
|
16440 |
7.535 |
–90.1 to –88.7 liq. |
Nitrogen Pentoxide |
N2O5 |
57180 |
12.647 |
–30 to 30 sol. |
Nitrogen Tetroxide |
N2O4 |
55160 |
13.400 |
–100 to –40 sol. |
|
|
45440 |
11.214 |
–40 to –10 sol. |
|
|
33430 |
8.814 |
–8 to 43.2 liq. |
Nitrogen Trioxide |
N2O3 |
39400 |
10.30 |
–25 to 0 liq. |
Phosphorus (White) |
P |
63123 |
9.6511 |
20 to 44.1 sol. |
Phosphorus (Violet) |
P |
108510 |
11.0842 |
380 to 590 sol. |
Platinum |
Pt |
486000 |
7.786 |
1425 to 1765 sol. |
Potassium |
K |
84900 |
7.183 |
260 to 760 liq. |
|
|
|
|
|
Source: data compiled by J.S. Park from CRC Handbook of Chemistry and Physics, David R. Lide, Ed., CRC Press, Boca Raton, (1990).
©2001 CRC Press LLC

Table 82. VAPOR PRESSURE OF ELEMENTS AND
INORGANIC COMPOUNDS* (SHEET 4 OF 5)
|
|
|
|
Temperature. Range |
|
|
|
|
of Validity |
Compound |
Formula |
a |
b |
˚C |
|
|
|
|
|
|
|
|
|
|
Potassium Bromide |
KBr |
168100 |
8.2470 |
906 to 1063 liq. |
|
|
163800 |
7.936 |
1095 to 1375 liq. |
Potassium Chloride |
KCl |
174500 |
8.3526 |
906 to 1105 liq. |
|
|
169700 |
8.130 |
1116 to 1428 liq. |
Potassium Flouride |
KF |
207500 |
9.000 |
1278 to 1500 liq. |
Potassium Hydroxide |
KOH |
136000 |
7.330 |
1170 to 1327 liq. |
Potassium Iodide |
KI |
157600 |
8.0957 |
843 to 1028 liq. |
|
|
155700 |
7.949 |
1063 to 1333 liq. |
Rubidium |
Rb |
76000 |
6.976 |
250 to 370 liq. |
Rubidium Chloride |
RbCl |
198600 |
9.111 |
1142 to 1395 liq. |
Silicon |
Si |
170000 |
5.950 |
1200 to 1320 sol. |
Silicon Dioxide |
SiO2 |
506000 |
13.43 |
1860 to 2230 liq. |
Silver |
Ag |
250000 |
8.762 |
1650 to 1950 liq. |
Silver Chloride |
AgCl |
185500 |
8.179 |
1255 to 1442 liq. |
Sodium |
Na |
103300 |
7.553 |
180 to 883 liq. |
Sodium Bromide |
NaBr |
161600 |
7.948 |
1138 to 1394 liq. |
Sodium Chloride |
NaCl |
180300 |
8.3297 |
976 to 1155 liq. |
|
|
185800 |
8.548 |
1156 to 1430 liq. |
Sodium Cyanide |
NaCN |
155520 |
7.472 |
800 to 1360 liq. |
Sodium Fluoride |
NaF |
218200 |
8.640 |
1562 to 1701 liq. |
Sodium Hydroxide |
NaOH |
132000 |
7.030 |
1010 to 1042 liq. |
Sodium Iodide |
NaI |
165100 |
8.371 |
1063 to 1307 liq. |
Stannic Chloride |
SnCl4 |
46740 |
9.824 |
–52 to –38 liq. |
Stronium |
Sr |
360000 |
16.056 |
940 to 1140 liq. |
|
|
|
|
|
Source: data compiled by J.S. Park from CRC Handbook of Chemistry and Physics, David R. Lide, Ed., CRC Press, Boca Raton, (1990).
©2001 CRC Press LLC

Table 82. VAPOR PRESSURE OF ELEMENTS AND
INORGANIC COMPOUNDS* (SHEET 5 OF 5)
|
|
|
|
Temperature. Range |
|
|
|
|
of Validity |
Compound |
Formula |
a |
b |
˚C |
|
|
|
|
|
|
|
|
|
|
Sulfur Dioxide |
SO2 |
35827 |
10.5916 |
–95 to –75 liq. |
Sulfur Trioxide |
SO3 |
43450 |
10.022 |
24 to 48 liq. |
Thallium |
Tl |
120000 |
6.140 |
950 to 1200 liq. |
Thallium Chloride |
TlCl |
105200 |
7.947 |
665 to 807 liq. |
Tin |
Sn |
328000 |
9.643 |
1950 to 2270 liq. |
Tungsten |
W |
897000 |
9.920 |
2230 to 2770 liq. |
Zinc |
Zn |
133000 |
9.200 |
250 to 491.4 sol. |
|
|
118000 |
8.108 |
600 to 985 liq. |
|
|
|
|
|
Source: data compiled by J.S. Park from CRC Handbook of Chemistry and Physics, David R. Lide, Ed., CRC Press, Boca Raton, (1990).
*The vapor pressure with respect to temperature may be represented by the following equation:
log10 p = –0.05223a/T + b
where p is the pressure in mm of mercury of the saturated vapor at the absolute temperature T. (T = t˚C + 273.1) The values obtained by the use of the equation given above are valid within the temperature ranges indicated for each of the compounds.
©2001 CRC Press LLC

Table 83. VALUES OF THE ERROR FUNCTION
|
(SHEET 1 OF 2) |
|
|
z |
erf (z) |
|
|
|
|
0.00 |
0.0000 |
0.01 |
0.0113 |
0.02 |
0.0226 |
0.03 |
0.0338 |
0.04 |
0.0451 |
0.05 |
0.0564 |
0.10 |
0.1125 |
0.15 |
0.1680 |
0.20 |
0.2227 |
0.25 |
0.2763 |
0.30 |
0.3286 |
0.35 |
0.3794 |
0.40 |
0.4284 |
0.45 |
0.4755 |
0.50 |
0.5205 |
0.55 |
0.5633 |
0.60 |
0.6039 |
0.65 |
0.6420 |
0.70 |
0.6778 |
0.75 |
0.7112 |
0.80 |
0.7421 |
0.85 |
0.7707 |
0.90 |
0.7969 |
0.95 |
0.8209 |
1.00 |
0.8427 |
1.10 |
0.8802 |
1.20 |
0.9103 |
1.30 |
0.9340 |
|
|
Source: from: Handbook of Mathematical Functions, M. Abramowitz and I. A. Stegun, eds., National Bureau of Standards, Applied Mathematics Series 55, Washington, D.C., 1972.
©2001 CRC Press LLC

Table 83. VALUES OF THE ERROR FUNCTION
|
(SHEET 2 OF 2) |
|
|
z |
erf (z) |
|
|
|
|
1.40 |
0.9523 |
1.50 |
0.9661 |
1.60 |
0.9763 |
1.70 |
0.9838 |
1.80 |
0.9891 |
1.90 |
0.9928 |
2.00 |
0.9953 |
|
|
Source: from: Handbook of Mathematical Functions, M. Abramowitz and I. A. Stegun, eds., National Bureau of Standards, Applied Mathematics Series 55, Washington, D.C., 1972.
©2001 CRC Press LLC
Table 84. DIFFUSION IN METALLIC SYSTEMS*
(SHEET 1 OF 34)
|
|
|
|
Temperature |
Activation |
Frequency |
|
|
|
|
energy, Q |
factor, Do |
|
|
|
Crystalline |
Purity |
Range |
||
Metal |
Tracer |
Form |
(%) |
(˚C) |
(kcal • mol–1) |
(cm2 • s–1) |
|
|
|
|
|
|
|
|
|
|
|
|
|
|
Aluminum |
Ag110 |
S |
99.999 |
371–655 |
27.83 |
0.118 |
|
Al27 |
S |
|
450–650 |
34.0 |
1.71 |
|
Au198 |
S |
99.999 |
423–609 |
27.0 |
0.077 |
|
Cd115 |
S |
99.999 |
441–631 |
29.7 |
1.04 |
|
Ce141 |
P |
99.995 |
450–630 |
26.60 |
1.9 x 10⁻⁶ |
|
Co60 |
S |
99.999 |
369–655 |
27.79 |
0.131 |
|
Cr51 |
S |
99.999 |
422–654 |
41.74 |
464 |
|
Cu64 |
S |
99.999 |
433–652 |
32.27 |
0.647 |
|
Fe59 |
S |
99.99 |
550–636 |
46.0 |
135 |
|
Ga72 |
S |
99.999 |
406–652 |
29.24 |
0.49 |
|
Ge71 |
S |
99.999 |
401–653 |
28.98 |
0.481 |
|
In114 |
P |
99.99 |
400–600 |
27.6 |
0.123 |
|
|
|
|
|
|
|
Source: data from Askill, J.,in Handbook of Chemistry and Physics, 55th ed.,Weast, R.C., Ed., CRC Press, Cleveland,1974, F61.
©2001 CRC Press LLC

Table 84. DIFFUSION IN METALLIC SYSTEMS*
(SHEET 2 OF 34)
|
|
|
|
Temperature |
Activation |
Frequency |
|
|
|
|
energy, Q |
factor, Do |
|
|
|
Crystalline |
Purity |
Range |
||
Metal |
Tracer |
Form |
(%) |
(˚C) |
(kcal • mol–1) |
(cm2 • s–1) |
|
|
|
|
|
|
|
|
|
|
|
|
|
|
Aluminum (con’t) |
La140 |
P |
99.995 |
500–630 |
27.0 |
1.4 x 10⁻⁶ |
|
Mn54 |
P |
99.99 |
450–650 |
28.8 |
0.22 |
|
Mo99 |
P |
99.995 |
400–630 |
13.1 |
1.04 x 10⁻⁹ |
|
Nb95 |
P |
99.95 |
350–480 |
19.65 |
1.66 x 10⁻⁷ |
|
Nd147 |
P |
99.995 |
450–630 |
25.0 |
4.8 x 10⁻⁷ |
|
Ni63 |
P |
99.99 |
360–630 |
15.7 |
2.9 x 10⁻⁸ |
|
Pd103 |
P |
99.995 |
400–630 |
20.2 |
1.92 x 10⁻⁷ |
|
Pr142 |
P |
99.995 |
520–630 |
23.87 |
3.58 x 10⁻⁷ |
|
Sb124 |
P |
|
448–620 |
29.1 |
0.09 |
|
Sm153 |
P |
99.995 |
450–630 |
22.88 |
3.45 x 10⁻⁷ |
|
Sn113 |
P |
|
400–600 |
28.5 |
0.245 |
|
V48 |
P |
99.995 |
400–630 |
19.6 |
6.05 x 10⁻⁸ |
|
|
|
|
|
|
|
Source: data from Askill, J.,in Handbook of Chemistry and Physics, 55th ed.,Weast, R.C., Ed., CRC Press, Cleveland,1974, F61.
©2001 CRC Press LLC

Table 84. DIFFUSION IN METALLIC SYSTEMS*
(SHEET 3 OF 34)
|
|
|
|
Temperature |
Activation |
Frequency |
|
|
|
|
energy, Q |
factor, Do |
|
|
|
Crystalline |
Purity |
Range |
||
Metal |
Tracer |
Form |
(%) |
(˚C) |
(kcal • mol–1) |
(cm2 • s–1) |
|
|
|
|
|
|
|
|
|
|
|
|
|
|
Aluminum (con’t) |
Zn65 |
S |
99.999 |
357–653 |
28.86 |
0.259 |
Beryllium |
Ag110 |
S c |
99.75 |
650–900 |
43.2 |
1.76 |
|
||||||
|
Ag110 |
S||c |
99.75 |
650–900 |
39.3 |
0.43 |
|
Be7 |
S c |
99.75 |
565–1065 |
37.6 |
0.52 |
|
Be7 |
S||c |
99.75 |
565–1065 |
39.4 |
0.62 |
|
Fe59 |
S |
99.75 |
700–1076 |
51.6 |
0.67 |
|
Ni63 |
P |
|
800–1250 |
58.0 |
0.2 |
Cadmium |
Ag110 |
S |
99.99 |
180–300 |
25.4 |
2.21 |
|
Cd115 |
S |
99.95 |
110–283 |
19.3 |
0.14 |
|
Zn65 |
S |
99.99 |
180–300 |
19.0 |
0.0016 |
|
|
|
|
|
|
|
Source: data from Askill, J.,in Handbook of Chemistry and Physics, 55th ed.,Weast, R.C., Ed., CRC Press, Cleveland,1974, F61.
©2001 CRC Press LLC

Table 84. DIFFUSION IN METALLIC SYSTEMS*
(SHEET 4 OF 34)
|
|
|
|
Temperature |
Activation |
Frequency |
|
|
|
|
energy, Q |
factor, Do |
|
|
|
Crystalline |
Purity |
Range |
||
Metal |
Tracer |
Form |
(%) |
(˚C) |
(kcal • mol–1) |
(cm2 • s–1) |
|
|
|
|
|
|
|
|
|
|
|
|
|
|
Calcium |
C14 |
|
99.95 |
550–800 |
29.8 |
3.2 x 10⁻⁵ |
|
Ca45 |
|
99.95 |
500–800 |
38.5 |
8.3 |
|
Fe59 |
|
99.95 |
500–800 |
23.3 |
2.7 x 10⁻³ |
|
Ni63 |
|
99.95 |
550–800 |
28.9 |
1.0 x 10⁻⁶ |
|
U235 |
|
99.95 |
500–700 |
34.8 |
l.l x 10–5 |
Carbon |
Ag110 |
c |
|
750–1050 |
64.3 |
9280 |
|
C14 |
c |
|
2000–2200 |
163 |
5 |
|
Ni63 |
|
540–920 |
47.2 |
102 |
|
|
Ni63 |
||c |
|
750–1060 |
53.3 |
2.2 |
|
Th228 |
c |
|
1400–2200 |
145.4 |
1.33 x 10⁻⁵ |
|
Th228 |
||c |
|
1800–2200 |
114.7 |
2.48 |
|
U232 |
c |
|
140~2200 |
115.0 |
6760 |
|
U232 |
||c |
|
1400 1820 |
129.5 |
385 |
|
|
|
|
|
|
|
Source: data from Askill, J.,in Handbook of Chemistry and Physics, 55th ed.,Weast, R.C., Ed., CRC Press, Cleveland,1974, F61.
©2001 CRC Press LLC

Table 84. DIFFUSION IN METALLIC SYSTEMS*
(SHEET 5 OF 34)
|
|
|
|
Temperature |
Activation |
Frequency |
|
|
|
|
energy, Q |
factor, Do |
|
|
|
Crystalline |
Purity |
Range |
||
Metal |
Tracer |
Form |
(%) |
(˚C) |
(kcal • mol–1) |
(cm2 • s–1) |
|
|
|
|
|
|
|
|
|
|
|
|
|
|
Chromium |
C14 |
P |
|
120–1500 |
26.5 |
9.0 x 10⁻³ |
|
Cr51 |
P |
99.98 |
1030–1545 |
73.7 |
0.2 |
|
Fe59 |
P |
99.8 |
980–1420 |
79.3 |
0.47 |
|
Mo99 |
P |
|
1100–1420 |
58.0 |
2.7 x 10⁻³ |
Cobalt |
C14 |
P |
99.82 |
600–1400 |
34.0 |
0.21 |
|
Co60 |
P |
99.9 |
1100–1405 |
67.7 |
0.83 |
|
Fe59 |
P |
99.9 |
1104–1303 |
62.7 |
0.21 |
|
Ni63 |
P |
|
1192–1297 |
60.2 |
0.10 |
|
S35 |
P |
99.99 |
1150–1250 |
5.4 |
1.3 |
Copper |
Ag110 |
S, P |
|
580–980 |
46.5 |
0.61 |
|
As76 |
P |
|
810–1075 |
42.13 |
0.20 |
|
Au193 |
S, P |
|
400–1050 |
42.6 |
0.03 |
|
Cd115 |
S |
99.98 |
725–950 |
45.7 |
0.935 |
|
|
|
|
|
|
|
Source: data from Askill, J.,in Handbook of Chemistry and Physics, 55th ed.,Weast, R.C., Ed., CRC Press, Cleveland,1974, F61.
©2001 CRC Press LLC

Table 84. DIFFUSION IN METALLIC SYSTEMS*
(SHEET 6 OF 34)
|
|
|
|
Temperature |
Activation |
Frequency |
|
|
|
|
energy, Q |
factor, Do |
|
|
|
Crystalline |
Purity |
Range |
||
Metal |
Tracer |
Form |
(%) |
(˚C) |
(kcal • mol–1) |
(cm2 • s–1) |
|
|
|
|
|
|
|
|
|
|
|
|
|
|
Copper (Con’t) |
Ce141 |
P |
99.999 |
766–947 |
27.6 |
2.17 x 10⁻³ |
|
Cr51 |
S, P |
|
800–1070 |
53.5 |
1.02 |
|
Co60 |
S |
99.998 |
701–1077 |
54.1 |
1.93 |
|
Cu67 |
S |
99.999 |
698–1061 |
50.5 |
0.78 |
|
Eu152 |
P |
99.999 |
750–970 |
26.85 |
1.17 x 10⁻⁷ |
|
Fe59 |
S. P |
|
460–1070 |
52.0 |
1.36 |
|
Ga72 |
|
|
_ |
45.90 |
0.55 |
|
Ge68 |
S |
99.998 |
653–1015 |
44.76 |
0.397 |
|
Hg203 |
P |
|
_ |
44.0 |
0.35 |
|
Lu177 |
P |
99.999 |
857–1010 |
26.15 |
4.3 x 10⁻⁹ |
|
Mn54 |
S |
99.99 |
754–950 |
91.4 |
107 |
|
Nb95 |
P |
99.999 |
807–906 |
60.06 |
2.04 |
|
|
|
|
|
|
|
Source: data from Askill, J.,in Handbook of Chemistry and Physics, 55th ed.,Weast, R.C., Ed., CRC Press, Cleveland,1974, F61.
©2001 CRC Press LLC

Table 84. DIFFUSION IN METALLIC SYSTEMS*
(SHEET 7 OF 34)
|
|
|
|
Temperature |
Activation |
Frequency |
|
|
|
|
energy, Q |
factor, Do |
|
|
|
Crystalline |
Purity |
Range |
||
Metal |
Tracer |
Form |
(%) |
(˚C) |
(kcal • mol–1) |
(cm2 • s–1) |
|
|
|
|
|
|
|
|
|
|
|
|
|
|
Copper (Con’t) |
Ni63 |
P |
|
620–1080 |
53.8 |
1.1 |
|
Pd102 |
S |
99.999 |
807–1056 |
54.37 |
1.71 |
|
Pm147 |
P |
99.999 |
720–955 |
27.5 |
3.62 x 10⁻⁸ |
|
Pt195 |
P |
|
843–997 |
37.5 |
4.8 x 10⁻⁴ |
|
S35 |
S |
99.999 |
800–1000 |
49.2 |
23 |
|
Sb124 |
S |
99.999 |
600–1000 |
42.0 |
0.34 |
|
Sn113 |
P |
|
680–910 |
45.0 |
0.11 |
|
Tb160 |
P |
99.999 |
770–980 |
27.45 |
8.96 x 10⁻⁹ |
|
Tl204 |
S |
99.999 |
785–996 |
43.3 |
0.71 |
|
Tm170 |
P |
99.999 |
705–950 |
24.15 |
7.28 x 10⁻⁹ |
|
Zn65 |
P |
99.999 |
890–1000 |
47.50 |
0.73 |
|
|
|
|
|
|
|
Source: data from Askill, J.,in Handbook of Chemistry and Physics, 55th ed.,Weast, R.C., Ed., CRC Press, Cleveland,1974, F61.
©2001 CRC Press LLC

Table 84. DIFFUSION IN METALLIC SYSTEMS*
(SHEET 8 OF 34)
|
|
|
|
Temperature |
Activation |
Frequency |
|
|
|
|
energy, Q |
factor, Do |
|
|
|
Crystalline |
Purity |
Range |
||
Metal |
Tracer |
Form |
(%) |
(˚C) |
(kcal • mol–1) |
(cm2 • s–1) |
|
|
|
|
|
|
|
|
|
|
|
|
|
|
Germanium |
Cd115 |
S |
|
750–950 |
102.0 |
1.75 x 10⁹ |
|
Fe59 |
S |
|
775–930 |
24.8 |
0.13 |
|
Ge71 |
S |
|
766–928 |
68.5 |
7.8 |
|
In114 |
S |
|
600–920 |
39.9 |
2.9 x 10⁻⁴ |
|
Sb124 |
S |
|
720–900 |
50.2 |
0.22 |
|
Te125 |
S |
|
770–900 |
56.0 |
2.0 |
|
Tl204 |
S |
|
800–930 |
78.4 |
1700 |
Gold |
Ag110 |
S |
99.99 |
699–1007 |
40.2 |
0.072 |
|
Au198 |
S |
99.97 |
850–1050 |
42.26 |
0.107 |
|
Co60 |
P |
99.93 |
702–948 |
41.6 |
0.068 |
|
Fe59 |
P |
99.93 |
701–948 |
41.6 |
0.082 |
|
|
|
|
|
|
|
Source: data from Askill, J.,in Handbook of Chemistry and Physics, 55th ed.,Weast, R.C., Ed., CRC Press, Cleveland,1974, F61.
©2001 CRC Press LLC

Table 84. DIFFUSION IN METALLIC SYSTEMS*
(SHEET 9 OF 34)
|
|
|
|
Temperature |
Activation |
Frequency |
|
|
|
|
energy, Q |
factor, Do |
|
|
|
Crystalline |
Purity |
Range |
||
Metal |
Tracer |
Form |
(%) |
(˚C) |
(kcal • mol–1) |
(cm2 • s–1) |
|
|
|
|
|
|
|
|
|
|
|
|
|
|
Gold (Con’t) |
Hg203 |
S |
99.994 |
600–1027 |
37.38 |
0.116 |
|
Ni63 |
P |
99.96 |
880–940 |
46.0 |
0.30 |
|
Pt195 |
P, S |
99.98 |
800–1060 |
60.9 |
7.6 |
β–Hafnium |
Hf181 |
P |
97.9 |
1795–1995 |
38.7 |
1.2 x10⁻³ |
Indium |
Ag110 |
S c |
99.99 |
25–140 |
12.8 |
0.52 |
|
Ag110 |
S||c |
99.99 |
25–140 |
11.5 |
0.11 |
|
Au198 |
S |
99.99 |
25–140 |
6.7 |
9 x 10⁻³ |
|
In114 |
S c |
99.99 |
44–144 |
18.7 |
3.7 |
|
In114 |
S||c |
99.99 |
44–144 |
18.7 |
2.7 |
|
Tl204 |
S |
99.99 |
49–157 |
15.5 |
0.049 |
|
|
|
|
|
|
|
Source: data from Askill, J.,in Handbook of Chemistry and Physics, 55th ed.,Weast, R.C., Ed., CRC Press, Cleveland,1974, F61.
©2001 CRC Press LLC

Table 84. DIFFUSION IN METALLIC SYSTEMS*
(SHEET 10 OF 34)
|
|
|
|
Temperature |
Activation |
Frequency |
|
|
|
|
energy, Q |
factor, Do |
|
|
|
Crystalline |
Purity |
Range |
||
Metal |
Tracer |
Form |
(%) |
(˚C) |
(kcal • mol–1) |
(cm2 • s–1) |
|
|
|
|
|
|
|
|
|
|
|
|
|
|
α-Iron |
Ag110 |
P |
|
748–888 |
69.0 |
1950 |
|
Au198 |
P |
99.999 |
800–900 |
62.4 |
31 |
|
C14 |
P |
99.98 |
616–844 |
29.3 |
2.2 |
|
Co60 |
P |
99.995 |
638–768 |
62.2 |
7.19 |
|
Cr51 |
P |
99.95 |
775–875 |
57.5 |
2.53 |
|
Cu64 |
P |
99.9 |
800 1050 |
57.0 |
0.57 |
|
Fe55 |
P |
99.92 |
809–889 |
60.3 |
5.4 |
|
K42 |
P |
99.92 |
500–800 |
42.3 |
0.036 |
|
Mn54 |
P |
99.97 |
800–900 |
52.5 |
0.35 |
|
Mo99 |
P |
|
750–875 |
73.0 |
7800 |
|
Ni63 |
P |
99.97 |
680–800 |
56.0 |
1.3 |
|
P32 |
P |
|
860–900 |
55.0 |
2.9 |
|
|
|
|
|
|
|
Source: data from Askill, J.,in Handbook of Chemistry and Physics, 55th ed.,Weast, R.C., Ed., CRC Press, Cleveland,1974, F61.
©2001 CRC Press LLC
Table 84. DIFFUSION IN METALLIC SYSTEMS*
(SHEET 11 OF 34)
|
|
|
|
Temperature |
Activation |
Frequency |
|
|
|
|
energy, Q |
factor, Do |
|
|
|
Crystalline |
Purity |
Range |
||
Metal |
Tracer |
Form |
(%) |
(˚C) |
(kcal • mol–1) |
(cm2 • s–1) |
|
|
|
|
|
|
|
|
|
|
|
|
|
|
α-Iron (Con’t) |
Sb124 |
P |
|
800–900 |
66.6 |
1100 |
|
V48 |
P |
|
755–875 |
55.4 |
1.43 |
|
W185 |
P |
|
755–875 |
55.1 |
0.29 |
γ-Iron |
Be7 |
P |
99.9 |
1100–1350 |
57.6 |
0.1 |
|
C14 |
P |
99.34 |
800–1400 |
34.0 |
0.15 |
|
Co60 |
P |
99.98 |
1138–1340 |
72.9 |
1.25 |
|
Cr51 |
P |
99.99 |
950–1400 |
69.7 |
10.8 |
|
Fe59 |
P |
99.98 |
1171–1361 |
67.86 |
0.49 |
|
Hf181 |
P |
99.99 |
1110–1360 |
97.3 |
3600 |
|
Mn54 |
P |
99.97 |
920–1280 |
62.5 |
0.16 |
|
Ni63 |
P |
99.97 |
930–2050 |
67.0 |
0.77 |
|
|
|
|
|
|
|
Source: data from Askill, J.,in Handbook of Chemistry and Physics, 55th ed.,Weast, R.C., Ed., CRC Press, Cleveland,1974, F61.
©2001 CRC Press LLC

Table 84. DIFFUSION IN METALLIC SYSTEMS*
(SHEET 12 OF 34)
|
|
|
|
Temperature |
Activation |
Frequency |
|
|
|
|
energy, Q |
factor, Do |
|
|
|
Crystalline |
Purity |
Range |
||
Metal |
Tracer |
Form |
(%) |
(˚C) |
(kcal • mol–1) |
(cm2 • s–1) |
|
|
|
|
|
|
|
|
|
|
|
|
|
|
γ-Iron (Con’t) |
P32 |
P |
99.99 |
950–1200 |
43.7 |
0.01 |
|
||||||
|
S35 |
P |
|
900–1250 |
53.0 |
1.7 |
|
V48 |
P |
99.99 |
1120–1380 |
69.3 |
0.28 |
|
W185 |
P |
99.5 |
1050–1250 |
90.0 |
1000 |
δ-Iron |
Co60 |
P |
99.995 |
1428–1521 |
61.4 |
6.38 |
|
Fe59 |
P |
99.95 |
1428–1492 |
57.5 |
2.01 |
|
P32 |
P |
99.99 |
1370–1460 |
55.0 |
2.9 |
Lanthanum |
Au198 |
P |
99.97 |
600–800 |
45.1 |
1.5 |
|
La140 |
P |
99.97 |
690–850 |
18.1 |
2.2 x 10⁻² |
Lead |
Ag110 |
P |
99.9 |
200–310 |
14.4 |
0.064 |
|
Au198 |
S |
99.999 |
190–320 |
10.0 |
8.7 x 10⁻³ |
|
Cd115 |
S |
99.999 |
150–320 |
21.23 |
0.409 |
|
|
|
|
|
|
|
Source: data from Askill, J.,in Handbook of Chemistry and Physics, 55th ed.,Weast, R.C., Ed., CRC Press, Cleveland,1974, F61.
©2001 CRC Press LLC

Table 84. DIFFUSION IN METALLIC SYSTEMS*
(SHEET 13 OF 34)
|
|
|
|
Temperature |
Activation |
Frequency |
|
|
|
|
energy, Q |
factor, Do |
|
|
|
Crystalline |
Purity |
Range |
||
Metal |
Tracer |
Form |
(%) |
(˚C) |
(kcal • mol–1) |
(cm2 • s–1) |
|
|
|
|
|
|
|
|
|
|
|
|
|
|
Lead (Con’t) |
Cu64 |
S |
|
150–320 |
14.44 |
0.046 |
|
Pb204 |
S |
99.999 |
150–320 |
25.52 |
0.887 |
|
Tl205 |
P |
99.999 |
207–322 |
24.33 |
0.511 |
Lithium |
Ag110 |
P |
92.5 |
65–161 |
12.83 |
0.37 |
|
Au195 |
P |
92.5 |
47–153 |
10.49 |
0.21 |
|
Bi |
P |
99.95 |
141–177 |
47.3 |
5.3 x 10¹³ |
|
Cd115 |
P |
92.5 |
80–174 |
16.05 |
2.35 |
|
Cu64 |
P |
99.98 |
51–120 |
9.22 |
0.47 |
|
Ga72 |
P |
99.98 |
58–173 |
12.9 |
0.21 |
|
Hg203 |
P |
99.98 |
58–173 |
14.18 |
1.04 |
|
In114 |
P |
92.5 |
80–175 |
15.87 |
0.39 |
|
|
|
|
|
|
|
Source: data from Askill, J.,in Handbook of Chemistry and Physics, 55th ed.,Weast, R.C., Ed., CRC Press, Cleveland,1974, F61.
©2001 CRC Press LLC

Table 84. DIFFUSION IN METALLIC SYSTEMS*
(SHEET 14 OF 34)
|
|
|
|
Temperature |
Activation |
Frequency |
|
|
|
|
energy, Q |
factor, Do |
|
|
|
Crystalline |
Purity |
Range |
||
Metal |
Tracer |
Form |
(%) |
(˚C) |
(kcal • mol–1) |
(cm2 • s–1) |
|
|
|
|
|
|
|
|
|
|
|
|
|
|
Lithium (Con’t) |
Li6 |
P |
99.98 |
35–178 |
12.60 |
0.14 |
|
Na22 |
P |
92.5 |
52–176 |
12.61 |
0.41 |
|
Pb204 |
P |
99.95 |
129–169 |
25.2 |
160 |
|
Sb124 |
P |
99.95 |
141–176 |
41.5 |
1.6 x 10¹⁰ |
|
Sn113 |
P |
99.95 |
108–174 |
15.0 |
0.62 |
|
Zn65 |
P |
92.5 |
60–175 |
12.98 |
0.57 |
Magnesium |
Ag110 |
P |
99.9 |
476–621 |
28.50 |
0.34 |
|
Fe59 |
P |
99.95 |
400–600 |
21.2 |
4 x 10⁻⁶ |
|
In114 |
P |
99.9 |
472–610 |
28.4 |
5.2 x 10⁻² |
|
Mg28 |
S c |
|
467–635 |
32.5 |
1.5 |
|
|
|
|
|
|
|
Source: data from Askill, J.,in Handbook of Chemistry and Physics, 55th ed.,Weast, R.C., Ed., CRC Press, Cleveland,1974, F61.
©2001 CRC Press LLC

Table 84. DIFFUSION IN METALLIC SYSTEMS*
(SHEET 15 OF 34)
|
|
|
|
Temperature |
Activation |
Frequency |
|
|
|
|
energy, Q |
factor, Do |
|
|
|
Crystalline |
Purity |
Range |
||
Metal |
Tracer |
Form |
(%) |
(˚C) |
(kcal • mol–1) |
(cm2 • s–1) |
|
|
|
|
|
|
|
|
|
|
|
|
|
|
Magnesium (Con’t) |
Mg28 |
S||c |
|
467–635 |
32.2 |
1.0 |
|
Ni63 |
P |
99.95 |
400 600 |
22.9 |
1.2 x 10⁻⁵ |
|
U235 |
P |
99.95 |
500–620 |
27.4 |
1.6 x 10⁻⁵ |
|
Zn65 |
P |
99.9 |
467–620 |
28.6 |
0.41 |
Molybdenum |
C14 |
P |
99.98 |
1200–1600 |
41.0 |
2.04 x 10⁻² |
|
Co60 |
P |
99.98 |
1850–2350 |
106.7 |
18 |
|
Cr51 |
P |
|
1000–1500 |
54.0 |
2.5 x 10⁻⁴ |
|
Cs134 |
S |
99.99 |
1000–1470 |
28.0 |
8.7 x 10⁻¹¹ |
|
K42 |
S |
|
800–1100 |
25.04 |
5.5 x 10⁻⁹ |
|
Mo99 |
P |
|
1850–2350 |
96.9 |
0.5 |
|
Na24 |
S |
|
800–1100 |
21.25 |
2.95 x 10⁻⁹ |
|
Nb95 |
P |
99.98 |
1850–2350 |
108.1 |
14 |
|
|
|
|
|
|
|
Source: data from Askill, J.,in Handbook of Chemistry and Physics, 55th ed.,Weast, R.C., Ed., CRC Press, Cleveland,1974, F61.
©2001 CRC Press LLC

Table 84. DIFFUSION IN METALLIC SYSTEMS*
(SHEET 16 OF 34)
|
|
|
|
Temperature |
Activation |
Frequency |
|
|
|
|
energy, Q |
factor, Do |
|
|
|
Crystalline |
Purity |
Range |
||
Metal |
Tracer |
Form |
(%) |
(˚C) |
(kcal • mol–1) |
(cm2 • s–1) |
|
|
|
|
|
|
|
|
|
|
|
|
|
|
Molybdenum (Con’t) |
P32 |
P |
99.97 |
2000–2200 |
80.5 |
0.19 |
|
Re186 |
P |
|
1700–2100 |
94.7 |
0.097 |
|
S35 |
S |
99.97 |
2220–2470 |
101.0 |
320 |
|
Ta182 |
P |
|
1700–2150 |
83.0 |
3.5 x 10⁻⁴ |
|
U235 |
P |
99.98 |
1500–2000 |
76.4 |
7.6 x 10⁻³ |
|
Wl85 |
P |
99.98 |
1700–2260 |
110 |
1.7 |
Nickel |
Au198 |
S,P |
99.999 |
700–1075 |
55.0 |
0.02 |
|
Be7 |
P |
99.9 |
1020–1400 |
46.2 |
0.019 |
|
Cl4 |
P |
99.86 |
600–1400 |
34.0 |
0.012 |
|
Co60 |
P |
99.97 |
1149–1390 |
65.9 |
1.39 |
|
|
|
|
|
|
|
Source: data from Askill, J.,in Handbook of Chemistry and Physics, 55th ed.,Weast, R.C., Ed., CRC Press, Cleveland,1974, F61.
©2001 CRC Press LLC

Table 84. DIFFUSION IN METALLIC SYSTEMS*
(SHEET 17 OF 34)
|
|
|
|
Temperature |
Activation |
Frequency |
|
|
|
|
energy, Q |
factor, Do |
|
|
|
Crystalline |
Purity |
Range |
||
Metal |
Tracer |
Form |
(%) |
(˚C) |
(kcal • mol–1) |
(cm2 • s–1) |
|
|
|
|
|
|
|
|
|
|
|
|
|
|
Nickel (Con’t) |
Cr51 |
P |
99.95 |
1100–1270 |
65.1 |
1.1 |
|
Cu64 |
P |
99.95 |
1050–1360 |
61.7 |
0.57 |
|
Fe59 |
P |
|
1020–1263 |
58.6 |
0.074 |
|
Mo99 |
P |
|
900–1200 |
51.0 |
1.6 x 10⁻³ |
|
Ni63 |
P |
99.95 |
1042–1404 |
68.0 |
1.9 |
|
Pu238 |
P |
|
1025–1125 |
51.0 |
0.5 |
|
Sb124 |
P |
99.97 |
1020–1220 |
27.0 |
1.8 x 10⁻⁵ |
|
Sn113 |
P |
99.8 |
700–1350 |
58.0 |
0.83 |
|
V48 |
P |
99.99 |
800–1300 |
66.5 |
0.87 |
|
W185 |
P |
99.95 |
1100–1300 |
71.5 |
2.0 |
|
|
|
|
|
|
|
Source: data from Askill, J.,in Handbook of Chemistry and Physics, 55th ed.,Weast, R.C., Ed., CRC Press, Cleveland,1974, F61.
©2001 CRC Press LLC

Table 84. DIFFUSION IN METALLIC SYSTEMS*
(SHEET 18 OF 34)
|
|
|
|
Temperature |
Activation |
Frequency |
|
|
|
|
energy, Q |
factor, Do |
|
|
|
Crystalline |
Purity |
Range |
||
Metal |
Tracer |
Form |
(%) |
(˚C) |
(kcal • mol–1) |
(cm2 • s–1) |
|
|
|
|
|
|
|
|
|
|
|
|
|
|
Niobium |
C14 |
P |
|
800–1250 |
32.0 |
1.09 x 10⁻⁵ |
|
Co60 |
P |
99.85 |
1500–2100 |
70.5 |
0.74 |
|
Cr51 |
S |
|
943–1435 |
83.5 |
0.30 |
|
Fe51 |
P |
99.85 |
1400–2100 |
77.7 |
1.5 |
|
K42 |
S |
|
900–1100 |
22.10 |
2.38 x 10⁻⁷ |
|
Nb95 |
P, S |
99.99 |
878–2395 |
96.0 |
1.1 |
|
P32 |
P |
99.0 |
1300–1800 |
51.5 |
5.1 x 10⁻² |
|
S35 |
S |
99.9 |
1100–1500 |
73.1 |
2600 |
|
Sn113 |
P |
99.85 |
1850–2400 |
78.9 |
0.14 |
|
Ta182 |
P, S |
99.997 |
878–2395 |
99.3 |
1.0 |
|
|
|
|
|
|
|
Source: data from Askill, J.,in Handbook of Chemistry and Physics, 55th ed.,Weast, R.C., Ed., CRC Press, Cleveland,1974, F61.
©2001 CRC Press LLC

Table 84. DIFFUSION IN METALLIC SYSTEMS*
(SHEET 19 OF 34)
|
|
|
|
Temperature |
Activation |
Frequency |
|
|
|
|
energy, Q |
factor, Do |
|
|
|
Crystalline |
Purity |
Range |
||
Metal |
Tracer |
Form |
(%) |
(˚C) |
(kcal • mol–1) |
(cm2 • s–1) |
|
|
|
|
|
|
|
|
|
|
|
|
|
|
Niobium (Cont) |
Ti44 |
S |
|
994–1492 |
86.9 |
0.099 |
|
|
|||||
|
U235 |
P |
99.55 |
1500–2000 |
76.8 |
8.9 x10⁻³ |
|
V48 |
S |
99.99 |
1000–1400 |
85.0 |
2.21 |
|
W185 |
P |
99.8 |
1800–2200 |
91.7 |
5 x 10⁻⁴ |
Palladium |
Pd103 |
S |
99.999 |
1060–1500 |
63.6 |
0.205 |
Phosphorus |
P32 |
P |
|
0–44 |
9.4 |
1.07 x 10⁻³ |
Platinum |
Co60 |
P |
99.99 |
900–1050 |
74.2 |
19.6 |
|
Cu64 |
P |
|
1098–1375 |
59.5 |
0.074 |
|
Pt195 |
P |
99.99 |
1325–1600 |
68.2 |
0.33 |
|
|
|
|
|
|
|
Source: data from Askill, J.,in Handbook of Chemistry and Physics, 55th ed.,Weast, R.C., Ed., CRC Press, Cleveland,1974, F61.
©2001 CRC Press LLC

Table 84. DIFFUSION IN METALLIC SYSTEMS*
(SHEET 20 OF 34)
|
|
|
|
Temperature |
Activation |
Frequency |
|
|
|
|
energy, Q |
factor, Do |
|
|
|
Crystalline |
Purity |
Range |
||
Metal |
Tracer |
Form |
(%) |
(˚C) |
(kcal • mol–1) |
(cm2 • s–1) |
|
|
|
|
|
|
|
|
|
|
|
|
|
|
Potassium |
Au198 |
P |
99.95 |
5.6–52.5 |
3.23 |
1.29 x10⁻³ |
|
K42 |
S |
99.7 |
–52–61 |
9.36 |
0.16 |
|
Na22 |
P |
99.7 |
0–62 |
7.45 |
0.058 |
|
Rb86 |
P |
99.95 |
0.1–59.9 |
8.78 |
0.090 |
γ–Plutonium |
Pu238 |
P |
|
190–310 |
16.7 |
2.1 x 10⁻⁵ |
δ–Plutonium |
Pu238 |
P |
|
350–440 |
23.8 |
4.5 x 10⁻³ |
ε-Plutonium |
Pu238 |
P |
|
500–612 |
18.5 |
2.0 x 10⁻² |
α-Praseodymium |
Ag110 |
P |
99.93 |
610–730 |
25.4 |
0.14 |
|
Au195 |
P |
99.93 |
650–780 |
19.7 |
4.3 x 10⁻² |
|
Co60 |
P |
99.93 |
660–780 |
16.4 |
4.7 x 10⁻² |
|
Zn65 |
P |
99.96 |
766–603 |
24.8 |
0.18 |
|
|
|
|
|
|
|
Source: data from Askill, J.,in Handbook of Chemistry and Physics, 55th ed.,Weast, R.C., Ed., CRC Press, Cleveland,1974, F61.
©2001 CRC Press LLC
Table 84. DIFFUSION IN METALLIC SYSTEMS*
(SHEET 21 OF 34)
|
|
|
|
Temperature |
Activation |
Frequency |
|
|
|
|
energy, Q |
factor, Do |
|
|
|
Crystalline |
Purity |
Range |
||
Metal |
Tracer |
Form |
(%) |
(˚C) |
(kcal • mol–1) |
(cm2 • s–1) |
|
|
|
|
|
|
|
|
|
|
|
|
|
|
β-Praseodymium |
Ag110 |
P |
99.93 |
800–900 |
21.5 |
3.2 x 10⁻² |
|
Au195 |
P |
99.93 |
800–910 |
20.1 |
3.3 x 10⁻² |
|
Ho166 |
P |
99.96 |
800–930 |
26.3 |
9.5 |
|
In114 |
P |
99.96 |
800–930 |
28.9 |
9.6 |
|
La140 |
P |
99.96 |
800–930 |
25.7 |
1.8 |
|
Pr142 |
P |
99.93 |
800–900 |
29.4 |
8.7 |
|
Zn65 |
P |
99.96 |
822–921 |
27.0 |
0.63 |
Selenium |
Fe59 |
P |
|
40–100 |
8.88 |
— |
|
Hg203 |
P |
99.996 |
25–100 |
1.2 |
— |
|
S35 |
S c |
|
60–90 |
29.9 |
1700 |
|
S35 |
S||c |
|
60–90 |
15.6 |
1100 |
|
Se75 |
P |
|
35–140 |
11.7 |
1.4 x 10⁻⁴ |
|
|
|
|
|
|
|
Source: data from Askill, J.,in Handbook of Chemistry and Physics, 55th ed.,Weast, R.C., Ed., CRC Press, Cleveland,1974, F61.
©2001 CRC Press LLC

Table 84. DIFFUSION IN METALLIC SYSTEMS*
(SHEET 22 OF 34)
|
|
|
|
Temperature |
Activation |
Frequency |
|
|
|
|
energy, Q |
factor, Do |
|
|
|
Crystalline |
Purity |
Range |
||
Metal |
Tracer |
Form |
(%) |
(˚C) |
(kcal • mol–1) |
(cm2 • s–1) |
|
|
|
|
|
|
|
|
|
|
|
|
|
|
Silicon |
Au198 |
S |
|
700–1300 |
47.0 |
2.75 x 10⁻³ |
|
C14 |
P |
|
1070–1400 |
67.2 |
0.33 |
|
Cu64 |
P |
|
800–1100 |
23.0 |
4 x 10⁻² |
|
Fe59 |
S |
|
1000–1200 |
20.0 |
6.2 x 10⁻³ |
|
Ni63 |
P |
|
450–800 |
97.5 |
1000 |
|
P32 |
S |
|
1100–1250 |
41.5 |
– |
|
Sb124 |
S |
|
1190–1398 |
91.7 |
12.9 |
|
Si31 |
S |
99.99999 |
1225–1400 |
110.0 |
1800 |
Silver |
Au198 |
P |
99.99 |
718–942 |
48.28 |
0.85 |
|
Ag110 |
S |
99.999 |
640–955 |
45.2 |
0.67 |
|
Cd115 |
S |
99.99 |
592–937 |
41.69 |
0.44 |
|
Co60 |
S |
99.999 |
700–940 |
48.75 |
1.9 |
|
|
|
|
|
|
|
Source: data from Askill, J.,in Handbook of Chemistry and Physics, 55th ed.,Weast, R.C., Ed., CRC Press, Cleveland,1974, F61.
©2001 CRC Press LLC
Table 84. DIFFUSION IN METALLIC SYSTEMS*
(SHEET 23 OF 34)
|
|
|
|
Temperature |
Activation |
Frequency |
|
|
|
|
energy, Q |
factor, Do |
|
|
|
Crystalline |
Purity |
Range |
||
Metal |
Tracer |
Form |
(%) |
(˚C) |
(kcal • mol–1) |
(cm2 • s–1) |
|
|
|
|
|
|
|
|
|
|
|
|
|
|
Silver (Con’t) |
Cu64 |
P |
99.99 |
717–945 |
46.1 |
1.23 |
|
Fe59 |
S |
99.99 |
720–930 |
49.04 |
2.42 |
|
Ge77 |
P |
|
640–870 |
36.5 |
0.084 |
|
Hg203 |
P |
99.99 |
653–948 |
38.1 |
0.079 |
|
In114 |
S |
99.99 |
592–937 |
40.80 |
0.41 |
|
Ni63 |
S |
99.99 |
749–950 |
54.8 |
21.9 |
|
Pb210 |
P |
|
700–865 |
38.1 |
0.22 |
|
Pd102 |
S |
99.999 |
736–939 |
56.75 |
9.56 |
|
Ru103 |
S |
99.99 |
793–945 |
65.8 |
180 |
|
S35 |
S |
99.999 |
600–900 |
40.0 |
1.65 |
|
Sb124 |
P |
99.999 |
780–950 |
39.07 |
0.234 |
|
Sn113 |
S |
99.99 |
592–937 |
39.30 |
0.255 |
|
|
|
|
|
|
|
Source: data from Askill, J.,in Handbook of Chemistry and Physics, 55th ed.,Weast, R.C., Ed., CRC Press, Cleveland,1974, F61.
©2001 CRC Press LLC

Table 84. DIFFUSION IN METALLIC SYSTEMS*
(SHEET 24 OF 34)
|
|
|
|
Temperature |
Activation |
Frequency |
|
|
|
|
energy, Q |
factor, Do |
|
|
|
Crystalline |
Purity |
Range |
||
Metal |
Tracer |
Form |
(%) |
(˚C) |
(kcal • mol–1) |
(cm2 • s–1) |
|
|
|
|
|
|
|
|
|
|
|
|
|
|
Silver (Con’t) |
Te125 |
P |
|
770–940 |
38.90 |
0.47 |
|
Tl204 |
P |
|
640–870 |
37.9 |
0.15 |
|
Zn65 |
S |
99.99 |
640–925 |
41.7 |
0.54 |
Sodium |
Au198 |
P |
99.99 |
1.0–77 |
2.21 |
3.34 x l0–4 |
|
K42 |
P |
99.99 |
0–91 |
8.43 |
0.08 |
|
Na22 |
P |
99.99 |
0–98 |
10.09 |
0.145 |
|
Rb86 |
P |
99.99 |
0–85 |
8.49 |
0.15 |
Tantalum |
C14 |
P |
|
1450–2200 |
40.3 |
1.2 x 10⁻² |
|
Fe59 |
P |
|
930–1240 |
71.4 |
0.505 |
|
Mo99 |
P |
|
1750–2220 |
81.0 |
1.8 x 10⁻³ |
|
Nb95 |
P, S |
99.996 |
921–2484 |
98.7 |
0.23 |
|
S35 |
P |
99.0 |
1970–2110 |
70.0 |
100 |
|
Ta182 |
P, S |
99.996 |
1250–2200 |
98.7 |
1.24 |
|
|
|
|
|
|
|
Source: data from Askill, J.,in Handbook of Chemistry and Physics, 55th ed.,Weast, R.C., Ed., CRC Press, Cleveland,1974, F61.
©2001 CRC Press LLC

Table 84. DIFFUSION IN METALLIC SYSTEMS*
(SHEET 25 OF 34)
|
|
|
|
Temperature |
Activation |
Frequency |
|
|
|
|
energy, Q |
factor, Do |
|
|
|
Crystalline |
Purity |
Range |
||
Metal |
Tracer |
Form |
(%) |
(˚C) |
(kcal • mol–1) |
(cm2 • s–1) |
|
|
|
|
|
|
|
|
|
|
|
|
|
|
Tellurium |
Hg203 |
P |
|
270–440 |
18.7 |
3.14 x 10⁻⁵ |
|
Se75 |
P |
|
320–440 |
28.6 |
2.6 x 10⁻² |
|
Tl204 |
P |
|
360–430 |
41.0 |
320 |
|
Te127 |
S c |
99.9999 |
300–400 |
46.7 |
3.91 x 10⁴ |
|
Te127 |
S||c |
99.9999 |
300–400 |
35.5 |
130 |
α-Thallium |
Ag110 |
P c |
99.999 |
80–250 |
11.8 |
3.8 x 10⁻² |
|
Ag110 |
P||c |
99.999 |
80–250 |
11.2 |
2.7 x 10⁻² |
|
Au198 |
P c |
99.999 |
110–260 |
2.8 |
2.0 x 10⁻⁵ |
|
Au198 |
P||c |
99.999 |
110–260 |
5.2 |
5.3 x 10⁻⁴ |
|
Tl204 |
S c |
99.9 |
135–230 |
22.6 |
0.4 |
|
Tl204 |
S||c |
99.9 |
135–230 |
22.9 |
0.4 |
|
|
|
|
|
|
|
Source: data from Askill, J.,in Handbook of Chemistry and Physics, 55th ed.,Weast, R.C., Ed., CRC Press, Cleveland,1974, F61.
©2001 CRC Press LLC

Table 84. DIFFUSION IN METALLIC SYSTEMS*
(SHEET 26 OF 34)
|
|
|
|
Temperature |
Activation |
Frequency |
|
|
|
|
energy, Q |
factor, Do |
|
|
|
Crystalline |
Purity |
Range |
||
Metal |
Tracer |
Form |
(%) |
(˚C) |
(kcal • mol–1) |
(cm2 • s–1) |
|
|
|
|
|
|
|
|
|
|
|
|
|
|
β-Thallium |
Ag110 |
P |
99.999 |
230–310 |
11.9 |
4.2 x 10⁻² |
|
Au198 |
P |
99.999 |
230–310 |
6.0 |
5.2 x 10⁻⁴ |
|
Tl204 |
S |
99.9 |
230–280 |
20.7 |
0.7 |
α-Thorium |
Pa231 |
P |
99.85 |
770–910 |
74.7 |
126 |
|
Th228 |
P |
99.85 |
720–880 |
716 |
395 |
|
U233 |
P |
99.85 |
700–880 |
79.3 |
2210 |
Tin |
Ag110 |
S c |
|
135–225 |
18.4 |
0.18 |
|
Ag110 |
S||c |
|
135–225 |
12.3 |
7.1 x 10⁻³ |
|
Au198 |
S c |
|
135–225 |
17.7 |
0.16 |
|
Au198 |
S||c |
|
135–225 |
11.0 |
5.8 x 10⁻³ |
|
Co60 |
S,P |
|
140–217 |
22.0 |
5.5 |
|
In114 |
S c |
99.998 |
181–221 |
25.8 |
34.1 |
|
|
|
|
|
|
|
Source: data from Askill, J.,in Handbook of Chemistry and Physics, 55th ed.,Weast, R.C., Ed., CRC Press, Cleveland,1974, F61.
©2001 CRC Press LLC

Table 84. DIFFUSION IN METALLIC SYSTEMS*
(SHEET 27 OF 34)
|
|
|
|
Temperature |
Activation |
Frequency |
|
|
|
|
energy, Q |
factor, Do |
|
|
|
Crystalline |
Purity |
Range |
||
Metal |
Tracer |
Form |
(%) |
(˚C) |
(kcal • mol–1) |
(cm2 • s–1) |
|
|
|
|
|
|
|
|
|
|
|
|
|
|
Tin (Con’t) |
In114 |
S||c |
99.998 |
181–221 |
25.6 |
12.2 |
|
Sn113 |
S c |
99.999 |
160–226 |
25.1 |
10.7 |
|
Sn113 |
S||c |
99.999 |
160–226 |
25.6 |
7.7 |
|
Tl204 |
P |
99.999 |
137–216 |
14.7 |
1.2 x 10⁻³ |
α-Titanium |
Ti44 |
P |
99.99 |
700–850 |
35.9 |
8.6 x 10⁻⁶ |
β-Titanium |
Ag110 |
P |
99.95 |
940 1570 |
43.2 |
3 x 10⁻³ |
|
Be7 |
P |
99.96 |
915–1300 |
40.2 |
0.8 |
|
C14 |
P |
99.62 |
1100–1600 |
20.0 |
3.02 x 10⁻³ |
|
Cr51 |
P |
99.7 |
950–1600 |
35.1 |
5 x 10⁻³ |
|
Co60 |
P |
99.7 |
900–1600 |
30.6 |
1.2 x 10⁻² |
|
Fe59 |
P |
99.7 |
900–1600 |
31.6 |
7.8 x 10⁻³ |
|
Mo99 |
P |
99.7 |
900–1600 |
43.0 |
8.0 x 10⁻³ |
|
Mn54 |
P |
99.7 |
900–1600 |
33.7 |
6.1 x 10⁻³ |
|
|
|
|
|
|
|
Source: data from Askill, J.,in Handbook of Chemistry and Physics, 55th ed.,Weast, R.C., Ed., CRC Press, Cleveland,1974, F61.
©2001 CRC Press LLC

Table 84. DIFFUSION IN METALLIC SYSTEMS*
(SHEET 28 OF 34)
|
|
|
|
Temperature |
Activation |
Frequency |
|
|
|
|
energy, Q |
factor, Do |
|
|
|
Crystalline |
Purity |
Range |
||
Metal |
Tracer |
Form |
(%) |
(˚C) |
(kcal • mol–1) |
(cm2 • s–1) |
|
|
|
|
|
|
|
|
|
|
|
|
|
|
β-Titanium (Con’t) |
Nb95 |
P |
99.7 |
1000–1600 |
39.3 |
5.0 x 10⁻³ |
|
Ni63 |
P |
99.7 |
925–1600 |
29.6 |
9.2 x 10⁻³ |
|
P32 |
P |
99.7 |
950–1600 |
24.1 |
3.62x10⁻³ |
|
Sc46 |
P |
99.95 |
940–1590 |
32.4 |
4.0 x 10⁻³ |
|
Sn113 |
P |
99.7 |
950–1600 |
31.6 |
3.8 x 10⁻⁴ |
|
Ti44 |
P |
99.95 |
900–1540 |
31.2 |
3.58 x 10⁻⁴ |
|
U235 |
P |
99.9 |
900–400 |
29.3 |
5.1 x 10⁻⁴ |
|
V48 |
P |
99.95 |
900–1545 |
32.2 |
3.1 x 10⁻⁴ |
|
W185 |
P |
99.94 |
900–1250 |
43.9 |
3.6 x 10⁻³ |
|
Zr95 |
P |
98.94 |
920–1500 |
35.4 |
4.7 x 10⁻³ |
Tungsten |
C14 |
P |
99.51 |
1200–1600 |
53.5 |
8.91 x 10⁻³ |
|
Fe59 |
P |
|
940–1240 |
66.0 |
1.4 x 10⁻² |
|
Mo99 |
P |
|
1700–2100 |
101.0 |
0.3 |
|
|
|
|
|
|
|
Source: data from Askill, J.,in Handbook of Chemistry and Physics, 55th ed.,Weast, R.C., Ed., CRC Press, Cleveland,1974, F61.
©2001 CRC Press LLC

Table 84. DIFFUSION IN METALLIC SYSTEMS*
(SHEET 29 OF 34)
|
|
|
|
Temperature |
Activation |
Frequency |
|
|
|
|
energy, Q |
factor, Do |
|
|
|
Crystalline |
Purity |
Range |
||
Metal |
Tracer |
Form |
(%) |
(˚C) |
(kcal • mol–1) |
(cm2 • s–1) |
|
|
|
|
|
|
|
|
|
|
|
|
|
|
Tungsten (Con’t) |
Nb95 |
P |
99.99 |
1305–2367 |
137.6 |
3.01 |
|
Re186 |
S |
|
2100–2400 |
141.0 |
19.5 |
|
Ta182 |
P |
99.99 |
1305–2375 |
139.9 |
3.05 |
|
W185 |
P |
99.99 |
1800–2403 |
140.3 |
1.88 |
α–Uranium |
U234 |
P |
|
580–650 |
40.0 |
2 x 10⁻³ |
β–Uranium |
Co60 |
P |
99.999 |
692–763 |
27.45 |
1.5 x 10⁻² |
|
U235 |
P |
|
690–750 |
44.2 |
2.8 x10⁻³ |
γ-Uranium |
Au195 |
P |
99.99 |
785–1007 |
30.4 |
4.86 x 10⁻³ |
|
Co60 |
P |
99.99 |
783–989 |
12.57 |
3.51 x 10⁻⁴ |
|
Cr51 |
P |
99.99 |
797–1037 |
24.46 |
5.37 X 10⁻³ |
|
Cu64 |
P |
99.99 |
787–1039 |
24.06 |
1.96 x 10⁻³ |
|
|
|
|
|
|
|
Source: data from Askill, J.,in Handbook of Chemistry and Physics, 55th ed.,Weast, R.C., Ed., CRC Press, Cleveland,1974, F61.
©2001 CRC Press LLC

Table 84. DIFFUSION IN METALLIC SYSTEMS*
(SHEET 30 OF 34)
|
|
|
|
Temperature |
Activation |
Frequency |
|
|
|
|
energy, Q |
factor, Do |
|
|
|
Crystalline |
Purity |
Range |
||
Metal |
Tracer |
Form |
(%) |
(˚C) |
(kcal • mol–1) |
(cm2 • s–1) |
|
|
|
|
|
|
|
|
|
|
|
|
|
|
γ-Uranium (Con’t) |
Fe55 |
P |
99.99 |
787–990 |
12.0 |
2.69 x 10⁻⁴ |
|
Mn54 |
P |
99.99 |
787–939 |
13.88 |
1.81 x 10⁻⁴ |
|
Nb95 |
P |
99.99 |
791–1102 |
39.65 |
4.87 x 10⁻² |
|
Ni63 |
P |
99.99 |
787–1039 |
15.66 |
5.36 x10⁻⁴ |
|
U233 |
P |
99.99 |
800–1070 |
28.5 |
2.33 x 10⁻³ |
|
Zr95 |
P |
|
800–1000 |
16.5 |
3.9 x 10⁻⁴ |
Vanadium |
C14 |
P |
99.7 |
845–1130 |
27.3 |
4.9 x 10⁻³ |
|
Cr51 |
P |
99.8 |
960–1200 |
64.6 |
9.54 x10⁻³ |
|
Fe59 |
P |
|
960–1350 |
71.0 |
0.373 |
|
P32 |
P |
99.8 |
1200–1450 |
49.8 |
2.45 x l0–2 |
|
S35 |
P |
99.8 |
1320–1520 |
34.0 |
3.1 x l0–2 |
|
V48 |
S,P |
99.99 |
880–1360 |
73.65 |
0.36 |
|
V48 |
S,P |
99.99 |
1360–1830 |
94.14 |
214.0 |
|
|
|
|
|
|
|
Source: data from Askill, J.,in Handbook of Chemistry and Physics, 55th ed.,Weast, R.C., Ed., CRC Press, Cleveland,1974, F61.
©2001 CRC Press LLC
Table 84. DIFFUSION IN METALLIC SYSTEMS*
(SHEET 31 OF 34)
|
|
|
|
Temperature |
Activation |
Frequency |
|
|
|
|
energy, Q |
factor, Do |
|
|
|
Crystalline |
Purity |
Range |
||
Metal |
Tracer |
Form |
(%) |
(˚C) |
(kcal • mol–1) |
(cm2 • s–1) |
|
|
|
|
|
|
|
|
|
|
|
|
|
|
Yttrium |
Y90 |
S c |
|
900–1300 |
67.1 |
5.2 |
|
Y90 |
S||c |
|
900–1300 |
60.3 |
0.82 |
Zinc |
Ag110 |
S c |
99.999 |
271–413 |
27.6 |
0.45 |
|
Ag110 |
S||c |
99.999 |
271–413 |
26.0 |
0.32 |
|
Au198 |
S c |
99.999 |
315–415 |
29.72 |
0.29 |
|
Au198 |
S||c |
99.999 |
315–415 |
29.73 |
0.97 |
|
Cd115 |
S c |
99.999 |
225–416 |
20.12 |
0.117 |
|
Cd115 |
S||c |
99.999 |
225–416 |
20.54 |
0.114 |
|
Cu64 |
S c |
99.999 |
338–415 |
~20 |
~2 |
|
Cu64 |
S||c |
99.999 |
338–415 |
29.53 |
2.22 |
|
|
|
|
|
|
|
Source: data from Askill, J.,in Handbook of Chemistry and Physics, 55th ed.,Weast, R.C., Ed., CRC Press, Cleveland,1974, F61.
©2001 CRC Press LLC

Table 84. DIFFUSION IN METALLIC SYSTEMS*
(SHEET 32 OF 34)
|
|
|
|
Temperature |
Activation |
Frequency |
|
|
|
|
energy, Q |
factor, Do |
|
|
|
Crystalline |
Purity |
Range |
||
Metal |
Tracer |
Form |
(%) |
(˚C) |
(kcal • mol–1) |
(cm2 • s–1) |
|
|
|
|
|
|
|
|
|
|
|
|
|
|
Zinc (Con’t) |
Ga72 |
S c |
|
240–403 |
18.15 |
0.018 |
|
Ga72 |
S||c |
|
240 403 |
18.4 |
0.016 |
|
Hg203 |
S c |
|
260–413 |
20.18 |
0.073 |
|
Hg203 |
S||c |
|
260–413 |
19.70 |
0.056 |
|
In114 |
S c |
|
271–413 |
19.60 |
0.14 |
|
In114 |
S||c |
|
271–413 |
19.10 |
0.062 |
|
Sn113 |
S c |
|
298–400 |
18.4 |
0.13 |
|
Sn113 |
S||c |
|
298–400 |
19.4 |
0.15 |
|
Zn65 |
S c |
99.999 |
240–418 |
23.0 |
0.18 |
|
Zn65 |
S||c |
99.999 |
240–418 |
21.9 |
0.13 |
|
|
|
|
|
|
|
Source: data from Askill, J.,in Handbook of Chemistry and Physics, 55th ed.,Weast, R.C., Ed., CRC Press, Cleveland,1974, F61.
©2001 CRC Press LLC

Table 84. DIFFUSION IN METALLIC SYSTEMS*
(SHEET 33 OF 34)
|
|
|
|
Temperature |
Activation |
Frequency |
|
|
|
|
energy, Q |
factor, Do |
|
|
|
Crystalline |
Purity |
Range |
||
Metal |
Tracer |
Form |
(%) |
(˚C) |
(kcal • mol–1) |
(cm2 • s–1) |
|
|
|
|
|
|
|
|
|
|
|
|
|
|
α-Zirconium |
Cr51 |
P |
99.9 |
700–850 |
18.0 |
1.19 x 10⁻⁸ |
|
Fe55 |
P |
|
750–840 |
48.0 |
2.5 x 10⁻² |
|
Mo99 |
P |
|
600–850 |
24.76 |
6.22 x 10⁻⁸ |
|
Nb95 |
P |
99.99 |
740–857 |
31.5 |
6.6 x 10⁻⁶ |
|
Sn113 |
P |
|
300–700 |
22.0 |
1.0 x 10⁻⁸ |
|
Ta182 |
P |
99.6 |
700–800 |
70.0 |
100 |
|
V48 |
P |
99.99 |
600–850 |
22.9 |
1.12 x 10⁻⁸ |
|
Zr95 |
P |
99.95 |
750–850 |
45.5 |
5.6 x 10⁻⁴ |
β–Zirconium |
Be7 |
P |
99.7 |
915–1300 |
31.1 |
8.33 x 10⁻² |
|
C14 |
P |
96.6 |
1100–1600 |
34.2 |
3.57 x 10⁻² |
|
Ce141 |
P |
|
880–1600 |
41.4 |
3.16 |
|
Co60 |
P |
99.99 |
920–1600 |
21.82 |
3.26 x 10⁻³ |
|
|
|
|
|
|
|
Source: data from Askill, J.,in Handbook of Chemistry and Physics, 55th ed.,Weast, R.C., Ed., CRC Press, Cleveland,1974, F61.
©2001 CRC Press LLC

Table 84. DIFFUSION IN METALLIC SYSTEMS*
(SHEET 34 OF 34)
|
|
|
|
Temperature |
Activation |
Frequency |
|
|
|
|
energy, Q |
factor, Do |
|
|
|
Crystalline |
Purity |
Range |
||
Metal |
Tracer |
Form |
(%) |
(˚C) |
(kcal • mol–1) |
(cm2 • s–1) |
|
|
|
|
|
|
|
|
|
|
|
|
|
|
β–Zirconium (Con’t) |
Cr51 |
P |
99.9 |
700–850 |
18.0 |
1.19 x 10⁻⁸ |
|
Fe55 |
P |
|
750–840 |
48.0 |
2.5 x 10⁻² |
|
Mo99 |
P |
|
900–1635 |
35.2 |
1.99 x 10⁻⁶ |
|
Nb95 |
P |
|
1230–1635 |
36.6 |
7.8 x 10⁻⁴ |
|
P32 |
P |
99.94 |
950–1200 |
33.3 |
0.33 |
|
Sn113 |
P |
|
300–700 |
22.0 |
1 x 10⁻⁸ |
|
Ta182 |
P |
99.6 |
900–1200 |
27.0 |
5.5 x 10⁻⁵ |
|
U235 |
P |
|
900–1065 |
30.5 |
5.7 x 10⁻⁴ |
|
V48 |
P |
99.99 |
870–1200 |
45.8 |
7.59 x 10⁻³ |
|
V48 |
P |
99.99 |
1200–1400 |
57.7 |
0.32 |
|
W185 |
P |
99.7 |
900–1250 |
55.8 |
0.41 |
|
Zr95 |
P |
|
1100–1500 |
30.1 |
2.4 x 10⁻⁴ |
|
|
|
|
|
|
|
Source: data from Askill, J.,in Handbook of Chemistry and Physics, 55th ed.,Weast, R.C., Ed., CRC Press, Cleveland,1974, F61.
©2001 CRC Press LLC

*The diffusion coefficient DT at a temperature T(K) is given by the following: DT =Do e–Q/RT
For activation energy in KJ/mol, multiply values in Kcal/mol by 4.184. For frequency factor in m2/s, multiply values in cm2/s by 10–4.
Abbreviations:
P= polycrystalline
S = single crystal
c = perpendicular to c direction || c = parallel to c direction
©2001 CRC Press LLC

Table 85. DIFFUSION |
OF METALS INTO METALS |
|||
|
(SHEET 1 OF 11) |
|
||
|
|
|
|
|
|
|
|
Diffusion |
Coefficient |
Diffusing |
Matrix |
|
Temperature |
|
|
(cm2 • hr–1) |
|||
Metal |
Metal |
|
(˚C) |
|
|
|
|
|
|
|
|
|
|
|
Ag |
Al |
|
466 |
6.84–8.1 x10⁻⁷ |
|
|
|
500 |
7.2–3.96 x 10⁻⁸ |
|
|
|
573 |
1.26 x 10⁻⁵ |
|
Pb |
|
220 |
5.40 x 10⁻⁵ |
|
|
|
250 |
1.08 x 10⁻⁴ |
|
|
|
285 |
3.29 x 10⁻⁴ |
|
Sn |
|
500 |
1.73 x 10⁻¹ |
Al |
Cu |
|
500 |
6.12 x 10⁻⁹ |
|
|
|
850 |
7.92 x 10⁻⁶ |
As |
Si |
|
|
0.32 e–82,000⁄RT |
Au |
Ag |
|
456 |
1.76 x 10⁻⁹ |
|
|
|
491 |
0.92–2.38 x 10⁻¹³ |
|
|
|
585 |
3.6 x 10⁻⁸ |
|
|
|
601 |
3.96 x 10⁻⁸ |
|
|
|
624 |
2.5–5 x 10–11 |
|
|
|
717 |
1.04–2.25 x 10⁻⁹ |
|
|
|
729 |
1.76 x 10⁻⁹ |
|
|
|
767 |
1.15 x 10⁻⁶ |
|
|
|
|
|
For diffusion coefficients in m2/s, multiply values in cm2/hr by 2.778 x 10⁻⁸.
Source: data from Loebel, R., in Handbook of Chemistry and Physics, 51st ed., Weast, R. C., Ed., Chemical Rubber, Cleveland, 1970, F-55.
©2001 CRC Press LLC

Table 85. DIFFUSION OF METALS INTO METALS
(SHEET 2 OF 11)
|
|
Diffusion |
Coefficient |
|
Diffusing |
Matrix |
Temperature |
||
(cm2 • hr–1) |
||||
Metal |
Metal |
(˚C) |
||
|
|
|
|
|
|
|
|
|
|
Au (Con’t) |
Ag (Con’t) |
847 |
2.30 x 10⁻⁶ |
|
|
|
858 |
3.63 x 10⁻⁸ |
|
|
|
861 |
3.92 x 10⁻⁸ |
|
|
|
874 |
3.92 x 10⁻⁸ |
|
|
|
916 |
5.40 x 10⁻⁶ |
|
|
|
1040 |
1.17 x 10⁻⁶ |
|
|
|
1120 |
2.29 x 10⁻⁵ |
|
|
|
1189 |
5.42 x 10⁻⁶ |
|
|
Au |
800 |
1.17 x 10⁻⁸ |
|
|
|
900 |
9 x 10⁻⁸ |
|
|
|
1020 |
5.4 x 10⁻⁷ |
|
|
Bi |
500 |
1.88 x 10⁻¹ |
|
|
Cu |
970 |
5.04 x 10⁻⁶ |
|
|
Hg |
11 |
3 x10⁻² |
|
|
Pb |
100 |
8.28 x 10⁻⁸ |
|
|
|
150 |
1.80 x 10⁻⁴ |
|
|
|
200 |
3.10 x 10⁻⁴ |
|
|
|
240 |
1.58 x 10⁻³ |
|
|
|
300 |
5.40 x 10⁻³ |
|
|
|
500 |
1.33 x 10⁻¹ |
|
|
|
|
0.001e–25,000⁄RT |
|
|
Sn |
500 |
1.94 x 10⁻¹ |
|
B |
Si |
|
10.5 e–85,000⁄RT |
|
|
|
|
|
For diffusion coefficients in m2/s, multiply values in cm2/hr by 2.778 x 10⁻⁸.
Source: data from Loebel, R., in Handbook of Chemistry and Physics, 51st ed., Weast, R. C., Ed., Chemical Rubber, Cleveland, 1970, F-55.
©2001 CRC Press LLC

Table 85. DIFFUSION OF METALS INTO METALS
(SHEET 3 OF 11)
|
|
Diffusion |
Coefficient |
|
Diffusing |
Matrix |
Temperature |
||
(cm2 • hr–1) |
||||
Metal |
Metal |
(˚C) |
||
|
|
|
|
|
|
|
|
|
|
Ba |
Hg |
7.8 |
2.17 x 10⁻² |
|
Bi |
Si |
|
1030e–107,000⁄RT |
|
|
Pb |
220 |
1.73 x 10⁻⁷ |
|
|
|
250 |
1.33 x 10⁻⁶ |
|
|
|
285 |
1.58 x 10⁻⁶ |
|
C |
W |
1700 |
1.87 x 10⁻³ |
|
|
Fe |
930 |
7.51–9.18 x 10⁻⁹ |
|
Ca |
Hg |
10.2 |
2.25 x 10⁻² |
|
Cd |
Ag |
650 |
9.36 x 10⁻⁷ |
|
|
|
800 |
4.68 x 10⁻⁶ |
|
|
|
900 |
2.23 x 10⁻⁵ |
|
|
Hg |
8.7 |
6.05 x 10⁻² |
|
|
|
15 |
6.51 x 10⁻² |
|
|
|
20 |
5.47 x 10⁻² |
|
|
|
99.1 |
1.23 x 10⁻¹ |
|
|
Pb |
200 |
4.59 x 10⁻⁷ |
|
|
|
252 |
3.10 x 10⁻⁶ |
|
Cd, 1 atom% |
Pb |
167 |
1.66 x 10⁻⁷ |
|
Ce |
W |
1727 |
3.42 x 10⁻⁶ |
|
|
|
|
|
For diffusion coefficients in m2/s, multiply values in cm2/hr by 2.778 x 10⁻⁸.
Source: data from Loebel, R., in Handbook of Chemistry and Physics, 51st ed., Weast, R. C., Ed., Chemical Rubber, Cleveland, 1970, F-55.
©2001 CRC Press LLC

Table 85. DIFFUSION OF METALS INTO METALS
(SHEET 4 OF 11)
|
|
Diffusion |
Coefficient |
|
Diffusing |
Matrix |
Temperature |
||
(cm2 • hr–1) |
||||
Metal |
Metal |
(˚C) |
||
|
|
|
|
|
|
|
|
|
|
Cs |
Hg |
7.3 |
1.88 x 10⁻² |
|
|
W |
27 |
4.32 x 10⁻³ |
|
|
|
227 |
5.40 x 10⁻⁴ |
|
|
|
427 |
2.88 x 10⁻² |
|
|
|
540 |
1.44 x 10⁻¹ |
|
Cu |
Al |
440 |
1.8 x 10⁻⁷ |
|
|
|
457 |
2.88 x 10⁻⁷ |
|
|
|
540 |
5.04 x 10⁻⁶ |
|
|
|
565 |
4.68–5.00 x 10⁻⁴ |
|
|
Ag |
650 |
1.04 x 10⁻⁶ |
|
|
|
760 |
1.30 x 10⁻⁶ |
|
|
|
895 |
3.38 x 10⁻⁶ |
|
|
Au |
301 |
5.40 x 10⁻¹⁰ |
|
|
|
443 |
8.64 x 10⁻⁹ |
|
|
|
560 |
3.38 x 10⁻⁷ |
|
|
|
604 |
5.10 x 10⁻⁷ |
|
|
|
616 |
7.92 x 10⁻⁷ |
|
|
|
740 |
3.35 x 10⁻⁶ |
|
|
Cu |
650 |
1.15 x 10⁻⁵ |
|
|
|
750 |
2.34 x 10⁻⁸ |
|
|
|
830 |
1 .44 x 10–7 |
|
|
|
|
|
For diffusion coefficients in m2/s, multiply values in cm2/hr by 2.778 x 10⁻⁸.
Source: data from Loebel, R., in Handbook of Chemistry and Physics, 51st ed., Weast, R. C., Ed., Chemical Rubber, Cleveland, 1970, F-55.
©2001 CRC Press LLC

Table 85. DIFFUSION |
OF METALS INTO METALS |
|||
|
(SHEET 5 OF 11) |
|
||
|
|
|
|
|
|
|
|
Diffusion |
Coefficient |
Diffusing |
Matrix |
|
Temperature |
|
|
(cm2 • hr–1) |
|||
Metal |
Metal |
|
(˚C) |
|
|
|
|
|
|
|
|
|
|
|
Cu (Con’t) |
Cu (Con’t) |
|
850 |
9.36 x 10⁻⁷ |
|
|
|
950 |
2.30 x 10⁻⁶ |
|
|
|
1030 |
1.01 x 10⁻⁵ |
|
Ge |
|
700–900 |
1.01± 0.1 x 10⁻¹ |
|
Pt |
|
1041 |
7.83–9 x 10⁻⁸ |
|
|
|
1213 |
5.04 x 10⁻⁷ |
|
|
|
1401 |
6.12 x 10⁻⁶ |
Fe |
Au |
|
753 |
1.94 x 10⁻⁶ |
|
|
|
1003 |
2.70 x 10⁻⁵ |
|
|
|
|
0.0062 e–20,000⁄RT |
Ga |
Si |
|
|
3.6 e–81,000⁄RT |
Ge |
Al |
|
630 |
3.31 x 10⁻¹ |
|
Au |
|
529 |
1.84 x 10⁻¹ |
|
|
|
563 |
2.80 x 10⁻¹ |
|
Ge |
|
766–928 |
7.8 e–68,509⁄RT |
|
|
|
1060–1200•K |
87 e–73,000⁄RT |
Hg |
Cd |
|
156 |
9.36 x 10⁻⁷ |
|
|
|
176 |
2.55 x 10⁻⁶ |
|
|
|
202 |
9 x 10⁻⁶ |
|
Pb |
|
177 |
8.34 x 10⁻⁸ |
|
|
|
197 |
2.09 x 10⁻⁵ |
|
|
|
|
|
For diffusion coefficients in m2/s, multiply values in cm2/hr by 2.778 x 10⁻⁸.
Source: data from Loebel, R., in Handbook of Chemistry and Physics, 51st ed., Weast, R. C., Ed., Chemical Rubber, Cleveland, 1970, F-55.
©2001 CRC Press LLC
Table 85. DIFFUSION OF METALS INTO METALS
(SHEET 6 OF 11)
|
|
Diffusion |
Coefficient |
|
Diffusing |
Matrix |
Temperature |
||
(cm2 • hr–1) |
||||
Metal |
Metal |
(˚C) |
||
|
|
|
|
|
|
|
|
|
|
In |
Ag |
650 |
1.04 x 10⁻⁶ |
|
|
|
800 |
6.84 x 10⁻⁶ |
|
|
|
895 |
4.68 x 10⁻⁵ |
|
|
|
|
16.5 e–90,000⁄RT |
|
K |
Hg |
10.5 |
2.21 x 10⁻² |
|
|
W |
207 |
2.05 x 10⁻² |
|
|
|
317 |
3.6 x 10⁻¹ |
|
|
|
507 |
1.1 x 10+1 |
|
Li |
Hg |
8.2 |
2.75 x 10⁻² |
|
Mg |
Al |
365 |
3.96 x 10⁻⁸ |
|
|
|
395 |
1.98–2.41 x 10⁻⁷ |
|
|
|
420 |
2.38–2.74 x 10⁻⁷ |
|
|
|
440 |
1.19 x 10⁻⁷ |
|
|
|
447 |
9.36 x 10⁻⁷ |
|
|
|
450 |
6.84 x 10⁻⁶ |
|
|
|
500 |
3.96–7.56 x 10⁻⁶ |
|
|
|
577 |
1.58 x 10⁻⁵ |
|
|
Pb |
220 |
4.32 x 10⁻⁷ |
|
Mn |
Cu |
400 |
7.2 x 10⁻¹⁰ |
|
|
|
850 |
4.68 x 10⁻⁷ |
|
|
|
|
|
For diffusion coefficients in m2/s, multiply values in cm2/hr by 2.778 x 10⁻⁸.
Source: data from Loebel, R., in Handbook of Chemistry and Physics, 51st ed., Weast, R. C., Ed., Chemical Rubber, Cleveland, 1970, F-55.
©2001 CRC Press LLC

Table 85. DIFFUSION OF METALS INTO METALS
(SHEET 7 OF 11)
|
|
Diffusion |
Coefficient |
|
Diffusing |
Matrix |
Temperature |
||
(cm2 • hr–1) |
||||
Metal |
Metal |
(˚C) |
||
|
|
|
|
|
|
|
|
|
|
Mo |
W |
1533 |
9.36 x 10⁻¹⁰ |
|
|
|
1770 |
4.32 x 10⁻⁹ |
|
|
|
2010 |
7.92 x 10⁻⁸ |
|
|
|
2260 |
2.81 x 10⁻⁷ |
|
Na |
W |
20 |
2.88 x 10⁻² |
|
|
|
227 |
1.80 |
|
|
|
417 |
9.72 |
|
|
|
527 |
1.19 x 10⁻¹ |
|
Ni |
Au |
800 |
2.77 x 10⁻⁶ |
|
|
|
1003 |
2.48 x 10⁻⁵ |
|
|
Cu |
550 |
2.56 x 10⁻⁹ |
|
|
|
950 |
7.56 x 10⁻⁷ |
|
|
|
320 |
1.26 x 10⁻⁶ |
|
|
Pt |
1043 |
1.81 x 10⁻⁸ |
|
|
|
1241 |
1.73 x 10⁻⁶ |
|
|
|
1401 |
5.40 x 10⁻⁶ |
|
Ni, 1 atom % |
Pb |
285 |
8.34 x 10⁻⁷ |
|
Ni, 3 atom% |
Pb |
252 |
1.25 x 10⁻⁷ |
|
Pb |
Cd |
252 |
2.88 x 10⁻⁸ |
|
|
Pb |
250 |
5.42 x 10⁻⁸ |
|
|
|
285 |
2.92 x 10⁻⁷ |
|
|
Sn |
500 |
1.33 x 10⁻¹ |
|
|
|
|
|
For diffusion coefficients in m2/s, multiply values in cm2/hr by 2.778 x 10⁻⁸.
Source: data from Loebel, R., in Handbook of Chemistry and Physics, 51st ed., Weast, R. C., Ed., Chemical Rubber, Cleveland, 1970, F-55.
©2001 CRC Press LLC

Table 85. DIFFUSION |
OF METALS INTO METALS |
|||
|
(SHEET 8 OF 11) |
|
||
|
|
|
|
|
|
|
|
Diffusion |
Coefficient |
Diffusing |
Matrix |
|
Temperature |
|
|
(cm2 • hr–1) |
|||
Metal |
Metal |
|
(˚C) |
|
|
|
|
|
|
|
|
|
|
|
Pb, 2 atom % |
Hg |
|
9.4 |
6.46 x 10⁻⁹ |
|
|
|
15.6 |
5.71 x 10⁻² |
|
|
|
99.2 |
8 x 10⁻² |
Pd |
Ag |
|
444 |
4.68 x 10⁻⁹ |
|
|
|
571 |
1.33 x 10⁻⁷ |
|
|
|
642 |
4.32 x 10⁻⁷ |
|
|
|
917 |
4.32 x 10⁻⁶ |
|
Au |
|
727 |
2.09 x 10⁻⁸ |
|
|
|
970 |
1.15 x 10⁻⁶ |
|
Cu |
|
490 |
3.24 x 10⁻⁹ |
|
|
|
950 |
9.0–10.44 x 10⁻⁷ |
Po |
Au |
|
470 |
4.59 x 10⁻¹¹ |
|
Al |
|
20 |
1.08 x 10⁻⁹ |
|
|
|
500 |
1.80 x 10⁻⁷ |
|
Bi |
|
150 |
1.80 x 10⁻⁷ |
|
|
|
200 |
1.80 x 10⁻⁶ |
|
Pb |
|
150 |
4.59 x 10⁻¹¹ |
|
|
|
200 |
4.59 x 10⁻⁹ |
|
|
|
310 |
5.41 x 10⁻⁷ |
Pt |
Au |
|
740 |
1.69 x 10⁻⁸ |
|
|
|
986 |
6.12–10.08 x 10⁻⁷ |
|
|
|
|
|
For diffusion coefficients in m2/s, multiply values in cm2/hr by 2.778 x 10⁻⁸.
Source: data from Loebel, R., in Handbook of Chemistry and Physics, 51st ed., Weast, R. C., Ed., Chemical Rubber, Cleveland, 1970, F-55.
©2001 CRC Press LLC

Table 85. DIFFUSION OF METALS INTO METALS
(SHEET 9 OF 11)
|
|
Diffusion |
Coefficient |
|
Diffusing |
Matrix |
Temperature |
||
(cm2 • hr–1) |
||||
Metal |
Metal |
(˚C) |
||
|
|
|
|
|
|
|
|
|
|
Pt (Con’t) |
Cu |
490 |
2.01 x 10⁻⁹ |
|
|
|
960 |
3.96–8.28 x 10⁻⁷ |
|
|
Pb |
490 |
7.04 x 10⁻² |
|
Ra |
Au |
470 |
1.42 x 10⁻⁸ |
|
|
Pt |
470 |
3.42 x 10⁻⁸ |
|
Ra(β+γ) |
Ag |
470 |
1.57 x 10⁻⁸ |
|
Rb |
Hg |
7.3 |
1.92 x 10⁻⁹ |
|
Rh |
Pb |
500 |
1.27 x 10⁻¹ |
|
Sb |
Ag |
650 |
1.37 x 10⁻⁶ |
|
|
|
760 |
5.40 x 10⁻⁶ |
|
|
|
895 |
1.55 x 10⁻⁵ |
|
|
|
|
5.6 e–91,000⁄RT |
|
Si |
Al |
465 |
1.22 x 10⁻⁶ |
|
|
|
510 |
7.2 x 10⁻⁶ |
|
|
|
600 |
3.35 x 10⁻⁵ |
|
|
|
667 |
1.44 x 10⁻¹ |
|
|
|
697 |
3.13 x 10⁻¹ |
|
|
Fe+C* |
1400–1600 |
3.24–5.4 x 10⁻² |
|
Sn |
Ag |
650 |
2.23 x 10⁻⁶ |
|
|
|
895 |
2.63 x 10⁻⁶ |
|
|
|
|
|
For diffusion coefficients in m2/s, multiply values in cm2/hr by 2.778 x 10⁻⁸.
Source: data from Loebel, R., in Handbook of Chemistry and Physics, 51st ed., Weast, R. C., Ed., Chemical Rubber, Cleveland, 1970, F-55.
©2001 CRC Press LLC

Table 85. DIFFUSION OF METALS INTO METALS
(SHEET 10 OF 11)
|
|
Diffusion |
Coefficient |
|
Diffusing |
Matrix |
Temperature |
||
(cm2 • hr–1) |
||||
Metal |
Metal |
(˚C) |
||
|
|
|
|
|
|
|
|
|
|
Sn (Con’t) |
Cu |
400 |
1.69 x 10⁻⁹ |
|
|
|
650 |
2.48 x 10⁻⁷ |
|
|
|
850 |
1.40 x 10⁻⁵ |
|
|
Hg |
10.7 |
6.38 x 10⁻² |
|
|
Pb |
245 |
1.12 x 10⁻⁷ |
|
|
|
250 |
1.83 x 10⁻⁷ |
|
|
|
285 |
5.76 x 10⁻⁷ |
|
Sr |
Hg |
9.4 |
1.96 x 10⁻² |
|
Th |
Mo |
1615 |
1.30 x 10⁻⁶ |
|
|
|
2000 |
3.60 x 10⁻³ |
|
|
Tl |
285 |
8.76 x 10⁻⁷ |
|
|
W |
1782 |
3.96 x 10⁻⁷ |
|
|
|
2027 |
4.03 x 10⁻⁶ |
|
|
|
2127 |
1 .29 x 10–5 |
|
|
|
2227 |
2.45 x 10⁻⁵ |
|
Th (β) |
Pb |
165 |
2.54 x 10⁻¹² |
|
|
|
260 |
2.54 x 10⁻⁸ |
|
|
|
324 |
5.84 x 10⁻⁶ |
|
Tl |
Hg |
11.5 |
3.63 x 10⁻² |
|
|
|
|
|
For diffusion coefficients in m2/s, multiply values in cm2/hr by 2.778 x 10⁻⁸.
Source: data from Loebel, R., in Handbook of Chemistry and Physics, 51st ed., Weast, R. C., Ed., Chemical Rubber, Cleveland, 1970, F-55.
©2001 CRC Press LLC

Table 85. DIFFUSION OF METALS INTO METALS
(SHEET 11 OF 11)
|
|
Diffusion |
Coefficient |
|
Diffusing |
Matrix |
Temperature |
||
(cm2 • hr–1) |
||||
Metal |
Metal |
(˚C) |
||
|
|
|
|
|
|
|
|
|
|
Tl (Con’t) |
Pb |
220 |
1.01 x 10⁻⁷ |
|
|
|
250 |
7.92 x 10⁻⁷ |
|
|
|
270 |
3.96 x 10⁻⁷ |
|
|
|
285 |
1.12 x 10⁻⁶ |
|
|
|
315 |
2.09 x 10⁻⁶ |
|
|
|
|
16.5 e–85,000⁄RT |
|
U |
W |
1727 |
4.68 x 10⁻⁸ |
|
Y |
W |
1727 |
6.55 x 10⁻⁵ |
|
Zn |
Ag |
750 |
1.66 x 10⁻⁵ |
|
|
|
850 |
4.37 x 10⁻⁵ |
|
|
Al |
415 |
9 x 10⁻⁷ |
|
|
|
473 |
1.91 x 10⁻⁶ |
|
|
|
500 |
7.2–13.68 x 10⁻⁶ |
|
|
|
555 |
1.8 x 10⁻⁵ |
|
|
Hg |
11.5 |
9.09 x 10⁻² |
|
|
|
15 |
8.72 x 10⁻² |
|
|
|
99.2 |
1.20 x 10⁻¹ |
|
|
Pb |
285 |
5.84 |
|
Zr |
W |
1727 |
1.17 x 10⁻⁵ |
|
|
|
|
|
For diffusion coefficients in m2/s, multiply values in cm2/hr by 2.778 x 10⁻⁸.
Source: data from Loebel, R., in Handbook of Chemistry and Physics, 51st ed., Weast, R. C., Ed., Chemical Rubber, Cleveland, 1970, F-55.
*Saturated FeC Alloy.
©2001 CRC Press LLC

Table 86. DIFFUSION IN SEMICONDUCTORS*
(SHEET 1 OF 8)
|
|
|
|
Temperature |
|
|
|
Do |
|
Range |
|
|
Diffusing |
E |
of Validity |
||
Semiconductor |
Element |
(cm2 • s–1) |
(eV) |
(˚C) |
|
|
|
|
|
|
|
|
|
|
|
|
|
Aluminum antimonide |
Al |
|
~1.8 |
|
|
(AlSb) |
|
|
|||
|
|
|
|
||
|
Cu |
3.5x10⁻³ |
0.36 |
150–500 |
|
|
Sb |
|
~1.5 |
|
|
|
Zn |
0.33±.15 |
1.93±0.04 |
660–860 |
|
Cadmium selenide |
Se |
2.6x10⁻³ |
1.55 |
700–1800 |
|
(CdSe) |
|||||
|
|
|
|
||
Cadmium sulfide (CdS) |
Ag |
2.5x10+1 |
1.2 |
250–500 |
|
|
Cd |
3.4 |
2.0 |
750–1000 |
|
|
Cu |
1.5x10⁻³ |
0.76 |
450–750 |
|
Cadmium telluride |
Au |
6.7x10+1 |
2.0 |
600–1000 |
|
(CdTe) |
|||||
|
|
|
|
||
|
In |
4.1x10⁻¹ |
1.6 |
450–1000 |
|
Calcium ferrate (III) |
Ca |
30 |
3.7 |
|
|
(CaFe2O4) |
|
||||
|
|
|
|
||
|
Fe |
0.4 |
3.1 |
|
|
α-Calcium metasilicate |
Ca |
7.4x10+4 |
4.8 |
|
|
(CaSiO3) |
|
||||
|
|
|
|
||
Gallium antimonide |
Ga |
3.2x10+3 |
3.15 |
650–700 |
|
(GaSb) |
|||||
|
|
|
|
||
|
In |
1.2x10⁻⁷ |
0.53 |
400–650 |
|
|
Sb |
3.4x10+4 |
3.44 |
650–700 |
|
|
|
8.7x10+2 |
1.13 |
470–570 |
|
|
Sn |
2.4x10⁻⁵ |
0.80 |
320–570 |
|
|
Te |
3.8x10⁻⁴ |
1.2 |
400–650 |
|
|
|
|
|
|
Source: from Bolz, R. E. and Tuve, G. L., Eds., Handbook of Tables for Applied Engineering Science, 2nd ed., CRC Press, Cleveland, 1973, 251.
©2001 CRC Press LLC

Table 86. DIFFUSION IN SEMICONDUCTORS*
(SHEET 2 OF 8)
|
|
|
|
Temperature |
|
|
Do |
|
Range |
|
Diffusing |
E |
of Validity |
|
Semiconductor |
Element |
(cm2 • s–1) |
(eV) |
(˚C) |
|
|
|
|
|
|
|
|
|
|
Gallium arsenide |
Ag |
2.5x10⁻³ |
1.5 |
|
(GaAs) |
|
|||
|
|
|
|
|
|
|
4x10⁻⁴ |
0.8±0.05 |
500–1160 |
|
As |
4x10²¹ |
10.2±1.2 |
1200–1250 |
|
Au |
10–3 |
1.0±0.2 |
740–1024 |
|
Cd |
0.05±0.04 |
2.43±0.06 |
868–1149 |
|
|
b50x10–2 |
2.8a |
|
|
Cu |
0.03 |
0.52 |
100–600 |
|
Ga |
1x10+7 |
5.60±0.32 |
1125–1250 |
|
Li |
0.53 |
1.0 |
250–400 |
|
Mg |
1.4x10⁻⁴ |
1.89 |
|
|
|
2.3x10⁻² |
2.6 |
740–1024 |
|
|
b2.6x10–2 |
2.7a |
|
|
|
b6.5x10–1 |
2.49a |
|
|
|
8.5x10⁻³ |
1.7 |
740–1024 |
|
S |
1.2x10⁻⁴ |
1.8 |
|
|
|
b1.6x10–5 |
1.63a |
|
|
|
2.6x10⁻⁵ |
1.86 |
|
|
|
4x10³ |
4.04±0.15 |
1000–1200 |
|
Se |
3x10³ |
4.16±0.16 |
1000–1200 |
|
Sn |
b3.8x10–2 |
2.7 |
|
|
|
6x10⁻⁴ |
2.5 |
1069–1215 |
|
|
|
|
|
Source: from Bolz, R. E. and Tuve, G. L., Eds., Handbook of Tables for Applied Engineering Science, 2nd ed., CRC Press, Cleveland, 1973, 251.
©2001 CRC Press LLC

Table 86. DIFFUSION IN SEMICONDUCTORS*
(SHEET 3 OF 8)
|
|
|
|
Temperature |
|
|
|
Do |
|
Range |
|
|
Diffusing |
E |
of Validity |
||
Semiconductor |
Element |
(cm2 • s–1) |
(eV) |
(˚C) |
|
|
|
|
|
|
|
|
|
|
|
|
|
Gallium arsenide |
Zn |
b2.5x10–1 |
3.0a |
|
|
(GaAs) (Con’t) |
|
||||
|
|
|
|
||
|
|
3.0x10⁻⁷ |
1.0 |
|
|
|
|
6.0x10⁻⁷ |
0.6 |
|
|
|
|
15±7 |
2.49±0.05 |
800 |
|
Gallium phosphide |
Zn |
1.0 |
2.1 |
700–1300 |
|
(GaP) |
|||||
|
|
|
|
||
Germanium (Ge) |
Ag |
4.4x10⁻² |
1.0 |
700–900 |
|
|
As |
6.3 |
2.4 |
600–850 |
|
|
Au |
2.2x10⁻² |
2.5 |
|
|
|
B |
1.6x10⁻⁹ |
4.6 |
600–850 |
|
|
Cu |
1.9x10⁻⁴ |
0.18 |
600–850 |
|
|
Fe |
1.3x10⁻¹ |
1.1 |
750–850 |
|
|
Ga |
4.0x10+1 |
3.1 |
600–850 |
|
|
Ge |
8.7x10+1 |
3.2 |
750–920 |
|
|
He |
6.1x10⁻³ |
0.69 |
750–850 |
|
|
In |
3x10⁻² |
2.4 |
600–850 |
|
|
Li |
1.3x10⁻⁴ |
0.47 |
200–600 |
|
|
Ni |
8x10⁻¹ |
0.9 |
700–875 |
|
|
P |
2.5 |
2.5 |
600–850 |
|
|
Pb |
– |
3.6 |
600–850 |
|
|
Sb |
4.0 |
2.4 |
600–850 |
|
|
Sn |
1.7x10⁻² |
1.9 |
600–850 |
|
|
Zn |
1.0x10+1 |
2.5 |
600–850 |
|
|
|
|
|
|
Source: from Bolz, R. E. and Tuve, G. L., Eds., Handbook of Tables for Applied Engineering Science, 2nd ed., CRC Press, Cleveland, 1973, 251.
©2001 CRC Press LLC

Table 86. DIFFUSION IN SEMICONDUCTORS*
(SHEET 4 OF 8)
|
|
|
|
Temperature |
|
|
Do |
|
Range |
|
Diffusing |
E |
of Validity |
|
Semiconductor |
Element |
(cm2 • s–1) |
(eV) |
(˚C) |
|
|
|
|
|
|
|
|
|
|
Indium antimonide |
Ag |
1.0x10⁻⁷ |
0.25 |
|
(InSb) |
|
|||
|
|
|
|
|
|
Au |
b7x10–4 |
0.32a |
140–510 |
|
Cd |
b1.0x10–5 |
1.1a |
250–500 |
|
|
1.23x10⁻⁹ |
0.52 |
442–519 |
|
|
1.26 |
1.75 |
|
|
|
1.3x10⁻⁴ |
1.2 |
360–500 |
|
Co |
2.7x10⁻¹¹ |
0.39 |
|
|
|
10–7 |
0.25 |
440–510 |
|
Cu |
3.0x10⁻⁵ |
0.37 |
|
|
|
b9.0x10–4 |
1.08a |
|
|
Fe |
10–7 |
0.25 |
440–510 |
|
Hb |
b4.0x10–6 |
1.17a |
|
|
In |
0.05 |
1.81 |
450–500 |
|
|
1.8x10⁻⁹ |
0.28 |
|
|
Ni |
10–7 |
0.25 |
440–510 |
|
Sb |
0.05 |
1.94 |
450–500 |
|
|
1.4x10⁻⁶ |
0.75 |
|
|
Sn |
5.5x10⁻⁸ |
0.75 |
390–512 |
|
Te |
1.7x10⁻⁷ |
0.57 |
300–500 |
|
Zn |
0.5 |
1.35 |
360–500 |
|
|
1.6x10⁻⁶ |
2.3±0.3 |
360–500 |
|
|
5.5 |
1.6 |
360–500 |
|
(Polycrystal) |
1.7x10⁻⁷ |
0.85 |
390–512 |
|
|
b5.3x10+7 |
2.61 |
|
|
|
|
|
|
Source: from Bolz, R. E. and Tuve, G. L., Eds., Handbook of Tables for Applied Engineering Science, 2nd ed., CRC Press, Cleveland, 1973, 251.
©2001 CRC Press LLC
Table 86. DIFFUSION IN SEMICONDUCTORS*
(SHEET 5 OF 8)
|
|
|
|
Temperature |
|
|
|
Do |
|
Range |
|
|
Diffusing |
E |
of Validity |
||
Semiconductor |
Element |
(cm2 • s–1) |
(eV) |
(˚C) |
|
|
|
|
|
|
|
|
|
|
|
|
|
Indium antimonide |
Zinc (con’t) |
6.3x10+8 |
|
|
|
(High |
2.61 |
|
|||
(InSb) (Con’t) |
|
||||
concentration) |
|
|
|
||
|
|
|
|
||
|
|
b3.7x10–10 |
0.7a |
|
|
|
(Conc. = 2.2 x |
9.0x10⁻¹⁰ |
~0 |
|
|
|
1020 cm–3) |
|
|||
|
(Single crystal) |
1.4x10⁻⁷ |
0.86 |
390–512 |
|
Indium arsenide (InAs) |
Cd |
4.35x10⁻⁴ |
1.17 |
600–900 |
|
|
Cu |
|
0.52a |
|
|
|
Ge |
3.74x10⁻⁶ |
1.17 |
600–900 |
|
|
Mg |
1.98x10⁻⁶ |
1.17 |
600–900 |
|
|
S |
6.78 |
2.20 |
600–900 |
|
|
Se |
12.55 |
2.20 |
600–900 |
|
|
Sn |
1.49x10⁻⁶ |
1.17 |
600–900 |
|
|
Te |
3.43x10⁻⁵ |
1.28 |
600–900 |
|
|
Zn |
3.11x10⁻³ |
1.17 |
600–900 |
|
Indium phosphide |
In |
1x10+5 |
3.85 |
850–1000 |
|
(InP) |
|||||
|
|
|
|
||
|
p |
7x10+10 |
5.65 |
850–1000 |
|
Iron oxide (Fe3O4) |
Fe |
5.2 |
2.4 |
|
|
Lead metasilicate |
Pb |
85 |
2.6 |
|
|
(PbSiO3) |
|
||||
|
|
|
|
||
Lead orthosilicate |
Pb |
8.2 |
2.0 |
|
|
(PbSiO4) |
|
||||
|
|
|
|
||
|
|
|
|
|
Source: from Bolz, R. E. and Tuve, G. L., Eds., Handbook of Tables for Applied Engineering Science, 2nd ed., CRC Press, Cleveland, 1973, 251.
©2001 CRC Press LLC

Table 86. DIFFUSION IN SEMICONDUCTORS*
(SHEET 6 OF 8)
|
|
|
|
Temperature |
|
|
|
Do |
|
Range |
|
|
Diffusing |
E |
of Validity |
||
Semiconductor |
Element |
(cm2 • s–1) |
(eV) |
(˚C) |
|
|
|
|
|
|
|
|
|
|
|
|
|
Mercury selenide |
Sb |
6.3x10⁻⁵ |
0.85 |
540–630 |
|
(HgSe) |
|||||
|
|
|
|
||
Nickel aluminate |
Cr |
1.17x10⁻³ |
2.2 |
|
|
(NiAl2O4) |
|
||||
|
|
|
|
||
|
Fe |
1.33 |
3.5 |
|
|
Nickel chromate (III) |
Cr |
0.74 |
3.1 |
|
|
(NiCr2O4) |
|
||||
|
|
|
|
||
|
Cr |
2.03x10⁻⁵ |
1.9 |
|
|
|
Fe |
1.35x10⁻³ |
2.6 |
|
|
|
Ni |
0.85 |
3.2 |
|
|
Selenium (Se) |
Fe |
1.1x10⁻⁵ |
0.38 |
300–400 |
|
(amorphous) |
|||||
|
|
|
|
||
|
Ge |
9.4x10⁻⁶ |
0.39 |
300–400 |
|
|
In |
5.2x10⁻⁶ |
0.32 |
300–400 |
|
|
Sb |
2.8x10⁻⁸ |
0.29 |
300–400 |
|
|
Se |
7.6x10⁻¹⁰ |
0.14 |
300–400 |
|
|
Sn |
4.8x10⁻⁸ |
0.39 |
300–400 |
|
|
Te |
5.4x10⁻⁶ |
0.53 |
300–400 |
|
|
Tl |
1.4x10⁻⁶ |
0.35 |
300–400 |
|
|
Zn |
3.8x10⁻⁷ |
0.29 |
300–400 |
|
Silicon (Si) |
Al |
8.0 |
3.5 |
1100–1400 |
|
|
Ag |
2x10⁻³ |
1.6 |
1100–1350 |
|
|
As |
3.2x10⁻¹ |
3.5 |
1100–1350 |
|
|
Au |
1.1x10⁻³ |
1.1 |
800–1200 |
|
|
|
|
|
|
Source: from Bolz, R. E. and Tuve, G. L., Eds., Handbook of Tables for Applied Engineering Science, 2nd ed., CRC Press, Cleveland, 1973, 251.
©2001 CRC Press LLC

Table 86. DIFFUSION IN SEMICONDUCTORS*
(SHEET 7 OF 8)
|
|
|
|
Temperature |
|
|
Do |
|
Range |
|
Diffusing |
E |
of Validity |
|
Semiconductor |
Element |
(cm2 • s–1) |
(eV) |
(˚C) |
|
|
|
|
|
|
|
|
|
|
Silicon (Si) (Con’t) |
B |
1.0x10+1 |
3.7 |
950–1200 |
|
Bi |
1.04x10+3 |
4.6 |
1100–1350 |
|
Cu |
4x10⁻¹ |
1.0 |
800–1100 |
|
Fe |
6.2x10⁻³ |
0.86 |
1000–1200 |
|
Ga |
3.6 |
3.5 |
1150–1350 |
|
Hl |
9.4x10⁻³ |
0.47 |
1000–1200 |
|
He |
1.1x10⁻¹ |
0.86 |
1000–1200 |
|
In |
1.65x10+1 |
3.9 |
1100–1350 |
|
Li |
9.4x10⁻³ |
0.78 |
100–800 |
|
P |
1.0x10+1 |
3.7 |
1100–1350 |
|
Sb |
5.6 |
3.9 |
1100–1350 |
|
Tl |
1.65x10+1 |
3.9 |
1100–1350 |
Silicon carbide (SiC) |
Al |
2.0x10⁻¹ |
4.9 |
1800–2250 |
|
B |
1.6x10+1 |
5.6 |
1850–2250 |
|
Cr |
2.3x10⁻¹ |
4.8 |
1700–1900 |
Sulfur (S) |
S |
2.8x10+13 |
2.0 |
>100 |
Tin zinc oxide |
Sn |
2x10+5 |
4.7 |
|
(SnZn2O4) |
|
|||
|
|
|
|
|
|
Zn |
37 |
3.3 |
|
Zinc aluminate |
Zn |
2.5x10+2 |
3.4 |
|
(ZnAl2O4) |
|
|||
|
|
|
|
|
Zinc chromate (III) |
Cr |
8.5 |
3.5 |
|
(ZnCr2O4) |
|
|||
|
|
|
|
|
|
Zn |
60 |
3.7 |
|
|
|
|
|
|
Source: from Bolz, R. E. and Tuve, G. L., Eds., Handbook of Tables for Applied Engineering Science, 2nd ed., CRC Press, Cleveland, 1973, 251.
©2001 CRC Press LLC

Table 86. DIFFUSION IN SEMICONDUCTORS*
(SHEET 8 OF 8)
|
|
|
|
Temperature |
|
|
Do |
|
Range |
|
Diffusing |
E |
of Validity |
|
Semiconductor |
Element |
(cm2 • s–1) |
(eV) |
(˚C) |
|
|
|
|
|
|
|
|
|
|
Zinc ferrate (III) |
Fe |
8.5x10+2 |
3.5 |
|
(ZnFe2O4) |
|
|||
|
|
|
|
|
|
Zn |
8.8x10+2 |
3.7 |
|
Zinc selenide (ZnSe) |
Cu |
1.7x10⁻⁵ |
0.56 |
200–570 |
Zinc sulfide (ZnS) |
Zn |
1.0x10+16 |
6.50 |
>1030 |
|
|
1.5x10+4 |
3.25 |
940–1030 |
|
|
3.0x10⁻⁴ |
1.52 |
<940 |
|
|
|
|
|
Source: from Bolz, R. E. and Tuve, G. L., Eds., Handbook of Tables for Applied Engineering Science, 2nd ed., CRC Press, Cleveland, 1973, 251.
*The diffusion coefficient D at a temperature T(K) is given by the following: D=Doe- E/kT
For Do in m2/s, multiply values in cm2/s by 10–4.
a |
Values obtained at the low concentration limit. |
|
©2001 CRC Press LLC
Shackelford, James F. & Alexander, W. “Thermal Properties of Materials”
Materials Science and Engineering Handbook
Ed. James F. Shackelford and W. Alexander Boca Raton: CRC Press LLC, 2001

CHAPTER 5
Thermal Properties
of Materials
List of Tables |
Specific Heat & Heat Capacity |
|
Specific Heat of the Elements at 25 ˚C |
|
Heat Capacity of Ceramics |
|
Specific Heat of Polymers |
|
Specific Heat of Fiberglass Reinforced Plastics |
Thermal Conductivity
Thermal Conductivity of Metals (Part 1)
Thermal Conductivity of Metals (Part 2)
Thermal Conductivity of Metals (Part 3)
Thermal Conductivity of Metals (Part 4)
Thermal Conductivity of Alloy Cast Irons
Thermal Conductivity of Iron and Iron Alloys
Thermal Conductivity of Aluminum and aluminum alloys
Thermal Conductivity of Copper and Copper Alloys
Thermal Conductivity of Magnesium
and Magnesium Alloys
Thermal Conductivity of Nickel and Nickel Alloys
Thermal Conductivity of Lead and Lead Alloys
Thermal Conductivity of Tin, Titanium, Zinc and their Alloys
Thermal Conductivity of Pure Metals
(Continued)
©2001 CRC Press LLC
List of Tables
(Continued)
Thermal Conductivity of Ceramics
Thermal Conductivity of Glasses
Thermal Conductivity of Cryogenic Insulation
Thermal Conductivity of Cryogenic Supports
Thermal Conductivity of Special Concretes
Thermal Conductivity of SiC-Whisker-Reinforced Ceramics
Thermal Conductivity of Polymers
Thermal Conductivity of Fiberglass Reinforced Plastics
Thermal Expansion
Thermal Expansion of Wrought Stainless Steels Thermal Expansion of Wrought Titanium Alloys Thermal Expansion of Graphite Magnesium Castings Linear Thermal Expansion of Metals and Alloys Thermal Expansion of Ceramics
Thermal Expansion of SiC-Whisker-Reinforced Ceramics
Thermal Expansion of Glasses
Thermal Expansion of Polymers
Thermal Expansion Coefficients of
Materials for Integrated Circuits
Thermal Expansion of Silicon Carbide SCS–2–Al
Tempering & Softening
ASTM B 601 Temper Designation Codes for
Copper and Copper Alloys
Temper Designation System for Aluminum Alloys Tool Steel Softening After 100 Hours
Thermoplastic Polyester Softening with Temperature
Heat-Deflection Temperature of Carbonand
Glass-Reinforced Engineering Thermoplastics
©2001 CRC Press LLC

Table 87. SPECIFIC HEAT OF THE ELEMENTS AT 25 ˚C
(SHEET 1 OF 4) |
|
|
|
|
|
|
|
Cp |
Element |
|
(cal • g-l • K–1) |
|
|
|
|
|
|
Aluminum |
|
0.215 |
Antimony |
|
0.049 |
Argon |
|
0.124 |
Arsenic |
|
0.0785 |
Barium |
|
0.046 |
Beryllium |
|
0.436 |
Bismuth |
|
0.0296 |
Boron |
|
0.245 |
Bromine (Br2) |
|
0.113 |
Cadmium |
|
0.0555 |
Calcium |
|
0.156 |
Carbon, diamond |
|
0.124 |
Carbon, graphite |
|
0.170 |
Cerium |
|
0.049 |
Cesium |
|
0.057 |
Chlorine (Cl2) |
|
0.114 |
Chromium |
|
0.107 |
Cobalt |
|
0.109 |
Columbium (see Niobium) |
|
|
Copper |
|
0.092 |
Dysprosium |
|
0.0414 |
Erbium |
|
0.0401 |
Europium |
|
0.0421 |
Fluorine (F2) |
|
0.197 |
Gadolinium |
|
0.055 |
Gallium |
|
0.089 |
Germanium |
|
0.077 |
Gold |
|
0.0308 |
|
|
|
Source: data from Weast, R. C., Ed., Handbook of Chemistry and Physics, 55th ed., CRC Press, Cleveland, 1974, D-144., Kelly, K. K., Bulletin 592, Bureau of Mines, Washington, D. C., 1961.and Hultgren, R., Orr, R L., Anderson, P. D., and Kelly, K. K., Selected Values of Thermodynamic Properties of Metals and Alloys, John Wiley & Sons, New York, (1963).
©2001 CRC Press LLC

Table 87. SPECIFIC HEAT OF THE ELEMENTS AT 25 ˚C
|
(SHEET 2 OF 4) |
|
|
|
|
|
|
Cp |
Element |
|
(cal • g-l • K–1) |
|
|
|
|
|
|
Hafnium |
|
0.035 |
Helium |
|
1.24 |
Hollnium |
|
0.0393 |
Hydrogen (H2) |
|
3.41 |
Indium |
|
0.056 |
lodine (I2) |
|
0.102 |
Iridium |
|
0.0317 |
Iron (α) |
|
0.106 |
Krypton |
|
0.059 |
Lanthanum |
|
0.047 |
Lead |
|
0.038 |
Lithium |
|
0.85 |
Lutetium |
|
0.037 |
Magnesium |
|
0.243 |
Manganese, α |
|
0.114 |
Manganese, β |
|
1.119 |
Mercury |
|
0.0331 |
Molybdenum |
|
0.599 |
Neodymium |
|
0.049 |
Neon |
|
0.246 |
Nickel |
|
0.106 |
Niobium |
|
0.064 |
Nitrogen (N2) |
|
0.249 |
Osmium |
|
0.03127 |
Oxygen (O2) |
|
0.219 |
Palladium |
|
0.0584 |
Phosphorus, white |
|
0.181 |
Phosphorus, red, triclinic |
|
0.160 |
|
|
|
Source: data from Weast, R. C., Ed., Handbook of Chemistry and Physics, 55th ed., CRC Press, Cleveland, 1974, D-144., Kelly, K. K., Bulletin 592, Bureau of Mines, Washington, D. C., 1961.and Hultgren, R., Orr, R L., Anderson, P. D., and Kelly, K. K., Selected Values of Thermodynamic Properties of Metals and Alloys, John Wiley & Sons, New York, (1963).
©2001 CRC Press LLC

Table 87. SPECIFIC HEAT OF THE ELEMENTS AT 25 ˚C
|
(SHEET 3 OF 4) |
|
|
|
|
|
|
Cp |
Element |
|
(cal • g-l • K–1) |
|
|
|
|
|
|
Platinum |
|
0.0317 |
Polonium |
|
0.030 |
Potassium |
|
0.180 |
Praseodymium |
|
0.046 |
Promethium |
|
0.0442 |
Protactinium |
|
0.029 |
Radium |
|
0.0288 |
Radon |
|
0.0224 |
Rhenium |
|
0.0329 |
Rhodium |
|
0.0583 |
Rubidium |
|
0.0861 |
Ruthenium |
|
0.057 |
Samarium |
|
0.043 |
Scandium |
|
0.133 |
Selenium (Se2) |
|
0.0767 |
Silicon |
|
0.168 |
Silver |
|
0.0566 |
Sodium |
|
0.293 |
Strontium |
|
0.0719 |
Sulfur, yellow |
|
0.175 |
Tantalum |
|
0.0334 |
Technetium |
|
0.058 |
Tellurium |
|
0.0481 |
Terbium |
|
0.0437 |
Thallium |
|
0.0307 |
Thorium |
|
0.0271 |
Thulium |
|
0.0382 |
Tin (α) |
|
0.0510 |
|
|
|
Source: data from Weast, R. C., Ed., Handbook of Chemistry and Physics, 55th ed., CRC Press, Cleveland, 1974, D-144., Kelly, K. K., Bulletin 592, Bureau of Mines, Washington, D. C., 1961.and Hultgren, R., Orr, R L., Anderson, P. D., and Kelly, K. K., Selected Values of Thermodynamic Properties of Metals and Alloys, John Wiley & Sons, New York, (1963).
©2001 CRC Press LLC
Table 87. SPECIFIC HEAT OF THE ELEMENTS AT 25 ˚C
|
(SHEET 4 OF 4) |
|
|
|
|
|
|
Cp |
Element |
|
(cal • g-l • K–1) |
|
|
|
|
|
|
Tin (β) |
|
0.0530 |
Titanium |
|
0.125 |
Tungsten |
|
0.0317 |
Uranium |
|
0.0276 |
Vanadium |
|
0.116 |
Xenon |
|
0.0378 |
Ytterbium |
|
0.0346 |
Yttrium |
|
0.068 |
Zinc |
|
0.0928 |
Zirconium |
|
0.0671 |
|
|
|
Source: data from Weast, R. C., Ed., Handbook of Chemistry and Physics, 55th ed., CRC Press, Cleveland, 1974, D-144., Kelly, K. K., Bulletin 592, Bureau of Mines, Washington, D. C., 1961.and Hultgren, R., Orr, R L., Anderson, P. D., and Kelly, K. K., Selected Values of Thermodynamic Properties of Metals and Alloys, John Wiley & Sons, New York, (1963).
©2001 CRC Press LLC

Table 88. HEAT CAPACITY OF CERAMICS
(SHEET 1 OF 2)
|
|
Heat Capacity, Cp |
|
|
(cal/mole/K) |
Class |
Ceramic |
|
|
|
|
|
|
|
Borides |
Chromium Diboride (CrB2) |
9.61 + 10.72x10⁻³T cal/mole |
|
|
at 494-1010K |
|
Hafnium Diboride (HfB2) |
9.61 + 10.72x10⁻³T cal/mole |
|
|
at 494-1010K |
|
Tantalum Diboride (TaB2) |
0.04 cal/g˚C |
|
Titanium Diboride (TiB2) |
10.93 + 7.08x10⁻³T cal/mole |
|
|
at 420-1180 K |
|
Zirconium Diboride (ZrB2) |
15.81T + 4.20x10⁻³T - 3.52x10⁵T–2 |
|
|
for 429-1171K |
Carbides |
Hafnium Monocarbide (HfC) |
0.05 at room temp. |
|
|
15 ± 0.15 at 925˚C |
|
|
16 ± 0.16 at 1525˚C |
|
Silicon Carbide (SiC) |
0.26 at 540˚C |
|
|
0.27 at 700˚C |
|
|
0.30 at 1000˚C |
|
|
0.32 at 1200˚C |
|
|
0.33 at 1350˚C |
|
|
0.35 at 1550˚C |
|
Titanium MonoCarbide (TiC) |
0.150-0.170 cal/g at 150˚C |
|
|
0.170-0.187 cal/g at 300˚C |
|
|
0.183-0.196 cal/g at 450˚C |
|
|
0.192-0.201 cal/g at 600˚C |
|
|
0.20-0.207 cal/g at 750˚C |
|
|
0.209 cal/g at 900˚C |
|
|
0.210 cal/g at 1000˚C |
|
|
0.211 cal/g at 1100˚C |
|
|
|
Source: data compiled by J.S. Park from No. 1 Materials Index, Peter T.B. Shaffer, Plenum Press, New York, (1964); SmithellsBrandes, ed., in association with Fulmer Research Institute Ltd. 6th ed. London, Butterworths, Boston, (1983); and Ceramic Source, American Ceramic Society (1986-1991)
©2001 CRC Press LLC

Table 88. HEAT CAPACITY OF CERAMICS
|
(SHEET 2 OF 2) |
|
|
|
|
|
|
Heat Capacity, Cp |
|
|
(cal/mole/K) |
Class |
Ceramic |
|
|
|
|
|
|
|
Nitrides |
Aluminum Nitride (AlN) |
0.1961 cal/g/˚C ; 0-100˚C |
|
|
0.2277 cal/g/˚C ; 0-420˚C |
|
|
0.2399 cal/g/˚C ; 0-598˚C |
|
Trisilicon tetranitride (Si3N4) |
0.17 cal/g/˚C |
Oxides |
Cerium Dioxide (CeO2) |
14.24T + 5.62x10⁻³T 491-1140K |
Silicides |
Molybdenum Disilicide (MoSi2) |
10-14 cal/g/˚C; 425-1000˚C |
|
Tungsten Disilicide (WSi2) |
8 cal/g/˚C; 425-1450˚C |
|
|
|
Source: data compiled by J.S. Park from No. 1 Materials Index, Peter T.B. Shaffer, Plenum Press, New York, (1964); SmithellsBrandes, ed., in association with Fulmer Research Institute Ltd. 6th ed. London, Butterworths, Boston, (1983); and Ceramic Source, American Ceramic Society (1986-1991)
©2001 CRC Press LLC

Table 89. SPECIFIC HEAT OF POLYMERS
(SHEET 1 OF 4)
|
|
Specific heat |
Polymer Class |
Polymer Subclass |
(Btu/lb/°F) |
|
|
|
|
|
|
ABS Resins; Molded, Extruded |
Medium impact |
0.36—0.38 |
|
High impact |
0.36—0.38 |
|
Very high impact |
0.36—0.38 |
|
Low temperature impact |
0.35—0.38 |
|
Heat resistant |
0.37—0.39 |
Acrylics; Cast, Molded, Extruded |
Cast Resin Sheets, Rods: |
|
|
General purpose, type I |
0.35 |
|
General purpose, type II |
0.35 |
|
Moldings: |
|
|
Grades 5, 6, 8 |
0.35 |
|
High impact grade |
0.34 |
Thermoset Carbonate |
Allyl diglycol carbonate |
0.3 |
Cellulose Acetate; Molded, |
ASTM Grade: |
|
Extruded |
|
|
|
|
|
|
H6—1 |
0.3—0.42 |
|
H4—1 |
0.3—0.42 |
|
H2—1 |
0.3—0.42 |
|
MH—1, MH—2 |
0.3—0.42 |
|
MS—1, MS—2 |
0.3—0.42 |
|
S2—1 |
0.3—0.42 |
Cellulose Acetate Butyrate; |
ASTM Grade: |
|
Molded, Extruded |
|
|
|
|
|
|
H4 |
0.3—0.4 |
|
MH |
0.3—0.4 |
|
S2 |
0.3—0.4 |
Cellusose Acetate Propionate; |
ASTM Grade: |
|
Molded, Extruded |
|
|
|
|
|
|
1 |
0.3—0.4 |
|
3 |
0.3—0.4 |
|
6 |
0.3—0.4 |
|
|
|
Source: data compiled by J.S. Park from Charles T. Lynch, CRC Handbook of Materials Science, Vol. 3, CRC Press, Boca Raton, Florida and Engineered Materials Handbook, Vol.2, Engineering Plastics, ASM International, Metals Park, Ohio, 1988.
©2001 CRC Press LLC

Table 89. SPECIFIC HEAT OF POLYMERS
(SHEET 2 OF 4)
|
|
Specific heat |
|
Polymer Class |
Polymer Subclass |
(Btu/lb/°F) |
|
|
|
|
|
|
|
|
|
Chlorinated polyvinyl chloride |
Chlorinated polyvinyl chloride |
0.3 |
|
Polycarbonate |
|
0.3 |
|
Fluorocarbons; Molded,Extruded |
Polytrifluoro chloroethylene |
0.22 |
|
(PTFCE) |
|||
|
|
||
|
Polytetrafluoroethylene (PTFE) |
0.25 |
|
|
Fluorinated ethylene |
0.28 |
|
|
propylene(FEP) |
||
|
|
||
|
Polyvinylidene— fluoride |
0.33 |
|
|
(PVDF) |
||
|
|
||
Epoxies; Cast, Molded, Reinforced |
Standard epoxies (diglycidyl |
|
|
|
ethers of bisphenol A) |
|
|
|
Cast rigid |
0.4-0.5 |
|
|
High strength laminate |
0.21 |
|
|
Filament wound composite |
0.24 |
|
Nylons; Molded, Extruded |
Type 6 |
|
|
|
General purpose |
0.4 |
|
|
Cast |
0.4 |
|
|
Type 8 |
0.4 |
|
|
Type 11 |
0.58 |
|
|
Type 12 |
0.28 |
|
Nylons; Molded, Extruded |
6/6 Nylon |
|
|
|
General purpose molding |
0.3—0.5 |
|
|
General purpose extrusion |
0.3—0.5 |
|
|
6/10 Nylon |
|
|
|
General purpose |
0.3—0.5 |
|
|
|
|
Source: data compiled by J.S. Park from Charles T. Lynch, CRC Handbook of Materials Science, Vol. 3, CRC Press, Boca Raton, Florida and Engineered Materials Handbook, Vol.2, Engineering Plastics, ASM International, Metals Park, Ohio, 1988.
©2001 CRC Press LLC

Table 89. SPECIFIC HEAT OF POLYMERS
(SHEET 3 OF 4)
|
|
Specific heat |
Polymer Class |
Polymer Subclass |
(Btu/lb/°F) |
|
|
|
|
|
|
Phenolics; Molded |
Type and filler: |
|
|
General: woodflour and flock |
0.35—0.40 |
|
Shock: paper, flock, or pulp |
— |
|
High shock: chopped fabric or |
0.30—0.35 |
|
cord |
|
|
|
|
|
Very high shock: glass fiber |
0.28—0.32 |
Phenolics: Molded |
Arc resistant—mineral |
0.27—0.37 |
|
Rubber phenolic—woodflour or |
0.33 |
|
flock |
|
|
|
|
|
PVC—Acrylic Alloy |
|
|
PVC—acrylic sheet |
0.293 |
Polymides |
Unreinforced |
0.31 |
|
Unreinforced 2nd value |
0.25—0.35 |
|
Glass reinforced |
0.15—0.27 |
Polyacetals |
Standard |
0.35 |
|
Copolymer: |
|
|
Standard |
0.35 |
|
High flow |
0.35 |
Polyesters: Thermosets |
Cast polyyester |
|
|
Rigid |
0.30—0.55 |
|
Reinforced polyester moldings |
|
|
High strength (glass fibers) |
0.25—0.35 |
|
Sheet molding compounds, |
0.20—0.25 |
|
general purpose |
|
|
|
|
Phenylene oxides (Noryl) |
Standard |
0.24 |
Polypropylene: |
General purpose |
0.45 |
|
High impact |
0.45—0.48 |
Polyphenylene sulfide: |
Standard |
0.26 |
|
|
|
Source: data compiled by J.S. Park from Charles T. Lynch, CRC Handbook of Materials Science, Vol. 3, CRC Press, Boca Raton, Florida and Engineered Materials Handbook, Vol.2, Engineering Plastics, ASM International, Metals Park, Ohio, 1988.
©2001 CRC Press LLC

Table 89. SPECIFIC HEAT OF POLYMERS
(SHEET 4 OF 4)
|
|
Specific heat |
|
Polymer Class |
Polymer Subclass |
(Btu/lb/°F) |
|
|
|
|
|
|
|
|
|
Polyethylenes; Molded, Extruded |
Type I—lower density (0.910— |
|
|
0.925) |
|
||
|
|
||
|
Melt index 0.3—3.6 |
0.53—0.55 |
|
|
Melt index 6—26 |
0.53—0.55 |
|
|
Melt index 200 |
0.53—0.55 |
|
|
Type II—medium density |
|
|
|
(0.926—0.940) |
|
|
|
Melt index 20 |
0.53—0.55 |
|
|
Melt index l.0—1.9 |
0.53—0.55 |
|
|
Type III—higher density (0.941— |
|
|
|
0.965) |
|
|
|
Melt index 0.2—0.9 |
0.46—0.55 |
|
|
Melt Melt index 0.l—12.0 |
0.46—0.55 |
|
|
Melt index 1.5—15 |
0.46—0.55 |
|
Polystyrenes; Molded |
Polystyrenes |
|
|
|
General purpose |
0.30—0.35 |
|
|
Medium impact |
0.30—0.35 |
|
|
High impact |
0.30—0.35 |
|
|
Glass fiber -30% reinforced |
0.256 |
|
|
Styrene acrylonitrile (SAN) |
0.33 |
|
Polyvinyl Chloride And |
Vinylidene chloride |
0.32 |
|
Copolymers; Molded, Extruded |
|||
|
|
||
Silicones; Molded, Laminated |
Woven glass fabric/ silicone |
0.246 |
|
laminate |
|||
|
|
||
|
|
|
Source: data compiled by J.S. Park from Charles T. Lynch, CRC Handbook of Materials Science, Vol. 3, CRC Press, Boca Raton, Florida and Engineered Materials Handbook, Vol.2, Engineering Plastics, ASM International, Metals Park, Ohio, 1988.
©2001 CRC Press LLC

Table 90. SPECIFIC HEAT OF
FIBERGLASS REINFORCED PLASTICS
|
|
Glass |
Specific |
|
|
|
fiber content |
heat |
|
Class |
Material |
(wt%) |
(Btu/lb–˚F) |
|
|
|
|
|
|
|
|
|
|
|
Glass fiber reinforced |
Sheet molding compound (SMC) |
15 to 30 |
0.30 to 0.35 |
|
thermosets |
||||
|
|
|
||
|
Bulk molding compound(BMC) |
15 to 35 |
0.30 to 0.35 |
|
|
Preform/mat(compression molded) |
25 to 50 |
0.30 to 0.33 |
|
|
Cold press molding–polyester |
20 to 30 |
0.30 to 0.33 |
|
|
Spray–up–polyester |
30 to 50 |
0.30 to 0.34 |
|
|
Filament wound–epoxy |
30 to 80 |
0.23 to 0.25 |
|
|
Rod stock–polyester |
40 to 80 |
0.22 to 0.25 |
|
|
Molding compound–phenolic |
5 to 25 |
0.20 to 0.30 |
|
Glass–fiber–reinforced |
Nylon |
6 to 60 |
0.30 to 0.35 |
|
thermoplastics |
||||
|
|
|
||
|
Polystyrene |
20 to 35 |
0.23 to 0.35 |
|
|
|
|
|
Data from ASM Engineering Materials Reference Book, Second Edition, Michael Bauccio, Ed., ASM International, Materials Park, OH, p106, (1994).
©2001 CRC Press LLC

Table 91. THERMAL CONDUCTIVITY OF METALS (PART 1)
(SHEET 1 OF 2)
T (K) |
Aluminum |
Cadmium |
Chromium |
Copper |
Gold |
|
|
|
|
|
|
1 |
7.8 |
48.7 |
0.401 |
28.7 |
4.4 |
2 |
15.5 |
89.3 |
0.802 |
57.3 |
8.9 |
3 |
23.2 |
104 |
1.20 |
85.5 |
13.1 |
4 |
30.8 |
92.0 |
1.60 |
113 |
17.1 |
5 |
38.1 |
69.0 |
1.99 |
138 |
20.7 |
6 |
45.1 |
44.2 |
2.38 |
159 |
23.7 |
7 |
51.5 |
28.0 |
2.77 |
177 |
26.0 |
8 |
57.3 |
18.0 |
3.14 |
189 |
27.5 |
9 |
62.2 |
12.2 |
3.50 |
195 |
28.2 |
10 |
66.1 |
8.87 |
3.85 |
196 |
28.2 |
11 |
69.0 |
6.91 |
4.18 |
193 |
27.7 |
12 |
70.8 |
5.56 |
4.49 |
185 |
26.7 |
13 |
71.5 |
4.67 |
4.78 |
176 |
25.5 |
14 |
71.3 |
4.01 |
5.04 |
166 |
24.1 |
15 |
70.2 |
3.55 |
5.27 |
156 |
22.6 |
16 |
68.4 |
3.16 |
5.48 |
145 |
20.9 |
18 |
63.5 |
2.62 |
5.81 |
124 |
17.7 |
20 |
56.5 |
2.26 |
6.01 |
105 |
15.0 |
25 |
40.0 |
1.79 |
6.07 |
68 |
10.2 |
30 |
28.5 |
1.56 |
5.58 |
43 |
7.6 |
35 |
21.0 |
1.41 |
5.03 |
29 |
6.1 |
40 |
16.0 |
1.32 |
4.30 |
20.5 |
5.2 |
45 |
12.5 |
1.25 |
3.67 |
15.3 |
4.6 |
50 |
10.0 |
1.20 |
3.17 |
12.2 |
4.2 |
60 |
6.7 |
1.13 |
2.48 |
8.5 |
3.8 |
|
|
|
|
|
|
Values are in watt • cm-1 • K-1.
Note: Values in parentheses are for liquid state
These data apply only to metals of purity of at least 99.9%.
The third significant figure may not be accurate.
Source: data from Ho, C. Y., Powell, R. W., and Liley, P. E., Thermal Conductictivity of Selected Materials, NSRDS–NBS–8 and NSRD-NBS-16, Part 2 , National Standard Reference Data System–National Bureau of Standards, Part 1, 1966; Part 2, 1968.
©2001 CRC Press LLC

Table 91. THERMAL CONDUCTIVITY OF METALS (PART 1)
(SHEET 2 OF 2)
T (K) |
Aluminum |
Cadmium |
Chromium |
Copper |
Gold |
|
|
|
|
|
|
70 |
5.0 |
1.08 |
2.08 |
6.7 |
3.58 |
80 |
4.0 |
1.06 |
1.82 |
5.7 |
3.52 |
90 |
3.4 |
1.04 |
1.68 |
5.14 |
3.48 |
100 |
3.0 |
1.03 |
1.58 |
4.83 |
3.45 |
200 |
2.37 |
0.993 |
1.11 |
4.13 |
3.27 |
273 |
2.36 |
0.975 |
0.948 |
4.01 |
3.18 |
300 |
2.37 |
0.968 |
0.903 |
3.98 |
3.15 |
400 |
2.4 |
0.947 |
0.873 |
3.92 |
3.12 |
500 |
2.37 |
0.92 |
0.848 |
3.88 |
3.09 |
600 |
2.32 |
(0.42) |
0.805 |
3.83 |
3.04 |
700 |
2.26 |
(0.49) |
0.757 |
3.77 |
2.98 |
800 |
2.2 |
(0.559) |
0.713 |
3.71 |
2.92 |
900 |
2.13 |
|
0.678 |
3.64 |
2.85 |
1000 |
(0.93) |
|
0.653 |
3.57 |
2.78 |
1100 |
(0.96) |
|
0.636 |
3.5 |
2.71 |
1200 |
(0.99) |
|
0.624 |
3.42 |
2.62 |
1400 |
|
|
0.611 |
|
|
|
|
|
|
|
|
Values are in watt • cm-1 • K-1.
Note: Values in parentheses are for liquid state
These data apply only to metals of purity of at least 99.9%.
The third significant figure may not be accurate.
Source: data from Ho, C. Y., Powell, R. W., and Liley, P. E., Thermal Conductictivity of Selected Materials, NSRDS–NBS–8 and NSRD-NBS-16, Part 2 , National Standard Reference Data System–National Bureau of Standards, Part 1, 1966; Part 2, 1968.
©2001 CRC Press LLC
Table 92. THERMAL CONDUCTIVITY OF METALS (PART 2)
(SHEET 1 OF 2)
T (K) |
Iron |
Lead |
Magnesium |
Mercury |
Molybdenum |
|
|
|
|
|
|
|
|
|
|
|
|
1 |
0.75 |
27.7 |
1.30 |
|
0.146 |
2 |
1.49 |
42.4 |
2.59 |
|
0.292 |
3 |
2.24 |
34.0 |
3.88 |
|
0.438 |
4 |
2.97 |
22.4 |
5.15 |
|
0.584 |
5 |
3.71 |
13.8 |
6.39 |
|
0.730 |
6 |
4.42 |
8.2 |
7.60 |
|
0.876 |
7 |
5.13 |
4.9 |
8.75 |
|
1.02 |
8 |
5.80 |
3.2 |
9.83 |
|
1.17 |
9 |
6.45 |
2.3 |
10.8 |
|
1.31 |
10 |
7.05 |
1.78 |
11.7 |
|
1.45 |
11 |
7.62 |
1.46 |
12.5 |
|
1.60 |
12 |
8.13 |
1.23 |
13.1 |
|
1.74 |
13 |
8.58 |
1.07 |
13.6 |
|
1.88 |
14 |
8.97 |
0.94 |
14.0 |
|
2.01 |
15 |
9.30 |
0.84 |
14.3 |
|
2.15 |
16 |
9.56 |
0.77 |
14.4 |
|
2.28 |
18 |
9.88 |
0.66 |
14.3 |
|
2.53 |
20 |
9.97 |
0.59 |
13.9 |
|
2.77 |
25 |
9.36 |
0.507 |
12.0 |
|
3.25 |
30 |
8.14 |
0.477 |
9.5 |
|
3.55 |
35 |
6.81 |
0.462 |
7.4 |
|
3.62 |
40 |
5.55 |
0.451 |
5.7 |
|
3.51 |
45 |
4.50 |
0.442 |
4.57 |
|
3.26 |
50 |
3.72 |
0.435 |
3.75 |
|
3.00 |
60 |
2.65 |
0.424 |
2.74 |
|
2.60 |
70 |
2.04 |
0.415 |
2.23 |
|
2.30 |
80 |
1.68 |
0.407 |
1.95 |
|
2.09 |
|
|
|
|
|
|
Values are in watt • cm-1 • K-1.
Note: Values in parentheses are for liquid state
These data apply only to metals of purity of at least 99.9%.
The third significant figure may not be accurate.
©2001 CRC Press LLC

Table 92. THERMAL CONDUCTIVITY OF METALS (PART 2)
(SHEET 2 OF 2)
T (K) |
Iron |
Lead |
Magnesium |
Mercury |
Molybdenum |
|
|
|
|
|
|
|
|
|
|
|
|
90 |
1.46 |
0.401 |
1.78 |
|
1.92 |
100 |
1.32 |
0.396 |
1.69 |
|
1.79 |
200 |
0.94 |
0.366 |
1.59 |
|
1.43 |
273 |
0.835 |
0.355 |
1.57 |
(0.078) |
1.39 |
300 |
0.803 |
0.352 |
1.56 |
(0.084) |
1.38 |
400 |
0.694 |
0.338 |
1.53 |
(0.098) |
1.34 |
500 |
0.613 |
0.325 |
1.51 |
(0.109) |
1.3 |
600 |
0.547 |
0.312 |
1.49 |
(0.12) |
1.26 |
700 |
0.487 |
(0.174) |
1.47 |
(0.127) |
1.22 |
800 |
0.433 |
(0.19) |
1.46 |
(0.13) |
1.18 |
900 |
0.38 |
(0.203) |
1.45 |
|
1.15 |
1000 |
0.326 |
(0.215) |
(0.84) |
|
1.12 |
1100 |
0.297 |
|
(0.91) |
|
1.08 |
1200 |
0.282 |
|
(0.98) |
|
1.05 |
1400 |
0.309 |
|
|
|
0.996 |
1600 |
0.327 |
|
|
|
0.946 |
1800 |
|
|
|
|
0.907 |
2000 |
|
|
|
|
0.88 |
2200 |
|
|
|
|
0.858 |
2600 |
|
|
|
|
0.825 |
|
|
|
|
|
|
Values are in watt • cm-1 • K-1.
Note: Values in parentheses are for liquid state
These data apply only to metals of purity of at least 99.9%.
The third significant figure may not be accurate.
©2001 CRC Press LLC

Table 93. THERMAL CONDUCTIVITY OF METALS (PART 3)
(SHEET 1 OF 2)
T (K) |
Nickel |
Niobium |
Platinum |
Silver |
Tantalum |
|
|
|
|
|
|
|
|
|
|
|
|
1 |
0.64 |
0.251 |
2.31 |
39.4 |
0.115 |
2 |
1.27 |
0.501 |
4.60 |
78.3 |
0.230 |
3 |
1.91 |
0.749 |
6.79 |
115 |
0.345 |
4 |
2.54 |
0.993 |
8.8 |
147 |
0.459 |
5 |
3.16 |
1.23 |
10.5 |
172 |
0.571 |
6 |
3.77 |
1.46 |
11.8 |
187 |
0.681 |
7 |
4.36 |
1.67 |
12.6 |
193 |
0.788 |
8 |
4.94 |
1.86 |
12.9 |
190 |
0.891 |
9 |
5.49 |
2.04 |
12.8 |
181 |
0.989 |
10 |
6.00 |
2.18 |
12.3 |
168 |
1.08 |
11 |
6.48 |
2.30 |
11.7 |
154 |
1.16 |
12 |
6.91 |
2.39 |
10.9 |
139 |
1.24 |
13 |
7.30 |
2.46 |
10.1 |
124 |
1.30 |
14 |
7.64 |
2.49 |
9.3 |
109 |
1.36 |
15 |
7.92 |
2.50 |
8.4 |
96 |
1.40 |
16 |
8.15 |
2.49 |
7.6 |
85 |
1.44 |
18 |
8.45 |
2.42 |
6.1 |
66 |
1.47 |
20 |
8.56 |
2.29 |
4.9 |
51 |
1.47 |
25 |
8.15 |
1.87 |
3.15 |
29.5 |
1.36 |
30 |
6.95 |
1.45 |
2.28 |
19.3 |
1.16 |
35 |
5.62 |
1.16 |
1.80 |
13.7 |
0.99 |
40 |
4.63 |
0.97 |
1.51 |
10.5 |
0.87 |
45 |
3.91 |
0.84 |
1.32 |
8.4 |
0.78 |
50 |
3.36 |
0.76 |
1.18 |
7.0 |
0.72 |
60 |
2.63 |
0.66 |
1.01 |
5.5 |
0.651 |
|
|
|
|
|
|
Values are in watt • cm-1 • K-1.
Note: Values in parentheses are for liquid state
These data apply only to metals of purity of at least 99.9%.
The third significant figure may not be accurate.
©2001 CRC Press LLC

Table 93. THERMAL CONDUCTIVITY OF METALS (PART 3)
(SHEET 2 OF 2)
T (K) |
Nickel |
Niobium |
Platinum |
Silver |
Tantalum |
|
|
|
|
|
|
|
|
|
|
|
|
70 |
2.21 |
0.61 |
0.90 |
4.97 |
0.616 |
80 |
1.93 |
0.58 |
0.84 |
4.71 |
0.603 |
90 |
1.72 |
0.563 |
0.81 |
4.60 |
0.596 |
100 |
1.58 |
0.552 |
0.79 |
4.50 |
0.592 |
200 |
1.06 |
0.526 |
0.748 |
4.3 |
0.575 |
273 |
0.94 |
0.533 |
0.734 |
4.28 |
0.574 |
300 |
0.905 |
0.537 |
0.73 |
4.27 |
0.575 |
400 |
0.801 |
0.552 |
0.722 |
4.2 |
0.578 |
500 |
0.721 |
0.567 |
0.719 |
4.13 |
0.582 |
600 |
0.655 |
0.582 |
0.72 |
4.05 |
0.586 |
700 |
0.653 |
0.598 |
0.723 |
3.97 |
0.59 |
800 |
0.674 |
0.613 |
0.729 |
3.89 |
0.594 |
900 |
0.696 |
0.629 |
0.737 |
3.82 |
0.598 |
1000 |
0.718 |
0.644 |
0.748 |
3.74 |
0.602 |
1100 |
0.739 |
0.659 |
0.76 |
3.66 |
0.606 |
1200 |
0.761 |
0.675 |
0.775 |
3.58 |
0.610 |
1400 |
0.804 |
0.705 |
0.807 |
|
0.618 |
1600 |
|
0.735 |
0.842 |
|
0.626 |
1800 |
|
0.764 |
0.877 |
|
0.634 |
2000 |
|
0.791 |
0.913 |
|
0.640 |
2200 |
|
0.815 |
|
|
0.647 |
2600 |
|
|
|
|
0.658 |
3000 |
|
|
|
|
0.665 |
|
|
|
|
|
|
Values are in watt • cm-1 • K-1.
Note: Values in parentheses are for liquid state
These data apply only to metals of purity of at least 99.9%.
The third significant figure may not be accurate.
©2001 CRC Press LLC

Table 94. THERMAL CONDUCTIVITY OF METALS (PART 4)
(SHEET 1 OF 2)
T (K) |
Tin |
Titanium |
Tungsten |
Zinc |
Zirconium |
|
|
|
|
|
|
|
|
|
|
|
|
1 |
|
0.0144 |
14.4 |
19.0 |
0.111 |
2 |
|
0.0288 |
28.7 |
37.9 |
0.223 |
3 |
297 |
0.0432 |
42.6 |
55.5 |
0.333 |
4 |
181 |
0.0576 |
55.6 |
69.7 |
0.442 |
5 |
117 |
0.0719 |
67.1 |
77.8 |
0.549 |
6 |
76 |
0.0863 |
76.2 |
78.0 |
0.652 |
7 |
52 |
0.101 |
82.4 |
71.7 |
0.748 |
8 |
36 |
0.115 |
85.3 |
61.8 |
0.837 |
9 |
26 |
0.129 |
85.1 |
51.9 |
0.916 |
10 |
19.3 |
0.144 |
82.4 |
43.2 |
0.984 |
11 |
14.8 |
0.158 |
77.9 |
36.4 |
1.04 |
12 |
11.6 |
0.172 |
72.4 |
30.8 |
1.08 |
13 |
9.3 |
0.186 |
66.4 |
26.1 |
1.11 |
14 |
7.6 |
0.200 |
60.4 |
22.4 |
1.13 |
15 |
6.3 |
0.214 |
54.8 |
19.4 |
1.13 |
16 |
5.3 |
0.227 |
49.3 |
16.9 |
1.12 |
18 |
4.0 |
0.254 |
40.0 |
13.3 |
1.08 |
20 |
3.2 |
0.279 |
32.6 |
10.7 |
1.01 |
25 |
2.22 |
0.337 |
20.4 |
6.9 |
0.85 |
30 |
1.76 |
0.382 |
13.1 |
4.9 |
0.74 |
35 |
1.50 |
0.411 |
8.9 |
3.72 |
0.65 |
40 |
1.35 |
0.422 |
6.5 |
2.97 |
0.58 |
45 |
1.23 |
0.416 |
5.07 |
2.48 |
0.535 |
50 |
1.15 |
0.401 |
4.17 |
2.13 |
0.497 |
60 |
1.04 |
0.377 |
3.18 |
1.71 |
0.442 |
|
|
|
|
|
|
Values are in watt • cm-1 • K-1.
Note: Values in parentheses are for liquid state
These data apply only to metals of purity of at least 99.9%.
The third significant figure may not be accurate.
©2001 CRC Press LLC

Table 94. THERMAL CONDUCTIVITY OF METALS (PART 4)
(SHEET 2 OF 2)
T (K) |
Tin |
Titanium |
Tungsten |
Zinc |
Zirconium |
|
|
|
|
|
|
|
|
|
|
|
|
70 |
0.96 |
0.356 |
2.76 |
1.48 |
0.403 |
80 |
0.91 |
0.339 |
2.56 |
1.38 |
0.373 |
90 |
0.88 |
0.324 |
2.44 |
1.34 |
0.350 |
100 |
0.85 |
0.312 |
2.35 |
1.32 |
0.332 |
200 |
0.733 |
0.245 |
1.97 |
1.26 |
0.252 |
273 |
0.682 |
0.224 |
1.82 |
1.22 |
0.232 |
300 |
0.666 |
0.219 |
1.78 |
1.21 |
0.227 |
400 |
0.622 |
0.204 |
1.62 |
1.16 |
0.216 |
500 |
0.596 |
0.197 |
1.49 |
1.11 |
0.210 |
600 |
(0.323) |
0.194 |
1.39 |
1.05 |
0.207 |
700 |
(0.343) |
0.194 |
1.33 |
(0.499) |
0.209 |
800 |
(0.364) |
0.197 |
1.28 |
(0.557) |
0.216 |
900 |
(0.384) |
0.202 |
1.24 |
(0.615) |
0.226 |
1000 |
(0.405) |
0.207 |
1.21 |
(0.673) |
0.237 |
1100 |
(0.425) |
0.213 |
1.18 |
(0.73) |
0.248 |
1200 |
(0.446) |
0.220 |
1.15 |
|
0.257 |
1400 |
(0.487) |
0.236 |
1.11 |
|
0.275 |
1600 |
|
0.253 |
1.07 |
|
0.290 |
1800 |
|
0.271 |
1.03 |
|
0.302 |
2000 |
|
|
1.00 |
|
0.313 |
2200 |
|
|
0.98 |
|
|
2600 |
|
|
0.94 |
|
|
3000 |
|
|
0.915 |
|
|
|
|
|
|
|
|
Values are in watt • cm-1 • K-1.
Note: Values in parentheses are for liquid state
These data apply only to metals of purity of at least 99.9%.
The third significant figure may not be accurate.
©2001 CRC Press LLC

Table 95. THERMAL CONDUCTIVITY OF ALLOY CAST IRONS
|
|
Thermal Conductivity |
Description |
Description |
W/(m • K) |
|
|
|
|
|
|
Abrasion–Resistant White Irons |
Low–C white iron |
22 |
|
Martensitic nickel–chromium |
30 |
|
iron |
|
|
|
|
Corrosion–Resistant Irons |
High–nickel gray iron |
38 to 40 |
|
High–nickel ductile iron |
13.4 |
Heat–Resistant Gray Irons |
Medium–silicon iron |
37 |
|
High–chromium iron |
20 |
|
High–nickel iron |
37 to 40 |
|
Nickel–chromium–silicon iron |
30 |
Heat–Resistant Ductile Iron |
High–nickel ductile (20 Ni) |
13 |
|
|
|
Source: Data from ASM Metals Reference Book, Second Edition, American Society for Metals, Metals Park, Ohio 44073, p172, (1984).
©2001 CRC Press LLC

Table 96. THERMAL CONDUCTIVITY OF IRON
AND IRON ALLOYS
|
Thermal Conductivity |
|
near room temperature |
Metal or alloy |
(cal / cm2 • cm • s • °C) |
|
|
|
|
Pure iron |
0.178 |
Cast iron (3.16C, 1.54Si, 0.57Mn) |
0.112 |
Carbon steel(0.23C, 0.64Mn) |
0.124 |
Carbon steel(1.22 C, 0.35 Mn) |
0.108 |
Alloy steel (0.34 C, 0.55 Mn, 0.78 Cr, 3.53 Ni, 0.39 Mo, 0.05 Cu) |
0.079 |
Type 410 |
0.057 |
Type 304 |
0.036 |
T1 tool steel |
0.058 |
|
|
Data from ASM Metals Reference Book, Third Edition, Michael Bauccio, Ed., ASM International, Materials Park, OH, p156, (1993).
©2001 CRC Press LLC

Table 97. THERMAL CONDUCTIVITY OF ALUMINUM
AND ALUMINUM ALLOYS (SHEET 1 OF 2)
|
|
Thermal Conductivity |
|
|
near room temperature |
Metal or alloy |
Designation |
(cal / cm2 • cm • s • °C) |
|
|
|
|
|
|
Wrought alloys |
EC(O) |
0.57 |
|
1060(O) |
0.56 |
|
1100 |
0.53 |
|
2011(T3) |
0.34 |
|
2014(O) |
0.46 |
|
2024(O) |
0.45 |
|
2218(T72) |
0.37 |
|
3003(O) |
0.46 |
|
4032(O) |
0.37 |
|
5005 |
0.48 |
|
5050(O) |
0.46 |
|
5052(O) |
0.33 |
|
5056(O) |
0.28 |
|
5083 |
0.28 |
|
5086 |
0.30 |
|
5154 |
0.30 |
|
5357 |
0.40 |
|
5456 |
0.28 |
|
6061(O) |
0.41 |
|
6063(O) |
0.52 |
|
6101(T6) |
0.52 |
|
6151(O) |
0.49 |
|
7075(T6) |
0.29 |
|
7079(T6) |
0.29 |
|
7178 |
0.29 |
|
|
|
Data from ASM Metals Reference Book, Third Edition, Michael Bauccio, Ed., ASM International, Materials Park, OH, p156, (1993).
©2001 CRC Press LLC

Table 97. THERMAL CONDUCTIVITY OF ALUMINUM
AND ALUMINUM ALLOYS (SHEET 2 OF 2)
|
|
Thermal Conductivity |
|
|
near room temperature |
Metal or alloy |
Designation |
(cal / cm2 • cm • s • °C) |
|
|
|
|
|
|
Casting alloys |
A13 |
0.29 |
|
43(F) |
0.34 |
|
108(F) |
0.29 |
|
A108 |
0.34 |
|
A132(T551) |
0.28 |
|
D132(T5) |
0.25 |
|
F132 |
0.25 |
|
138 |
0.24 |
|
142 (T21, sand) |
0.40 |
|
195 (T4, T62) |
0.33 |
|
B195 (T4, T6) |
0.31 |
|
214 |
0.33 |
|
200(T4) |
0.21 |
|
319 |
0.26 |
|
355(T51, sand) |
0.40 |
|
356(T51, sand) |
0.40 |
|
360 |
0.35 |
|
380 |
0.23 |
|
750 |
0.44 |
|
40E |
0.33 |
|
|
|
Data from ASM Metals Reference Book, Third Edition, Michael Bauccio, Ed., ASM International, Materials Park, OH, p156, (1993).
©2001 CRC Press LLC
Table 98. THERMAL CONDUCTIVITY OF COPPER
AND COPPER ALLOYS (SHEET 1 OF 3)
|
|
Thermal Conductivity |
|
|
near room temperature |
Metal or alloy |
Designation |
(cal / cm2 • cm • s • °C) |
|
|
|
|
|
|
Wrought coppers |
Pure Copper |
0.941 |
|
Electrolytic tough pitch copper (ETP) |
0.934 |
|
Deoxidized copper high residual |
0.81 |
|
phosphorus (DHP) |
|
|
|
|
|
Free–machining copper (0.5% Te) |
0.88 |
|
Free–machining copper (1% Pb) |
0.92 |
Wrought alloys |
Gilding, 95% |
0.56 |
|
Commercial bronze, 90% |
0.45 |
|
Jewelry bronze, 87.5% |
0.41 |
|
Red brass, 85% |
0.38 |
|
Low brass, 80% |
0.33 |
|
Cartridge brass, 70% |
0.29 |
|
Yellow brass |
0.28 |
|
Muntz metal |
0.29 |
|
Leaded commercial bronze |
0.43 |
|
Low–leaded brass (tube) |
0.28 |
|
Medium leaded brass |
0.28 |
|
High–leaded brass (tube) |
0.28 |
|
High–leaded brass |
0.28 |
|
Extra–high–leaded brass |
0.28 |
|
Leaded Muntz metal |
0.29 |
|
Forging brass |
0.28 |
|
Architectual bronze |
0.29 |
|
Inhibited admiralty |
0.26 |
|
Naval brass |
0.28 |
|
|
|
Data from ASM Metals Reference Book, Third Edition, Michael Bauccio, Ed., ASM International, Materials Park, OH, p156, (1993).
©2001 CRC Press LLC

Table 98. THERMAL CONDUCTIVITY OF COPPER
AND COPPER ALLOYS (SHEET 2 OF 3)
|
|
Thermal Conductivity |
|
|
|
near room temperature |
|
Metal or alloy |
Designation |
(cal / cm2 • cm • s • °C) |
|
|
|
|
|
|
|
|
|
Wrought alloys |
Leaded naval brass |
0.28 |
|
(Con’t) |
|||
|
|
||
|
Manganese bronze |
0.26 |
|
|
Phosphor bronze,5% |
0.17 |
|
|
Pbosphor bronze, 8% |
0.15 |
|
|
Phosphor bronze, 10% |
0.12 |
|
|
Phosphor bronze, 1.25% |
0.49 |
|
|
Free cutting phosphor bronze |
0.18 |
|
|
Cupro-nickel,30% |
0.07 |
|
|
Cupro-nickel,10% |
0.095 |
|
|
Nickel silver, 65–18 |
0.08 |
|
|
Nickel silver, 55–18 |
0.07 |
|
|
Nickel silver, 65–12 |
0.10 |
|
|
High–silicon bronze |
0.09 |
|
|
Low–silicon bronze |
0.14 |
|
|
Aluminum bronze, 5%Al |
0.198 |
|
|
Aluminum bronze |
0.18 |
|
|
Aluminum–silicon bronze |
0.108 |
|
|
Aluminum bronze |
0.144 |
|
|
Aluminum bronze |
0.091 |
|
|
Beryllium copper |
0.20 |
|
Casting alloys |
Chromium copper (1% Cr) |
0.4 |
|
|
89cu–11Sn |
0.121 |
|
|
88Cu–6Sn–1.5Pb–4.5Zn |
18% of Cu |
|
|
87Cu–8Sn–1Pb–4Zn |
12% of Cu |
|
|
87Cu–10Sn–1Pb–2Zn |
12% of Cu |
|
|
80Cu–10Sn–10Pb |
12% of Cu |
|
|
Manganese bronze, 110 ksi |
9.05% of Cu |
|
|
|
|
Data from ASM Metals Reference Book, Third Edition, Michael Bauccio, Ed., ASM International, Materials Park, OH, p156, (1993).
©2001 CRC Press LLC

Table 98. THERMAL CONDUCTIVITY OF COPPER
AND COPPER ALLOYS (SHEET 3 OF 3)
|
|
Thermal Conductivity |
|
|
|
near room temperature |
|
Metal or alloy |
Designation |
(cal / cm2 • cm • s • °C) |
|
|
|
|
|
|
|
|
|
Casting alloys |
Aluminum bronze, Alloy 9A |
15% of Cu |
|
(Con’t) |
|||
|
|
||
|
Aluminum bronze, Alloy 9B |
16% of Cu |
|
|
Aluminum bronze, Alloy 9C |
18% of Cu |
|
|
Aluminum bronze, Alloy 9D |
12% of Cu |
|
|
Propeller bronze |
11% of Cu |
|
|
Nickel silver, 12% Ni |
7% of Cu |
|
|
Nickel silver, 16% Ni |
7% of Cu |
|
|
Nickel silver, 20% Ni |
6% of Cu |
|
|
Nickel silver. 25% Ni |
6.5% of Cu |
|
|
Silicon bronze |
7% of Cu |
|
|
|
|
Data from ASM Metals Reference Book, Third Edition, Michael Bauccio, Ed., ASM International, Materials Park, OH, p156, (1993).
©2001 CRC Press LLC

Table 99. THERMAL CONDUCTIVITY OF
MAGNESIUM AND MAGNESIUM ALLOYS
|
|
Thermal Conductivity |
|
|
near room temperature |
Metal or alloy |
Designation |
(cal / cm2 • cm • s • °C) |
|
|
|
|
|
|
Pure |
Magnesium (99.8%) |
0.367 |
Casting alloys |
AM100A |
0.17 |
|
AZ63A |
0.18 |
|
AZ81A(T4) |
0.12 |
|
AZ91A, B, C |
0.17 |
|
AZ92A |
0.17 |
|
HK31A (T6, sand cast) |
0.22 |
|
HZ32A |
0.26 |
|
ZH42 |
0.27 |
|
ZH62A |
0.26 |
|
ZK51A |
0.26 |
|
ZE41A(T5) |
0.27 |
|
EZ33A |
0.24 |
|
EK30A |
0.26 |
|
EK41A(T5) |
0.24 |
Wrought alloys |
M1A |
0.33 |
|
AZ31B |
0.23 |
|
AZ61A |
0.19 |
|
AZ80A |
0.18 |
|
ZK60A,B(F) |
0.28 |
|
ZE10A(O) |
0.33 |
|
HM21A(O) |
0.33 |
|
HM31A |
0.25 |
|
|
|
Data from ASM Metals Reference Book, Third Edition, Michael Bauccio, Ed., ASM International, Materials Park, OH, p156, (1993).
©2001 CRC Press LLC

Table 100. THERMAL CONDUCTIVITY OF
NICKEL AND NICKEL ALLOYS
|
Thermal Conductivity |
|
near room temperature |
Metal or alloy |
(cal / cm2 • cm • s • °C) |
|
|
|
|
Nickel (99.95% Ni + Co) |
0.22 |
“A” nickel |
0.145 |
“D” nickel |
0.115 |
Monel |
0.062 |
“K” Monel |
0.045 |
Inconel |
0.036 |
Hastelloy B |
0.027 |
Hastelloy C |
0.03 |
Hastelloy D |
0.05 |
Illium G |
0.029 |
Illium R |
0.031 |
60Ni–24Fe–16Cr |
0.032 |
35Ni–45Fe–20Cr |
0.031 |
Constantan |
0.051 |
|
|
Data from ASM Metals Reference Book, Third Edition, Michael Bauccio, Ed., ASM International, Materials Park, OH, p156, (1993).
©2001 CRC Press LLC

Table 101. THERMAL CONDUCTIVITY OF LEAD
AND LEAD ALLOYS
|
Thermal Conductivity |
|
near room temperature |
Metal or alloy |
(cal / cm2 • cm • s • °C) |
|
|
|
|
Corroding lead (99.73 + % Pb) |
0.083 |
5–95 solder |
0.085 |
20–80 solder |
0.089 |
50-50 solder |
0.111 |
1% antimonial lead |
0.080 |
Hard lead (96Pb-4Sb) |
0.073 |
Hard lead (94Pb–6Sb) |
0.069 |
8% antimonial lead |
0.065 |
9% antimonial lead |
0.064 |
Lead-base babbitt (SAE 14) |
0.057 |
Lead-base babbitt (alloy 8) |
0.058 |
|
|
Data from ASM Metals Reference Book, Third Edition, Michael Bauccio, Ed., ASM International, Materials Park, OH, p156, (1993).
©2001 CRC Press LLC

Table 102. THERMAL CONDUCTIVITY OF TIN, TITANIUM, ZINC
AND THEIR ALLOYS
|
|
Thermal Conductivity |
|
|
near room temperature |
Metal or alloy |
Designation |
(cal / cm2 • cm • s • °C) |
|
|
|
|
|
|
Tin and Tin Alloys |
Pure tin |
0.15 |
|
Soft solder (63Sn–37Pb) |
0.12 |
|
Tin foil (92Sn–8Zn) |
0.14 |
Titanium and Titanium Alloys |
Titanium(99.0%) |
0.043 |
|
Ti–5Al–2.5Sn |
0.019 |
|
Ti–2Fe-2Cr–2Mo |
0.028 |
|
Ti–8Mn |
0.026 |
Zinc and Zinc Alloys |
Pure zinc |
0.27 |
|
AG40A alloy |
0.27 |
|
AC41A alloy |
0.26 |
|
Commercial rolled zinc 0.08 Pb |
0.257 |
|
Commercial rolled zinc 0.06 Pb, 0.06 Cd |
0.257 |
|
Rolled zinc alloy (1 CU, 0.010 Mg) |
0.25 |
|
Zn-Cu–Ti alloy (0.8 Cu, 0.15 Ti) |
0.25 |
|
|
|
Data from ASM Metals Reference Book, Third Edition, Michael Bauccio, Ed., ASM International, Materials Park, OH, p156, (1993).
©2001 CRC Press LLC

Table 103. THERMAL CONDUCTIVITY OF PURE METALS
|
Thermal Conductivity |
|
near room temperature |
Metal or alloy |
(cal / cm2 • cm • s • °C) |
|
|
|
|
Beryllium |
0.35 |
Cadmium |
0.22 |
Chromium |
0.16 |
Cobalt |
0.165 |
Germanium |
0.14 |
Gold |
0.71 |
Indium |
0.057 |
Iridium |
0.14 |
Lithium |
0.17 |
Molybdenum |
0.34 |
Niobium |
0.13 |
Palladium |
0.168 |
Platinum |
0.165 |
Plutonium |
0.020 |
Rhenium |
0.17 |
Rhodium |
0.21 |
Silicon |
0.20 |
Silver |
1.0 |
Sodium |
0.32 |
Tantalum |
0.130 |
Thallium |
0.093 |
Thorium |
0.090 |
Tungsten |
0.397 |
Uranium |
0.071 |
Vanadium |
0.074 |
Yttrium |
0.035 |
|
|
Data from ASM Metals Reference Book, Third Edition, Michael Bauccio, Ed., ASM International, Materials Park, OH, p156, (1993).
©2001 CRC Press LLC

Table 104. THERMAL CONDUCTIVITY OF CERAMICS
(SHEET 1 OF 12)
|
|
Thermal Conductivity |
Class |
Ceramic |
(cal • cm-1 • sec-1 • K-1) |
|
|
|
|
|
|
Borides |
Chromium Diboride (CrB2) |
0.049-0.076 at room temp. |
|
Hafnium Diboride (HfB2) |
0.015 at room temp. |
|
Tantalum Diboride (TaB2) |
0.026 at room temp. |
|
|
0.033 at 200 oC. |
|
Titanium Diboride (TiB2) |
0.058-0.062 at room temp. |
|
|
0.063 at 200 oC |
|
Zirconium Diboride (ZrB2) |
0.055-0.058 at room temp. |
|
|
0.055-0.060 at 200 oC |
Carbides |
Boron Carbide (B4C) |
0.065-0.069 at room temp. |
|
|
0.198 at 425 oC |
|
Hafnium Monocarbide (HfC) |
0.053 at room temp. |
|
|
0.15 + 1.20x10 T watts cm-1 K-1 |
|
|
from 1000-2000K |
|
Silicon Carbide (SiC) |
|
|
(with 1 wt% Be addictive) |
0.621 |
|
(with 1 wt% B addictive) |
0.406 |
|
(with 1 wt% Al addictive) |
0.143 |
|
(with 2 wt% BN addictive) |
0.263 |
|
(with 1.6 wt% BeO addictive) |
0.645 at room temp. |
|
(with 3.2 wt% BeO addictive) |
0.645 at room temp. |
|
|
0.098-0.10 at 20oC |
|
|
|
Source: data compiled by J.S. Park from No. 1 Materials Index, Peter T.B. Shaffer, Plenum Press, New York, (1964); Smithells Metals Reference Book, Eric A. Brandes, ed., in association with Fulmer Research Institute Ltd. 6th ed. London, Butterworths, Boston, (1983); and Ceramic Source, American Ceramic Society (1986-1991)
©2001 CRC Press LLC

Table 104. THERMAL CONDUCTIVITY OF CERAMICS
(SHEET 2 OF 12)
|
|
Thermal Conductivity |
Class |
Ceramic |
(cal • cm-1 • sec-1 • K-1) |
|
|
|
|
|
|
|
(cubic, CVD) |
0.289 at 127oC |
|
|
0.049-0.080 at 600oC |
|
|
0.061 at 800oC |
|
|
0.051 at 1000oC |
|
|
0.0059 at 1250oC |
|
|
0.0827 at 1327oC |
|
|
0.0032 at 1530oC |
|
Tantalum Monocarbide (TaC) |
0.053 at room temp. |
|
Titanium Monocarbide (TiC) |
0.041-0.074 at room temp. |
|
|
0.0135 at 1000 oC |
|
Trichromium Dicarbide (Cr3C2) |
0.454 |
|
Tungsten Monocarbide (WC) |
0.201 at 20 oC |
|
(6% Co, 1-3μm grain size) |
0.239 |
|
(12% Co, 1-3μm grain size) |
0.251 |
|
(24% Co, 1-3μm grain size) |
0.239 |
|
(6% Co, 2-4μm grain size) |
0.251 |
|
(6% Co, 3-6μm grain size) |
0.256 |
|
Zirconium Monocarbide (ZrC) |
0.049 at room temp. |
|
|
0.098 at 50oC |
|
|
0.069 at 150oC |
|
|
0.065 at 188oC |
|
|
|
Source: data compiled by J.S. Park from No. 1 Materials Index, Peter T.B. Shaffer, Plenum Press, New York, (1964); Smithells Metals Reference Book, Eric A. Brandes, ed., in association with Fulmer Research Institute Ltd. 6th ed. London, Butterworths, Boston, (1983); and Ceramic Source, American Ceramic Society (1986-1991)
©2001 CRC Press LLC
Table 104. THERMAL CONDUCTIVITY OF CERAMICS
|
(SHEET 3 OF 12) |
|
|
|
|
|
|
Thermal Conductivity |
Class |
Ceramic |
(cal • cm-1 • sec-1 • K-1) |
|
|
|
|
|
|
|
|
0.061 at 288oC |
|
|
0.080 at 600oC |
|
|
0.083 at 800oC |
|
|
0.086 at 1000oC |
|
|
0.089 at 1200oC |
|
|
0.092 at 1400oC |
|
|
0.096 at 1600oC |
|
|
0.099 at 1800oC |
|
|
0.103 at 2000oC |
|
|
0.105 at 2200oC |
Nitrides |
Aluminum Nitride (AlN) |
0.072 at 25oC |
|
|
0.060 at 200oC |
|
|
0.053 at 400oC |
|
|
0.048 at 600oC |
|
|
0.042 at 800oC |
|
Boron Nitride (BN) |
|
|
parallel to c axis |
0.0687 at 300oC |
|
|
0.0646 at 700oC |
|
|
0.0637 at 1000oC |
|
parallel to a axis |
0.0362 at 300oC |
|
|
0.0318 at 700oC |
|
|
0.0295 at 1000oC |
|
|
|
Source: data compiled by J.S. Park from No. 1 Materials Index, Peter T.B. Shaffer, Plenum Press, New York, (1964); Smithells Metals Reference Book, Eric A. Brandes, ed., in association with Fulmer Research Institute Ltd. 6th ed. London, Butterworths, Boston, (1983); and Ceramic Source, American Ceramic Society (1986-1991)
©2001 CRC Press LLC

Table 104. THERMAL CONDUCTIVITY OF CERAMICS
(SHEET 4 OF 12)
|
|
Thermal Conductivity |
Class |
Ceramic |
(cal • cm-1 • sec-1 • K-1) |
|
|
|
|
|
|
|
Titanium Mononitride (TiN) |
0.069 at 25 oC |
|
|
0.057 at 127 oC |
|
|
0.040 at 200 oC |
|
|
0.027 at 650 oC |
|
|
0.020 at 1000 oC |
|
|
0.162 at 1500 oC |
|
|
0.136 at 2300 oC |
|
Trisilicon tetranitride (Si3N4) |
|
|
(pressureless sintered) |
0.072 at room temp. |
|
|
0.022-0.072 at 127 oC |
|
|
0.041 at 200-750 oC |
|
|
0.036-0.042 at 500 oC |
|
(pressureless sintered) |
0.038 at 1000 oC |
|
|
0.033-0.034 at 1200 oC |
|
Zirconium Mononitride (ZrN) |
0.040 at 200 oC |
|
|
0.025 at 425 oC |
|
|
0.018 at 650 oC |
|
|
0.016 at 875 oC |
|
|
0.015 at 1100 oC |
Oxides |
Aluminum Oxide (Al2O3) |
0.06 at room temp. |
|
|
0.04-0.069 at 100oC |
|
|
0.03-0.064 at 200oC |
|
|
0.037 at 315oC |
|
|
|
Source: data compiled by J.S. Park from No. 1 Materials Index, Peter T.B. Shaffer, Plenum Press, New York, (1964); Smithells Metals Reference Book, Eric A. Brandes, ed., in association with Fulmer Research Institute Ltd. 6th ed. London, Butterworths, Boston, (1983); and Ceramic Source, American Ceramic Society (1986-1991)
©2001 CRC Press LLC

Table 104. THERMAL CONDUCTIVITY OF CERAMICS
|
(SHEET 5 OF 12) |
|
|
|
|
|
|
Thermal Conductivity |
Class |
Ceramic |
(cal • cm-1 • sec-1 • K-1) |
|
|
|
|
|
|
|
|
0.02-0.031 at 400oC |
|
|
0.035 at 500oC |
|
|
0.021-0.022 at 600oC |
|
|
0.015-0.017 at 800oC |
|
|
0.014-0.016 at 1000oC |
|
|
0.013-0.015 at 1200oC |
|
|
0.013 at 1400oC |
|
|
0.014 at 1600oC |
|
|
0.017 at 1800oC |
|
Aluminum Oxide (Al2O3) (single crystal) |
0.103 at 20oC |
|
|
0.047 at 300oC |
|
|
0.029 at 800oC |
|
Beryllium Oxide (BeO) |
0.038-0.47 at 20oC |
|
|
0.032-0.34 at 100oC |
|
|
0.14-0.16 at 400oC |
|
|
0.089-0.1137 at 600oC |
|
|
0.060-0.093 at 800oC |
|
|
0.043 at 1100oC |
|
|
0.041-0.054 at 1200oC |
|
|
0.038 at 1300oC |
|
|
|
Source: data compiled by J.S. Park from No. 1 Materials Index, Peter T.B. Shaffer, Plenum Press, New York, (1964); Smithells Metals Reference Book, Eric A. Brandes, ed., in association with Fulmer Research Institute Ltd. 6th ed. London, Butterworths, Boston, (1983); and Ceramic Source, American Ceramic Society (1986-1991)
©2001 CRC Press LLC

Table 104. THERMAL CONDUCTIVITY OF CERAMICS
|
(SHEET 6 OF 12) |
|
|
|
|
|
|
Thermal Conductivity |
Class |
Ceramic |
(cal • cm-1 • sec-1 • K-1) |
|
|
|
|
|
|
|
|
0.036 at 1400oC |
|
|
0.034 at 1500oC |
|
|
0.033-0.039 at 1600oC |
|
|
0.033 at 1700oC |
|
|
0.036 at 1800oC |
|
|
0.036 at 1900oC |
|
|
0.036 at 2000oC |
|
Calcium Oxide (CaO) |
0.037 at 100oC |
|
|
0.027 at 200oC |
|
|
0.022 at 400oC |
|
|
0.020 at 600oC |
|
|
0.019 at 800oC |
|
|
0.0186-0.019 at 1000oC |
|
Cerium Dioxide (CeO2) |
0.0229 at 400K |
|
|
0.00287 at 1400K |
|
Dichromium Trioxide (Cr2O3) |
0.0239-0.0788 |
|
Hafnium Dioxide (HfO2) |
0.0273 at 25-425oC |
|
Magnesium Oxide (MgO) |
0.097 at room temp. |
|
|
0.078-0.082 at 100oC |
|
|
0.064-0.065 at 200oC |
|
|
0.038-0.045 at 400oC |
|
|
|
Source: data compiled by J.S. Park from No. 1 Materials Index, Peter T.B. Shaffer, Plenum Press, New York, (1964); Smithells Metals Reference Book, Eric A. Brandes, ed., in association with Fulmer Research Institute Ltd. 6th ed. London, Butterworths, Boston, (1983); and Ceramic Source, American Ceramic Society (1986-1991)
©2001 CRC Press LLC

Table 104. THERMAL CONDUCTIVITY OF CERAMICS
|
(SHEET 7 OF 12) |
|
|
|
|
|
|
Thermal Conductivity |
Class |
Ceramic |
(cal • cm-1 • sec-1 • K-1) |
|
|
|
|
|
|
|
|
0.0198-0.026 at 800oC |
|
|
0.016-0.020 at 1000oC |
|
|
0.0139-0.0148 at 1200oC |
|
|
0.012-0.014 at 1400oC |
|
|
0.0108-0.016 at 1600oC |
|
|
0.0096-0.0191 at 1800oC |
|
Nickel monoxide (NiO) |
|
|
(0% porosity) |
0.029 at 100oC |
|
(0% porosity) |
0.024 at 200oC |
|
(0% porosity) |
0.017 at 400oC |
|
(0% porosity) |
0.012 at 800oC |
|
(0% porosity) |
0.011 at 1000oC |
|
Silicon Dioxide (SiO2) |
0.0025 at 200oC |
|
|
0.003 at 400oC |
|
|
0.004 at 800oC |
|
|
0.005 at 1200oC |
|
|
0.006 at 1600oC |
|
Thorium Dioxide (ThO2) |
|
|
(0% porosity) |
0.024 at room temp. |
|
(0% porosity) |
0.020 at 100oC |
|
(0% porosity) |
0.019 at 200oC |
|
(0% porosity) |
0.014 at 400oC |
|
(0% porosity) |
0.010 at 600oC |
|
(0% porosity) |
0.008 at 800oC |
|
|
|
Source: data compiled by J.S. Park from No. 1 Materials Index, Peter T.B. Shaffer, Plenum Press, New York, (1964); Smithells Metals Reference Book, Eric A. Brandes, ed., in association with Fulmer Research Institute Ltd. 6th ed. London, Butterworths, Boston, (1983); and Ceramic Source, American Ceramic Society (1986-1991)
©2001 CRC Press LLC

Table 104. THERMAL CONDUCTIVITY OF CERAMICS
(SHEET 8 OF 12)
|
|
Thermal Conductivity |
Class |
Ceramic |
(cal • cm-1 • sec-1 • K-1) |
|
|
|
|
|
|
|
(0% porosity) |
0.007-0.0074 at 1000oC |
|
(0% porosity) |
0.006-0.0076 at 1200oC |
|
(0% porosity) |
0.006 at 1400oC |
|
Titanium Oxide (TiO2) |
|
|
(0% porosity) |
0.016 at 100oC |
|
(0% porosity) |
0.012 at 200oC |
|
(0% porosity) |
0.009 at 400oC |
|
(0% porosity) |
0.008 at 600oC |
|
(0% porosity) |
0.008 at 800oC |
|
(0% porosity) |
0.008 at 1000oC |
|
(0% porosity) |
0.008 at 1200oC |
|
Uranium Dioxide (UO2) |
|
|
(0% porosity) |
0.025 at 100oC |
|
(0% porosity) |
0.020 at 200oC |
|
(0% porosity) |
0.015 at 400oC |
|
(0% porosity) |
0.010 at 600oC |
|
(0% porosity) |
0.009 at 800oC |
|
(0% porosity) |
0.008 at 1000oC |
|
|
0.018 at 100oC |
|
|
0.012 at 400oC |
|
|
0.008 at 600oC |
|
|
|
Source: data compiled by J.S. Park from No. 1 Materials Index, Peter T.B. Shaffer, Plenum Press, New York, (1964); Smithells Metals Reference Book, Eric A. Brandes, ed., in association with Fulmer Research Institute Ltd. 6th ed. London, Butterworths, Boston, (1983); and Ceramic Source, American Ceramic Society (1986-1991)
©2001 CRC Press LLC

Table 104. THERMAL CONDUCTIVITY OF CERAMICS
|
(SHEET 9 OF 12) |
|
|
|
|
|
|
Thermal Conductivity |
Class |
Ceramic |
(cal • cm-1 • sec-1 • K-1) |
|
|
|
|
|
|
|
|
0.008 at 700oC |
|
|
0.006 at 1000oC |
|
|
0.006 at 1200oC |
|
Zirconium Oxide (ZrO2) |
|
|
(stabilized, 0% porosity) |
0.005 at 100oC |
|
(stabilized, 0% porosity) |
0.005 at 200oC |
|
(stabilized, 0% porosity) |
0.005 at 400oC |
|
(stabilized, 0% porosity) |
0.0055 at 800oC |
|
(stabilized, 0% porosity) |
0.006 at 1200oC |
|
(stabilized, 0% porosity) |
0.0065 at 1400oC |
|
(stabilized) |
0.004 at 100oC |
|
(stabilized) |
0.0044 at 500oC |
|
(stabilized) |
0.0048-0.0055 at 1000oC |
|
(stabilized) |
0.0049-0.0050 at 1200oC |
|
(MgO stabilized) |
0.0076 at room temp. |
|
(MgO stabilized) |
0.0057 at 800oC |
|
(Y2O3 stabilized) |
0.0055 at room temp. |
|
(Y2O3 stabilized) |
0.0053 at 800oC |
|
(plasma sprayed) |
0.0019-0.0031 at room temp. |
|
(plasma sprayed) |
0.0019-0.0022 at 800oC |
|
(plasma sprayed and coated with Cr2O3) |
0.0033 at room temp. |
|
(plasma sprayed and coated with Cr2O3) |
0.0033 at 800oC |
|
|
|
Source: data compiled by J.S. Park from No. 1 Materials Index, Peter T.B. Shaffer, Plenum Press, New York, (1964); Smithells Metals Reference Book, Eric A. Brandes, ed., in association with Fulmer Research Institute Ltd. 6th ed. London, Butterworths, Boston, (1983); and Ceramic Source, American Ceramic Society (1986-1991)
©2001 CRC Press LLC

Table 104. THERMAL CONDUCTIVITY OF CERAMICS
(SHEET 10 OF 12)
|
|
Thermal Conductivity |
Class |
Ceramic |
(cal • cm-1 • sec-1 • K-1) |
|
|
|
|
|
|
|
(5-10% CaO stabilized) |
0.0045 at 400oC |
|
(5-10% CaO stabilized) |
0.0049 at 800oC |
|
(5-10% CaO stabilized) |
0.0057 at 1200oC |
|
Cordierite (2MgO 2Al2O3 5SiO2) |
|
|
(ρ=2.3g/cm3) |
0.0077 at 20oC |
|
(ρ=2.3g/cm3) |
0.0062 at 300oC |
|
(ρ=2.3g/cm3) |
0.0055 at 500oC |
|
(ρ=2.3g/cm3) |
0.0055 at 800oC |
|
(ρ=2.1g/cm3) |
0.0043 at 20oC |
|
(ρ=2.1g/cm3) |
0.0041 at 300oC |
|
(ρ=2.1g/cm3) |
0.0040 at 500oC |
|
(ρ=2.1g/cm3) |
0.0038 at 800oC |
|
Mullite (3Al2O3 2SiO2) |
|
|
(0% porosity) |
0.0145 at 100oC |
|
(0% porosity) |
0.013 at 200oC |
|
(0% porosity) |
0.011 at 400oC |
|
(0% porosity) |
0.010 at 600oC |
|
(0% porosity) |
0.0095 at 800oC |
|
(0% porosity) |
0.009 at 1000oC |
|
(0% porosity) |
0.009 at 1200oC |
|
(0% porosity) |
0.009 at 1400oC |
|
|
|
Source: data compiled by J.S. Park from No. 1 Materials Index, Peter T.B. Shaffer, Plenum Press, New York, (1964); Smithells Metals Reference Book, Eric A. Brandes, ed., in association with Fulmer Research Institute Ltd. 6th ed. London, Butterworths, Boston, (1983); and Ceramic Source, American Ceramic Society (1986-1991)
©2001 CRC Press LLC

Table 104. THERMAL CONDUCTIVITY OF CERAMICS
(SHEET 11 OF 12)
|
|
Thermal Conductivity |
Class |
Ceramic |
(cal • cm-1 • sec-1 • K-1) |
|
|
|
|
|
|
|
Sillimanite (Al2O3 SiO2) |
|
|
(0% porosity) |
0.0042 at 100oC |
|
(0% porosity) |
0.004 at 400oC |
|
(0% porosity) |
0.0035 at 800oC |
|
(0% porosity) |
0.0035 at 1200oC |
|
(0% porosity) |
0.003 at 1500oC |
|
Spinel (Al2O3 MgO) |
|
|
(0% porosity) |
0.035 at 100oC |
|
(0% porosity) |
0.031 at 200oC |
|
(0% porosity) |
0.024 at 400oC |
|
(0% porosity) |
0.019 at 600oC |
|
(0% porosity) |
0.015 at 800oC |
|
(0% porosity) |
0.013-0.0138 at 1000oC |
|
(0% porosity) |
0.013 at 1200oC |
|
Zircon (SiO2 ZrO2) |
|
|
(0% porosity) |
0.0145 at 100oC |
|
(0% porosity) |
0.0135 at 200oC |
|
(0% porosity) |
0.012 at 400oC |
|
(0% porosity) |
0.010 at 800oC |
|
(0% porosity) |
0.0095 at 1200oC |
|
(0% porosity) |
0.0095 at 1400oC |
|
|
|
Source: data compiled by J.S. Park from No. 1 Materials Index, Peter T.B. Shaffer, Plenum Press, New York, (1964); Smithells Metals Reference Book, Eric A. Brandes, ed., in association with Fulmer Research Institute Ltd. 6th ed. London, Butterworths, Boston, (1983); and Ceramic Source, American Ceramic Society (1986-1991)
©2001 CRC Press LLC

Table 104. THERMAL CONDUCTIVITY OF CERAMICS
(SHEET 12 OF 12)
|
|
Thermal Conductivity |
Class |
Ceramic |
(cal • cm-1 • sec-1 • K-1) |
|
|
|
|
|
|
Silicides |
Molybdenum Disilicide (MoSi2) |
0.129 at 150oC |
|
|
0.074 at 425oC |
|
|
0.053 at 540oC |
|
|
0.057 at 650oC |
|
|
0.046 at 875oC |
|
|
0.041 at 1100oC |
|
|
|
Source: data compiled by J.S. Park from No. 1 Materials Index, Peter T.B. Shaffer, Plenum Press, New York, (1964); Smithells Metals Reference Book, Eric A. Brandes, ed., in association with Fulmer Research Institute Ltd. 6th ed. London, Butterworths, Boston, (1983); and Ceramic Source, American Ceramic Society (1986-1991)
©2001 CRC Press LLC
Table 105. THERMAL CONDUCTIVITY OF GLASSES
(SHEET 1 OF 5)
|
|
Thermal |
|
Temperature Range |
Glass |
Description |
Conductivity |
Units |
of Validity |
|
|
|
|
|
|
|
|
|
|
SiO2 glass |
|
0.00329 |
cal/cm s K |
20˚C |
|
|
0.59 |
W/m K |
80˚C |
|
|
0.67 |
W/m K |
100˚C |
|
|
0.88 |
W/m K |
150˚C |
|
|
1.10 |
W/m K |
200˚C |
|
|
1.28 |
W/m K |
250˚C |
|
|
1.32 |
W/m K |
273.1˚C |
|
|
1.36 |
W/m K |
300˚C |
|
|
1.43 |
W/m K |
350˚C |
|
|
1.50 |
W/m K |
400˚C |
|
|
1.62 |
W/m K |
500˚C |
|
|
1.72 |
W/m K |
600˚C |
|
|
1.80 |
W/m K |
700˚C |
|
|
|
|
|
Source: compiled by J.S. Park from O. V. Mazurin, M. V. Streltsina and T. P. Shvaiko-Shvaikovskaya, Handbook of Glass Data, Part A and Part B, Elsevier, New York, 1983
©2001 CRC Press LLC

Table 105. THERMAL CONDUCTIVITY OF GLASSES
(SHEET 2 OF 5)
|
|
Thermal |
|
Temperature Range |
Glass |
Description |
Conductivity |
Units |
of Validity |
SiO2-Na2O glass |
(22% mol Na2O) |
0.70 |
kcal/m hr K |
450˚C |
|
(22% mol Na2O) |
0.90 |
kcal/m hr K |
850˚C |
|
(22% mol Na2O) |
1.20 |
kcal/m hr K |
1050˚C |
|
(22% mol Na2O) |
1.55 |
kcal/m hr K |
1250˚C |
|
(22% mol Na2O) |
2.25 |
kcal/m hr K |
1500˚C |
|
(25% mol Na2O) |
0.15 |
W/m K |
35 K |
|
(25% mol Na2O) |
0.25 |
W/m K |
60 K |
|
(25% mol Na2O) |
0.40 |
W/m K |
80 K |
|
(25% mol Na2O) |
0.50 |
W/m K |
100 K |
|
(25% mol Na2O) |
0.60 |
W/m K |
140 K |
|
(25% mol Na2O) |
0.65 |
W/m K |
150 K |
|
(25% mol Na2O) |
0.80 |
W/m K |
190 K |
|
(25% mol Na2O) |
0.85 |
W/m K |
240 K |
Source: compiled by J.S. Park from O. V. Mazurin, M. V. Streltsina and T. P. Shvaiko-Shvaikovskaya, Handbook of Glass Data, Part A and Part B, Elsevier, New York, 1983
©2001 CRC Press LLC
Table 105. THERMAL CONDUCTIVITY OF GLASSES
(SHEET 3 OF 5)
|
|
Thermal |
|
Temperature Range |
Glass |
Description |
Conductivity |
Units |
of Validity |
SiO2-Na2O glass (Con’t) |
(25% mol Na2O) |
0.90 |
W/m K |
280 K |
|
(25% mol Na2O) |
0.95 |
W/m K |
300 K |
|
(27% mol Na2O) |
0.68 |
kcal/m hr K |
450˚C |
|
(27% mol Na2O) |
0.85 |
kcal/m hr K |
850˚C |
|
(27% mol Na2O) |
1.10 |
kcal/m hr K |
1050˚C |
|
(27% mol Na2O) |
1.45 |
kcal/m hr K |
1250˚C |
|
(27% mol Na2O) |
1.80 |
kcal/m hr K |
1500˚C |
|
(34.05% mol Na2O) |
0.5 |
kcal/m hr K |
450˚C |
|
(34.05% mol Na2O) |
0.75 |
kcal/m hr K |
850˚C |
|
(34.05% mol Na2O) |
0.75 |
kcal/m hr K |
1050˚C |
|
(34.05% mol Na2O) |
1.20 |
kcal/m hr K |
1250˚C |
|
(34.05% mol Na2O) |
1.5 |
kcal/m hr K |
1500˚C |
Source: compiled by J.S. Park from O. V. Mazurin, M. V. Streltsina and T. P. Shvaiko-Shvaikovskaya, Handbook of Glass Data, Part A and Part B, Elsevier, New York, 1983
©2001 CRC Press LLC

Table 105. THERMAL CONDUCTIVITY OF GLASSES
(SHEET 4 OF 5)
|
|
Thermal |
|
Temperature Range |
Glass |
Description |
Conductivity |
Units |
of Validity |
|
|
|
|
|
|
|
|
|
|
SiO2-PbO glass |
(51.9% mol PbO) |
0.00089 |
cal/cm s K |
-150˚C |
|
(51.9% mol PbO) |
0.00100 |
cal/cm s K |
-100˚C |
|
(51.9% mol PbO) |
0.00111 |
cal/cm s K |
-50˚C |
|
(51.9% mol PbO) |
0.00123 |
cal/cm s K |
0˚C |
|
(51.9% mol PbO) |
0.00134 |
cal/cm s K |
50˚C |
|
(51.9% mol PbO) |
0.00146 |
cal/cm s K |
100˚C |
|
(49.3% mol PbO) |
0.00130 |
cal/cm s K |
40˚C |
|
(66.2% mol PbO) |
0.00112 |
cal/cm s K |
40˚C |
B2O3 glass |
|
0.5 |
mW/cm K |
2K |
|
|
0.75 |
mW/cm K |
5K |
|
|
1.5 |
mW/cm K |
20K |
B2O3-Na2O glass |
(3% mol Na2O) |
1.7 + 0.0054 (T-900) |
W/m K |
1173-1373 K |
|
(7% mol Na2O) |
1.5 + 0.0045 (T-900) |
W/m K |
1173-1373 K |
|
(11% mol Na2O) |
1.25 + 0.0037 (T-900) |
W/m K |
1173-1373 K |
|
|
|
|
|
Source: compiled by J.S. Park from O. V. Mazurin, M. V. Streltsina and T. P. Shvaiko-Shvaikovskaya, Handbook of Glass Data, Part A and Part B, Elsevier, New York, 1983
©2001 CRC Press LLC

Table 105. THERMAL CONDUCTIVITY OF GLASSES
(SHEET 5 OF 5)
|
|
Thermal |
|
Temperature Range |
Glass |
Description |
Conductivity |
Units |
of Validity |
B2O3-Na2O glass (Con’t) |
(14% mol Na2O) |
1.15 + 0.0020 (T-900) |
W/m K |
1173-1373 K |
|
(19% mol Na2O) |
1.0 + 0.0012 (T-900) |
W/m K |
1173-1373 K |
|
(25% mol Na2O) |
0.85 + 0.00075 (T-900) |
W/m K |
1173-1373 K |
|
(31% mol Na2O) |
0.9 + 0.00080 (T-900) |
W/m K |
1173-1373 K |
B2O3-PbO glass |
(27.6% mol PbO) |
0.522±0.022 |
W/m K |
30˚C |
|
(31.9% mol PbO) |
0.483±0.016 |
W/m K |
30˚C |
|
(36.7% mol PbO) |
0.464±0.010 |
W/m K |
30˚C |
|
(42.1% mol PbO) |
0.433±0.018 |
W/m K |
30˚C |
|
(48.3% mol PbO) |
0.406±0.020 |
W/m K |
30˚C |
|
(55.5% mol PbO) |
0.381±0.015 |
W/m K |
30˚C |
|
(64.0% mol PbO) |
0.351±0.011 |
W/m K |
30˚C |
Source: compiled by J.S. Park from O. V. Mazurin, M. V. Streltsina and T. P. Shvaiko-Shvaikovskaya, Handbook of Glass Data, Part A and Part B, Elsevier, New York, 1983
©2001 CRC Press LLC

z
Table 106. THERMAL CONDUCTIVITY OF
CRYOGENIC INSULATION
|
|
Thermal Conductivity |
Interspace |
|
|
|
Range |
||
|
Cryogenic |
Pressure |
||
Class* |
(mW • m–1 • K–1) |
|||
Insulation |
(mm Hg) |
|||
|
|
|
|
|
|
|
|
|
|
2 |
Multilayer |
0.04—0.2 |
10–4 |
|
3 |
Opacified powder |
0.26—0.7 |
10–4 |
|
4 |
Evacuated powder |
1.0—2.0 |
10–4 |
|
5 |
Vacuum flask |
5.0 |
10–6 |
|
6 |
Gas–filled powder |
1.7—7.0 |
760 |
|
7 |
Expanded foam |
5.0—35 |
760 |
|
8 |
Fiber blanket |
35—45 |
760 |
|
|
|
|
|
To convert mm Hg to N • m–2 multiply by 133.32.
Source: From Boltz, R. E. and Tuve, G. L., Eds., Handbook of Tables for Applied Engineering Science, 2nd ed., CRC Press, Cleveland, 1973, 529.
*1. Liquid and vapor shields – Very low–temperature, valuable, or dangerous liquids such as helium or fluorine are often shielded by an intermediate cryogenic liquid or vapor container that must in turn be insulated by one of the methods described below.
2.Multilayer reflecting shields – Foil or aluminized plastic alternated with paper-thin glass or plastic-fiber sheets; lowest conductivity, low density, and heat storage; good stability; minimum support structure.
3.Opacified evacuated powders - Contain metallic flakes to reduce radiation; conform to irregular shapes.
4.Evacuated dielectric powders - Very fine powders of low-conductivity adsorbent; moderate vacuum requirement; minimum fire hazard in oxygen.
5.Vacuum flasks (Dewar) - Tight shield-space with highly. reflecting walls and high vacuum; minimum heat capacity; rugged; small thickness.
6.Gas-filled powders – Same powders as Class 4 but with air or inert gas; low cost; easy application; no vacuum requirement.
7.Expanded foams – Very light foamed plastic; inexpensive; minimum weight but bulky; self supporting.
8.Porous fiber blankets – Blanket material of fine fibers, usually glass; minimum cost and easy installation but not an adequate insulation for most cryogenic applications.
©2001 CRC Press LLC

Table 107. THERMAL CONDUCTIVITY OF
CRYOGENIC SUPPORTS
Insulation |
Mean Thermal Conductivity * |
|
(W • m–1 • K–1) |
||
Support |
||
|
|
|
|
|
|
Aluminum alloy |
86 |
|
“K” Monel® |
17 |
|
Stainbss steel |
9.3 |
|
Titanhm alloy |
6.1 |
|
Nylon |
0.29 |
|
Teflon |
0.24 |
|
|
|
Source: From Boltz, R. E. and Tuve, G. L., Eds., Handbook of Tables for Applied Engineering Science, 2nd ed., CRC Press, Cleveland, 1973, 529.
*Range of Validity is 20–300 K.
©2001 CRC Press LLC

Table 108. THERMAL CONDUCTIVITY OF SPECIAL CONCRETES*
|
Thermal Conductivity |
Description; type of aggregate |
Btu / (hr • ft • ˚F) |
|
|
|
|
Frost resisting; 1% CaCl2; normal aggregates |
1.0 |
Frost-resisting porous;6% air entrainment |
0.85 |
Lightweight; with expanded shale or clay |
0.25 |
Lightweight; with foamed slag |
0.20 |
Cinder concrete; fine and coarse |
0.25 |
Pulverized fuel ash |
0.25 |
Lightweight refractory concrete with aluminous cement |
0.20 |
Lightweight; insulating, with perlite |
0.15 |
Lightweight; insulating, with expanded vermiculite |
0.10 |
|
|
Source: from Bolz, R. E. and Tuve, C. L., Eds., Handbook of Tables for Applied Engineering Science, 2nd ed., CRC Press, Cleveland, 1973, p.645.
*A great many varieties of aggregates have been used for concrete, dependent largely on the materials available. In general, high density concretes have high strength and high thermal conductivity, although such variables as water/cement ratio, percentage of fines, and curing conditions may result in wide differences in properties with the same materials.
©2001 CRC Press LLC

Table 109. THERMAL CONDUCTIVITY OF
SIC-WHISKER-REINFORCED CERAMICS
|
Thermal Conductivity |
||
|
|
(W/m • K) |
|
|
|
|
|
Composite |
at 22 °C |
|
at 600 °C |
|
|
|
|
|
|
|
|
Alumina |
36 ± 5 |
|
12 ± 3 |
Alumina with 20 vol% SiC whiskers |
32 |
|
16 |
SiC |
95 |
|
50 |
Mullite with 20 vol% SiC whiskers |
7.2 |
|
— |
|
|
|
|
Data from ASM Engineering Materials Reference Book, Second Edition, Michael Bauccio, Ed., ASM International, Materials Park, OH, p173,(1994).
©2001 CRC Press LLC

Table 110. THERMAL CONDUCTIVITY OF POLYMERS
(SHEET 1 OF 10)
|
|
Thermal Conductivity |
|
|
(ASTM C177) |
Class |
Polymer |
Btu / (hr • ft • ˚F) |
|
|
|
|
|
|
ABS Resins; Molded, Extruded |
Medium impact |
0.08—0.18 |
|
High impact |
0.12—0.16 |
|
Very high impact |
0.01—0.14 |
|
Low temperature impact |
0.08—0.14 |
|
Heat resistant |
0.12—0.20 |
Acrylics; Cast, Molded, Extruded |
Cast Resin Sheets, Rods: |
|
|
General purpose, type I |
0.12 |
|
General purpose, type II |
0.12 |
|
Moldings: |
|
|
Grades 5, 6, 8 |
0.12 |
|
High impact grade |
0.12 |
Thermoset Carbonate |
Allyl diglycol carbonate |
1.45 |
|
|
|
Source: data compiled by J.S. Park from Charles T. Lynch, CRC Handbook of Materials Science, Vol. 3, CRC Press, Boca Raton, Florida, 1975 and Engineered Materials Handbook, Vol.2, Engineering Plastics, ASM International, Metals Park, Ohio, 1988.
©2001 CRC Press LLC
Table 110. THERMAL CONDUCTIVITY OF POLYMERS
(SHEET 2 OF 10)
|
|
Thermal Conductivity |
|
|
(ASTM C177) |
Class |
Polymer |
Btu / (hr • ft • ˚F) |
|
|
|
|
|
|
Alkyds; Molded |
Putty (encapsulating) |
0.35—0.60 |
|
Rope (general purpose) |
0.35—0.60 |
|
Granular (high speed molding) |
0.35—0.60 |
|
Glass reinforced (heavy duty parts) |
0.20—0.30 |
Cellulose Acetate; Molded, Extruded |
ASTM Grade: |
|
|
H6—1 |
0.10—0.19 |
|
H4—1 |
0.10—0.19 |
|
H2—1 |
0.10—0.19 |
|
MH—1, MH—2 |
0.10—0.19 |
|
MS—1, MS—2 |
0.10—0.19 |
|
S2—1 |
0.10—0.19 |
|
|
|
Source: data compiled by J.S. Park from Charles T. Lynch, CRC Handbook of Materials Science, Vol. 3, CRC Press, Boca Raton, Florida, 1975 and Engineered Materials Handbook, Vol.2, Engineering Plastics, ASM International, Metals Park, Ohio, 1988.
©2001 CRC Press LLC

Table 110. THERMAL CONDUCTIVITY OF POLYMERS
(SHEET 3 OF 10)
|
|
Thermal Conductivity |
|
|
(ASTM C177) |
Class |
Polymer |
Btu / (hr • ft • ˚F) |
|
|
|
|
|
|
Cellulose Acetate Butyrate; |
ASTM Grade: |
|
Molded, Extruded |
|
|
|
|
|
|
H4 |
0.10—0.19 |
|
MH |
0.10—0.19 |
|
S2 |
0.10—0.19 |
Cellulose Acetate Propionate; Molded, Extruded |
ASTM Grade: |
|
|
1 |
0.10—0.19 |
|
3 |
0.10—0.19 |
|
6 |
0.10—0.19 |
Chlorinated Polymers |
Chlorinated polyether |
0.91 |
|
Chlorinated polyvinyl chloride |
0.95 |
Polycarbonates |
Polycarbonate |
0.11 |
|
Polycarbonate (40% glass fiber reinforced) |
0.13 |
|
|
|
Source: data compiled by J.S. Park from Charles T. Lynch, CRC Handbook of Materials Science, Vol. 3, CRC Press, Boca Raton, Florida, 1975 and Engineered Materials Handbook, Vol.2, Engineering Plastics, ASM International, Metals Park, Ohio, 1988.
©2001 CRC Press LLC

Table 110. THERMAL CONDUCTIVITY OF POLYMERS
(SHEET 4 OF 10)
|
|
Thermal Conductivity |
|
|
(ASTM C177) |
Class |
Polymer |
Btu / (hr • ft • ˚F) |
|
|
|
|
|
|
Fluorocarbons; Molded,Extruded |
Polytrifluoro chloroethylene (PTFCE) |
0.145 |
|
Polytetrafluoroethylene (PTFE) |
0.14 |
|
Fluorinated ethylene propylene(FEP) |
0.12 |
|
Polyvinylidene— fluoride (PVDF) |
0.14 |
Epoxies; Cast, Molded, Reinforced |
Standard epoxies (diglycidyl ethers of bisphenol |
|
A) |
|
|
|
|
|
|
Cast rigid |
0.1—0.3 |
|
Molded |
0.1—0.5 |
|
High strength laminate |
2.35 |
Melamines; Molded |
Filler & type |
|
|
Cellulose electrical |
0.17—0.20 |
|
Glass fiber |
0.28 |
Nylons; Molded, Extruded |
Type 6 |
|
|
General purpose |
1.2—1.69 |
|
Glass fiber (30%) reinforced |
1.69—3.27 |
|
Cast |
1.2—1.7 |
Source: data compiled by J.S. Park from Charles T. Lynch, CRC Handbook of Materials Science, Vol. 3, CRC Press, Boca Raton, Florida, 1975 and Engineered Materials Handbook, Vol.2, Engineering Plastics, ASM International, Metals Park, Ohio, 1988.
©2001 CRC Press LLC

Table 110. THERMAL CONDUCTIVITY OF POLYMERS
(SHEET 5 OF 10)
|
|
Thermal Conductivity |
|
|
(ASTM C177) |
Class |
Polymer |
Btu / (hr • ft • ˚F) |
|
|
|
|
|
|
Nylons; Molded, Extruded (Con’t) |
Type 11 |
1.5 |
|
Type 12 |
1.7 |
|
6/6 Nylon |
|
|
General purpose molding |
1.69—1.7 |
|
Glass fiber reinforced |
1.5— 3.3 |
|
General purpose extrusion |
1.7 |
|
6/10 Nylon |
|
|
General purpose |
1.5 |
|
Glass fiber (30%) reinforced |
3.5 |
Phenolics; Molded |
Type and filler |
|
|
General: woodflour and flock |
0.097—0.3 |
|
Shock: paper, flock, or pulp |
0.1—0.16 |
|
High shock: chopped fabric or cord |
0.097—0.170 |
|
Very high shock: glass fiber |
0.2 |
|
|
|
Source: data compiled by J.S. Park from Charles T. Lynch, CRC Handbook of Materials Science, Vol. 3, CRC Press, Boca Raton, Florida, 1975 and Engineered Materials Handbook, Vol.2, Engineering Plastics, ASM International, Metals Park, Ohio, 1988.
©2001 CRC Press LLC

Table 110. THERMAL CONDUCTIVITY OF POLYMERS
(SHEET 6 OF 10)
|
|
Thermal Conductivity |
|
|
(ASTM C177) |
Class |
Polymer |
Btu / (hr • ft • ˚F) |
|
|
|
|
|
|
Phenolics: Molded |
Arc resistant—mineral |
0.24—0.34 |
|
Rubber phenolic—woodflour or flock |
0.12 |
|
Rubber phenolic—chopped fabric |
0.05 |
|
Rubber phenolic—asbestos |
0.04 |
|
ABS–Polycarbonate Alloy |
2.46 (per ft) |
PVC–Acrylic Alloy |
PVC–acrylic sheet |
1.01 |
|
PVC–acrylic injection molded |
0.98 |
Polymides |
Unreinforced |
6.78 |
|
Unreinforced 2nd value |
3.8 |
|
Glass reinforced |
3.59 |
|
|
|
Source: data compiled by J.S. Park from Charles T. Lynch, CRC Handbook of Materials Science, Vol. 3, CRC Press, Boca Raton, Florida, 1975 and Engineered Materials Handbook, Vol.2, Engineering Plastics, ASM International, Metals Park, Ohio, 1988.
©2001 CRC Press LLC


Shackelford, James F. and Alexander, W. “Mechanical Properties of Materials”
Materials Science and Engineering Handbook
Ed. James F. Shackelford & W. Alexander Boca Raton: CRC Press LLC, 2001