- •1. TABLE OF CONTENTS
- •2. QUALITY CONTROL
- •2.1 INTRODUCTION TO QUALITY
- •2.2 PRACTICE PROBLEMS
- •3. STATISTICAL PROCESS CONTROL
- •3.1 CONTROL CHARTS
- •3.1.1 Sampling
- •3.1.2 Creating the Charts
- •3.1.3 Maintaining the Charts
- •3.1.4 The s-Chart
- •3.1.5 Interpreting the Control Charts
- •3.1.6 Using the Charts for Process Control
- •3.1.7 Practice Problems
- •3.2 CONTROL CHARTS FOR ATTRIBUTES
- •4. INSPECTION FOR QUALITY
- •4.1 ACCEPTANCE OF LOTS
- •4.2 SCREENING
- •4.3 THE COST OF SAMPLING
- •4.4 SINGLE/DOUBLE/MULTIPLE SAMPLED PLANS
- •4.5 OPERATING CHARACTERISTIC (OC) CURVES
- •4.5.1 Practice Problems
- •4.6 MIL-STD-105D AND ANSI/ASQC Z1.4-1981
- •4.6.1 Practice Problem
- •4.7 ANSERED QUESTIONS
- •4.8 UNANSWERED PROBLEMS
- •4.9 QUALITY CONTROL PROJECTS
- •4.9.1 Measuring for Quality Control
- •4.9.2 Evaluation of Metrology Equipment
- •4.10 ANSWERS TO SELECTED PROBLEMS:
- •4.11 QUALITY CONTROL FORMS
- •5. QFD (QUALITY FUNCTIONAL DEPLOYMENT)
- •5.1 REFERENCES
- •6. DETERMINING CAUSES OF PROBLEMS
- •6.1 CAUSE AND EFFECT DIAGRAMS
- •6.1.1 Process Diagrams
- •6.2 PARETO DIAGRAM
- •6.3 MATRIX ANALYSIS
- •7. TOTAL QUALITY CONTROL
- •8. W. EDWARD DEMING’S 14 POINTS
- •9. TOTAL QUALITY MANAGEMENT (TQM)
- •10. PROCESS CAPABILITY
- •11. SIX SIGMA QUALITY
- •12. DESIGN OF EXPERIMENTS
- •12.1 OVERVIEW
- •12.2 n-FACTORIAL
- •13. TAGUCHI METHODS
- •14. REFERENCES
- •15. DESIGN OF EXPERIMENTS
- •15.1 OVERVIEW
- •15.2 n-FACTORIAL
- •15.3 PRACTICE PROBLEMS
- •15.4 REFERENCES
- •17.1 PRACTICE PROBLEMS

page 45
5. A report and presentation will be completed.
4.10 ANSWERS TO SELECTED PROBLEMS:
1. Based on exact calculations
13.539
X
12.414
11.289
5.163
R
3
.8367
1.932
s
1.038
0.144
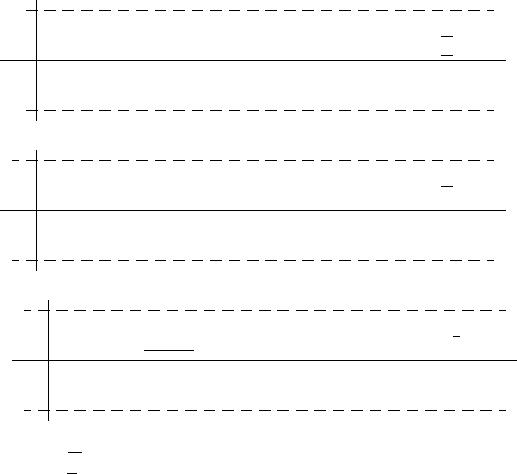
Approximate control limits
UCLX = 13.671
LCLX = 11.157
UCLR = 5.772
LCLR = 0.228
UCLs = 1.954
LCLs = 0.122
2. We have nonconforming units with a constant sample size, therefore select an np chart.

page 46
sub-group |
n |
np |
|
|
|
1 |
500 |
6 |
2 |
500 |
3 |
3 |
500 |
10 |
4 |
500 |
5 |
5 |
500 |
2 |
6 |
500 |
4 |
|
|
|
|
3000 |
30 |
|
|
|
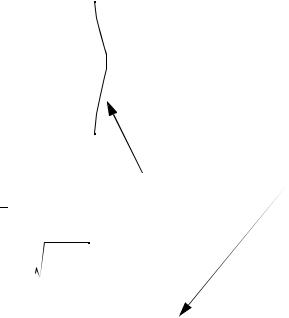
p0 = 4/500 = .008 np0 = 4
UCL = 4 + 3
 4( 1 – 0.008) = 9.976
LCL = 4 – 3
 4( 1 – 0.008) = –1.976
|
|
|
|
|
|
|
|
|
|
|
|
|
|
|
|
|
|
|
|
|
|
|
|
|
|
|
|
|
|
|
|
|
|
|
|
|
|
|
|
|
|
|
|
|
|
|
|
|
|
|
|
9.976 |
|
|
|
|
|
|
|
|
|
|
|
|
|
|
|
|
|
|
|
|
|
|
out of control |
||||||||||||||||||||||||||||
|
|
|
|
|
|
|
|
|
|
|
|
|
|
|
|
|
|
|
|
|
|
|
|
|
(maybe stop, or choose to continue) |
||||||||||||||||||||||||||
4 |
|
|
|
|
|
|
|
|
|
|
|
|
|
|
|
|
|
|
|
|
|
|
|
|
|
|
|
|
|
|
|
|
|
|
|
|
|
|
|
|
|
|
|
|
|
|
|
|
|
|
|
0 |
|
|
|
|
|
|
|
|
|
|
|
|
|
|
|
|
|
|
|
|
|
|
|
|
|
|
|
|
|
|
|
|
|
|
|
|
|
|
|
|
|
|
|
|
|
|
|
|
|
|
|
|
|
|
|
|
|
|
|
|
|
|
|
|
|
|
|
|
|
|
|
|
|
|
|
|
|
|
|
|
|
|
|
|
|
|
|
|
|
|
|
|
|
|
|
|
|
|
|
|
|
|
|

page 47
Data |
tally/histogram |
Count |
Rank |
% |
|
||
2 |
I |
1 |
|
1 |
4.17 |
|
|
3 |
II |
2 |
|
2,3 |
12.5, 20.83 |
||
4 |
II |
2 |
|
4,5 |
29.2, 37.5 |
||
5 |
II |
2 |
|
6,7 |
45.8, 54.2 |
||
6 |
II |
2 |
|
8,9 |
62.5, 70.8 |
||
7 |
II |
2 |
|
10,11 |
79.2, 87.5 |
||
8 |
|
|
0 |
|
|
|
|
9 |
I |
1 |
|
12 |
95.8 |
|
|
|
|
|
|
|
|
|
|
|
method 1 |
n=12 |
|
|
|
||
data appears slightly platykurtic, and slightly skewed to right
X = 5.083 |
|
|||
σ |
= 44.917--------------- = 2.021 |
|||
|
|
12.1 |
method 2 |
|
a3 |
= |
25.809 |
= 0.26 |
|
12--------------------------( 2.021) |
||||
|
|
3 |
||
a4 |
= |
394.57 |
= 1.971 |
|
12--------------------------( 2.021) |
||||
|
|
4 |
||
method 3: use data in table above to draw line in Frequency Distribution Analysis Sheet. Look for straightness of line, and slope.
3.Short answers
a)The histogram on the left indicates grouped data, the histogram on the right indicates ungrouped data.
b)Bimodal distributions indicate a mixture of two sample populations, as if a box of parts has been filled by two different machines.
c)Cp indicates process variance to tolerance only, while Cpk incorporates the shift of the process centre also.
d)DOE allows the most sensitive process parameters to be controlled first.
e)Double sampled plans are good when we have something like a good supplier, and destructive testing. Single sampled plans are better when quality must be very high.

page 48
f) Look at charts in book. sample = 188, 2 or less must fail for acceptance.
5.
N = 10000, n = 30, c = 2 |
|
|
|
|
|
||||
p0 |
|
100p0 |
|
sample size(n) |
|
np0 |
|
Probability of acceptance (Pa) |
|
|
|
|
|
||||||
|
|
|
|
|
|
|
|
|
|
.005 |
|
.5 |
|
30 |
|
.15 |
|
.999 |
|
.01 |
|
1 |
|
30 |
|
.3 |
|
.996 |
|
.02 |
|
2 |
|
30 |
|
.6 |
|
.977 |
|
.03 |
|
3 |
|
30 |
|
.9 |
|
.938 |
|
.04 |
|
4 |
|
30 |
|
1.2 |
|
.879 |
|
.05 |
|
5 |
|
30 |
|
1.5 |
|
.809 |
|
.06 |
|
6 |
|
30 |
|
1.8 |
|
.731 |
|
.07 |
|
7 |
|
30 |
|
2.1 |
|
.650 |
|
.08 |
|
8 |
|
30 |
|
2.4 |
|
.570 |
|
.09 |
|
9 |
|
30 |
|
2.7 |
|
.494 |
|
1.0 
0.5
.3 |
.6 |
.9 |
1.2 |
1.5 |
1.8 |
1.0 |
|
|
|
0.5 |
|
|
|
5 |
10 |
15 |
20 |
from table C for p0 = .02, therefore np0 = .02(30) = .6, α = 1-0.997=2.3%
6.

page 49
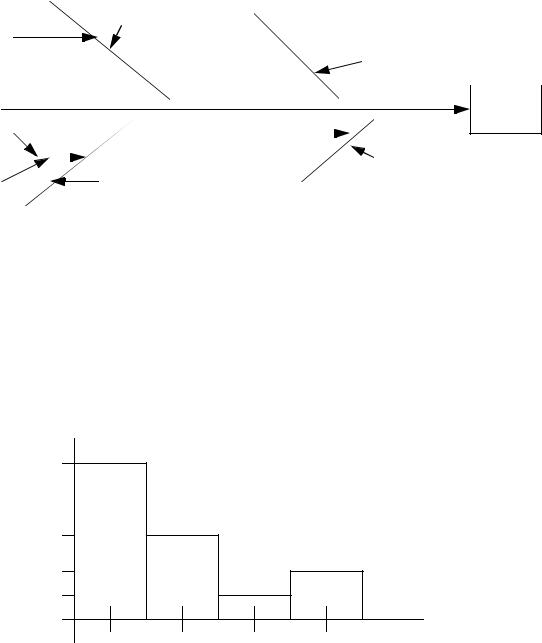
a)
paint
painter type 
age
experience
storage


 paint
paint 
 quality
roller |
humidity |
|
temp |
|
|
|
condition
type environment
brush
b)
Problem |
count |
|
|
Brush hairs |
IIIII II |
missed spots |
IIIII IIIII II |
color mismatch |
II |
other |
IIII |
c)
12
7
4
2
missed |
brush |
color |
other |
spot |
hairs |
mismatch |
|
7.Short answer questions
a)Ungrouped data is continuous, and can be grouped into “slots”
b)It is a value in a set of grouped data that reoccurs the most. It tends to indicate where a distribution is centred, or some unnatural patterns. e.g., 10 out of 30 students get a mark of 85% on the test, indicating copying.
