

Nafziger Economic Development (4th ed)
.pdf226Part Two. Poverty Alleviation and Income Distribution
off the farm, at a subsistence level. The major factors raising LDC agricultural labor productivity are (1) new biological-chemical-mechanical inputs in production,
(2)new technical and organizational knowledge from greater specialization, and
(3)expanded markets for agricultural output (Tomich, Kilby, and Johnston:1995) as transportation costs fall.
The Evolution of LDC Agriculture
The evolution of agricultural production commonly occurs in three stages: (1) peasant farming, where the major concern is survival; (2) mixed farming; and (3) commercial farming.3 If you have seen only the highly specialized, mechanized farms of the United States and Canada, it may be hard for you to visualize the subsistence agriculture that is the livelihood of most farmers in LDCs (and was for most farmers in North America in the late 18th and early 19th centuries). On the traditional peasant farm, output and consumption are almost identical, and the staple crop (usually wheat, barley, millet, sorghum, rice, or corn) is the chief source of food. Land and labor are the key production factors, and capital is small. Labor, except for multicropping irrigated agriculture, is underutilized except for peak seasons, such as planting and harvest. Cultivators – small owners, tenants, or sharecroppers – farm only as much land as their families can work without hired labor. And as indicated later when discussing land reform, the small family farm is frequently the most highly productive farm system.
For many this way of life is changing. An increasing number of peasants, pressured by a growing rural population per cultivated hectare, attracted by productivity gains from new capital and technology, and stirred by mass communications to higher consumer expectations, are producing crops for the market. Yet change does not take place so rapidly as the Western observer expects. Peasant resistance to change, which appears irrational to the Westerner, may in fact be prudent. The prime objective of the peasant is to maximize not income but his or her family’s chance of survival.
Attempts to improve the situation of subsistence farmers by an indiscriminate introduction of cash crops often result in a greater risk to the survival of the peasant’s family without any major increase in its average consumption. In parts of South Asia and Latin America, peasants who grow cash crops earn so little that at least three-quarters of their income is spent on food. In fact, commercial farming is often a more precarious operation than subsistence farming: prices fluctuate, necessary materials are scarce, and the weather remains unpredictable. Extension agents who introduce new varieties, cultivation, or management practices for trials on peasant farms should generally experiment with only a small part of a farmer’s land, so that the innovations are not unduly risky and so the farmer can compare the results with traditional practices (Singh 1990:109).
For many, mixed or semisubsistence farming rather than highly specialized commercial farming is the first step away from subsistence agriculture. Production
3 This discussion draws on Weitz (1971:6–28).
7. Rural Poverty and Agricultural Transformation |
227 |
branches off into other enterprises besides the staple crop, such as legumes, fruits, vegetables, and animal husbandry. This change begins with improved productivity through technological advances, capital formation, or using resources underemployed in subsistence farming, and it varies depending on the particular conditions of the farm. For example, if the staple crop is grown only part of the year, new crops may be introduced in the slack season to use idle land and family labor, or more crops may be grown as a result of mixed cropping, irrigation, or using new seed varieties. Reducing labor requirements in the peak seasons by introducing simple labor-saving techniques can lead to new enterprises, such as cattle or poultry farming. Improved seeds, fertilizer, and irrigation may yield more food and free some land for cash crops. Thus, the farmer will have a marketable surplus for cash income. By spreading the workload more evenly throughout the year, diversified farming uses more of the available labor. Mixed farming also can provide more security to the operator. If one crop is destroyed by pests, disease, or natural calamity or sells at a low price, others may do better.
The specialized farm, the most advanced agricultural phase in a market economy, usually emphasizes cultivating one crop. Such a farm is capital intensive, uses advanced technology, and takes advantage of economies of scale and expanding national and international markets. The farmer no longer grows crops for the family but for the market.
Concentrating on one major crop appears quite risky. It seems to return the farm to the unbalanced work schedule and dependence on a single crop of the subsistence phase. However, the specialized farm uses labor-saving devices that decrease the workload at peak periods, so that the slack season can be used for other activities, such as plowing, fertilizing, maintaining equipment, and catching up with the latest literature. Furthermore, insurance policies, pesticides, market research, and irrigation can overcome some of the risks of one-crop farming. Also the income from specialized farming is so much higher than from other forms of farm production that it outweighs occasional losses from bad weather or price fluctuations.
Even when agricultural output per person grows and creates agriculturally related jobs, the transition from peasant to specialized farmer usually increases the number of landless laborers. Indeed, the change of many farm cultivators to hired workers during growing commercialization may be partly responsible for the increased rural poverty noted in South and Southeast Asia in the 1960s and 1970s, and reduced nutrition for workers in newly established plantations in Sri Lanka and large farms in Zimbabwe. And often women lose with commercialization, even when they were important decision makers before the change (Binswanger and von Braun 1993:171– 180). Thomas P. Tomich, Peter Kilby, and Bruce F. Johnston (1995), however, argue that commercialization has only a small positive effect on calorie intake but does not worsen LDC household welfare.
By contrast, Yujiro Hayami (1998:304) thinks that “plantations have no significant advantage over peasants [for] crops for which centralized processing and marketing are not necessary.” Cocoa and coconuts are typical examples of a lack of large-scale economies. Peasants can grow and process these crops (“fermentation of cocoa and
228Part Two. Poverty Alleviation and Income Distribution
the drying and smoking of coconuts to make copra . . . ) in small lots with no large capital requirement beyond small indigenous tools and facilities.”
Multinational Corporations and Contract Farming
With globalization, the commercial process has been internationalized. Since the 1990s, multinational corporations (MNCs) have invested, developed products (in collaboration with local researchers), transferred technology, trained producers, introduced contract farming, and provided financial assistance for farmers and agrobusiness people in LDCs.
The basis for MNC domination in today’s global food economy started with market concentration in DCs. In the United States, four meat-packing firms control more than 80 percent of the beef supply. The wholesale and retail food distribution system in other OECD countries is also concentrated.
These large MNCs have expanded vertically by taking over the major operations along the food chain, fully integrating operations from the “farmgate to the dinner plate.” Additionally, these companies have expanded horizontally by extending their reach into foreign markets. The three most advanced global food chain clusters are Cargill/Monsanto, ConAgra, and Novartis/ADM, whose headquarters are in the United States. ConAgra, for example, the second largest flour miller in North America, ranks fourth in corn milling, third in cattle feeding, second in slaughtering, third in pork processing, fourth in broiler production, and second in food processing, produces its own livestock feed, distributes processed food through major brands, and (with a subsidiary) sells seeds and agrochemicals around the world. Other clusters in the United States and Western countries have similar connections to links in the food chain, including exports of grains and soybeans (FAO 2003: 274).
The international coffee market changed substantially from the 1970s to the 1990s. In 1998, Philip Morris, Nestle, Sara Lee, P&G, and Tchibo accounted for 69 percent of world market shares in coffee roasting and processing. During the 1990s, coffee market concentration (that is, oligopolist power) grew and product differentiation increased. From the 1980s to the 1990s, the value added of producers fell from 20 to 13 percent and that retained in consuming countries (much to the coffee roasting and processing oligopoly) increased from 55 to 78 percent (FAO 2003:277).
Contracts between MNCs (and large LDC firms, such as Hindustan Lever, a food processor in north India) and farmers are crucial to company success. The benefits include superior technology (sometimes with minimal risk to the farmer), access to credit, and increased productivity and farmer income. But local farmers face problems if the company is unwilling to share risks, even when partly responsible for losses. In Thailand, a company that contracted raising chickens charged a levy on farmers to offset the possibility of high bird mortality. Farmers resented this, as they believed that the poor quality of chicks the company supplied was a cause of the problem. Farmers risk debt from production problems, poor technical advice, changing market conditions, or the company’s failure to honor contracts (FAO 2003:278–279).
7. Rural Poverty and Agricultural Transformation |
229 |
||||||||
155 |
|
|
|
|
|
|
|
|
|
150 |
|
|
|
|
|||||
East & South East Asia |
|||||||||
145 |
|
|
|
|
|
|
|
|
|
140 |
|
|
|
|
|
|
|
|
|
135 |
|
|
Latin America |
||||||
130 |
|
|
|||||||
|
|
|
|
|
|
|
|
||
|
|
|
|
|
|
|
|||
125 |
|
|
|
|
|
DCs |
|
||
|
|
|
|
|
|
|
|
||
120 |
|
|
|
|
|
|
|
|
|
115 |
|
|
|
|
|
|
|
|
|
110 |
|
|
|
|
|
|
|
|
|
|
|
|
|
|
|
|
|
||
105 |
|
Middle East |
|||||||
South Asia |
|||||||||
100 |
|||||||||
|
|
|
|
|
|
|
|
||
95 |
|
|
|
|
|
|
|
|
|
90 |
|
|
|
|
|
|
|
|
|
85 |
|
|
|
|
|
|
|
|
|
|
|
Sub-Saharan Af |
rica |
||||||
|
|
|
|||||||
80 |
|
|
|
|
|
|
|
|
|
75
70
61 62 63 64 65 66 67 68 69 70 71 72 73 74 75 76 77 78 79 80 81 82 83 84 85 86 87 88 89 90 91 92 93 94 95 96 97 98
Year
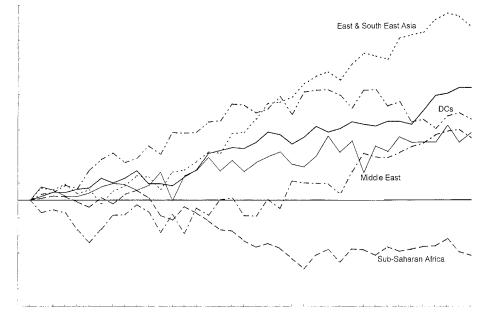
FIGURE 7-1. Growth in Food Production per Capita, 1960–98 (1961 = 100). Per capita food production grew by 22 percent in developed countries from 1962 to 1996, and by 14 percent in developing countries during the same period (22 percent in Latin America;
43 percent in East and Southeast Asia, excluding Japan and China; 20 percent in South Asia; 11 percent in the Middle East, and −12 percent in sub-Saharan Africa, the only world region where calorie intake, even if equally distributed, is below FAO’s minimal nutritional standards). Although the graph shows year-to-year fluctuations, the figure for per capita food output for a given year t is an average of the figures for year t − 2 through t + 2. Sources: U.S. Department of Agriculture 1960–2000; FAO Statistical Databases, 1990–1999.
Growth of Average Food Production in Sub-Saharan Africa, Other LDCs, and DCs
Both agricultural and food outputs per worker in LDCs are fractions of the same measures in DCs. How does the growth of food production per capita in LDCs compare to that in DCs? Figure 7-1 indicates that from 1963 to 1996, food output per person in developing countries grew at an annual rate of 0.5 percent (−0.4 percent in sub-Saharan Africa and 0.7 percent in the rest of the developing world) and in developed countries at a rate of 0.6 percent per year. (Of course, because the vagaries of weather make farm production volatile, alarmists can always distort figures to show reduction in per capita grain production by beginning with a bumper crop, as in 1970 to 1971 in India, and ending with a poor harvest, as in 1972 to 1973 or 1979 to 1980. To avoid distortions caused by weather fluctuations, I use a five-year moving average in which food output in the year 1989, for instance, is computed as an average of the outputs of 1987 through 1991.)
230Part Two. Poverty Alleviation and Income Distribution
FOOD DEFICITS AND INSECURITY IN SUB-SAHARAN AFRICA
Sub-Saharan Africa was the only LDC region where food output per capita fell from 1963 to 1996. Africa’s daily calorie consumption per capita, 1997–99, 2,195 (compared to 2,115 in the early 1960s and 2,197 in the mid-1970s), was roughly about the same as the requirement by the Food and Agriculture Organization (FAO). Somalia, Burundi, Congo DR, Ethiopia, Eritrea (all less than 1,800 daily calories), Angola, Mozambique, Tanzania, Kenya, Zambia, Central Africa Republic, Madagascar (all less than 2,000 daily calories), 11 other African countries, 7 Asian countries, and Haiti had less than 2,200 daily calorie consumption per capita in 1997–99. Most of these countries plus virtually all of South Asia, a scattering of Latin American countries, and two central Asia countries from the former Soviet Union had at least 19 percent of the population undernourished in 1998–2000; 914 million people, 14 percent of the world’s population, was undernourished in 2003. In the sub-Sahara, only a few southern and western African countries (South Africa, Botswana, Gabon, the Gambia, Ghana, Nigeria, Cameroon, Coteˆ d’Ivoire, Togo, Benin, Mauritania, and Mali) and Mauritius, an island east of Madagascar, had an average daily consumption that exceeded the minimum required. Calorie consumption in all other LDC regions exceeded FAO requirements (Economic Commission for Africa 1983:9; U.N. Development Program 1994:118–120, 132–133, 207–208; FAO 2003:29–32; U.N. Development Program 2003:198–201).
The International Fund for Agricultural Development has developed the food security index (FSI), which combines food production and consumption variables to measure national, composite food security. The FSI “combines measures of calorie availability (in relation to requirement), the growth of per capita daily energy supply, food production, food staples self-sufficiency, and variability of food production and consumption.” Countries that have high food production potential or import capacity and that experience a low variability of production and consumption would have a high value of FSI (Jazairy, Alamgir, and Panuccio 1992:27, 398–399, 464–465).
Africa’s FSI is low (and falling since the 1960s) not only because of large food deficits but also because of domestic output and foreign-exchange reserve fluctuations, as well as foreign food-aid reductions. Cereal consumption per capita has had a high coefficient of variation since 1965. In 1989, Economic Commission for Africa Executive Secretary Adebayo Adedeji (1989:2) spoke of “the humiliation it has brought to Africa in having to go round with the begging bowl for food aid.” Relief agencies indicate millions of deaths from severe malnutrition in the 1990s in African countries where food trade was disrupted by domestic political conflict. In addition, the tens of millions of refugees annually fleeing civil wars, natural disasters, and political repression, such as in Sudan, Rwanda, Burundi, Angola, Liberia, Sierra Leone, Somalia, Mozambique, South Africa, Ethiopia, and Eritrea added to Africa’s food shortages (Vayrynen¨ 2000a:43–89).
Illustrative of the enormity of the sub-Sahara’s difference from other LDCs is that while the sub-Sahara and India both produced 50 million tons of foodgrains in 1960, in 1988 India produced 150 million tons (after the Green Revolution and other farm technological improvements) and sub-Saharan Africa (with faster population growth)
7. Rural Poverty and Agricultural Transformation |
231 |
was still stuck at little more than 50 million tons. India’s yield per hectare increased by 2.4 percent yearly, whereas the Sub-Sahara’s grew at a negligible annual rate of 0.1 percent. Thus, the sub-Sahara, which was on parity with India in 1960, produced only about one-third of Indian output in 1988 (Singer 1990:178–81) and about threeeighths in 2002 (FAO 2003). According to Table 7-1, the average North American agricultural worker, each of whom has far more land, capital, and technology, produces 75 times as much farm output as the average African.
“Why is only Africa hungry?” the Kansas City Star asks (2003:A20). Nic Maunder, specialist on Ethiopia and the Horn of Africa at the Famine Early Warning Center in Nairobi, Kenya, contends that people “overestimate the importance of climatic factors as causes of food insecurity.” For him, war, bad governance, corruption and mismanagement, poor roads (hungry people live 160 kilometers or 100 miles from well-fed towns), and other infrastructure are important, “but the biggest factor is poverty.” According to Maunder: “Food security is not merely about the food supply, but an individual’s ability to buy it. Famines almost never occur in cities or large towns, where incomes don’t depend on agriculture.” Ethiopia has consistent bumper crops in the west “while crop failures in the east bring food shortages every four to five years that usually leave 5 million to 10 million people hungry.” People in the east, continually on the edge of destitution, cannot afford to buy food from the other side of the country. “Ethiopia, like most African countries, has a poor road system, [meaning] that it is sometimes cheaper to ship food from the United States than to truck it across the country” (Kansas City Star 2003:A20). Thus famines can occur in countries that have plenty of food but where people lack access because of poverty or distance to food-surplus areas (see Chapter 8).
POOR AGRICULTURAL POLICIES AND INSTITUTIONAL FAILURES
IN SUB-SAHARAN AFRICA
Africa’s deteriorating food position began before the droughts in the Sahel, Sudan, and Ethiopia during the last decades of the 20th century. Although the roots of Africa’s food crisis can be traced back to precolonialism and colonialism, the crisis has continued after colonialism with African governments’ neglect of agriculture. Hans Binswanger and Robert Townsend (2000:1076) attribute the crisis to centuries of poor policies and institutional failures. This began with the precolonial period, viz., 1650 to 1850, when the slave trade was extremely destructive to political and economic life, especially capital accumulation. Colonial policy contributed further to today’s agricultural underdevelopment. (1) Africans were systematically excluded from participating in colonial development schemes and producing export crops and improved cattle. British agricultural policy in Eastern Africa benefited European settlers and ignored and discriminated against African farmers; in Kenya, this meant prohibiting Africans from growing coffee until 1933. (2) Colonial governments compelled farmers to grow selected crops and work to maintain roads.
(3) Colonialism often changed traditional land tenure systems from communal or clan to individual control. This created greater inequalities from new classes of affluent farmers and ranchers, and less secure tenants, sharecroppers, and landless workers.
232Part Two. Poverty Alleviation and Income Distribution
(4)Colonialists failed to train African agricultural scientists and managers.
(5)Research and development concentrated on export crops, plantations, and land settlement schemes, neglecting food production and small farmers and herders.
(6)Europeans reaped most of the gains from colonial land grants and export surpluses from agriculture (Eicher and Baker 1982:20–23; Ghai and Radwan 1983:16–21).
Chapter 4 mentioned the numerous predatory postcolonial rulers in Africa ruling through coercion, material inducement, and personality politics, degrading the economy and bureaucracy. Many postcolonial governments, although lacking a capable civil service, established high tariffs, heavy taxation, overregulation (with rules and policies unpredictable), exchange rates biased against farm exports, high interest rates, and highly centralized fiscal and institutional systems for agricultural development, inhibiting local initiative. State control of commodity marketing boards inhibited processing and exports, as input delivery and crop payments by the boards were unreliable.
In addition, Africa was plagued by poor resource endowment and land quality, low density, increasing transport and transactions costs (especially with landlockedness), little specialization, few economies of scale, a lack of competitive markets, the absence of credit markets, a short growing season for rainfed farming, the high risk of drought, and endemic livestock and human diseases (malaria, tuberculosis, and, more recently, the AIDS epidemic). Population losses in the farm labor force have reduced hectares cultivated and crop yields, and shifted cultivation from cash to subsistence crops. AIDS reduces farm workers in the peak earning years, undermines incentives and savings, and leads to the sale of assets under distress (Binswanger and Townsend 2000:1076–1084; Lampley, Wigley, Carr, and Collymore 2002:20). Moreover, as indicated later in this chapter, the contemporary neglect of Africa’s agriculture results partly from the political advantage to state leaders to intervene in the market to improve prices and incomes of urban classes relative to farmers.
These barriers and institutional factors prevented Africa, unlike Asia, from enjoying a Green Revolution, which requires a well-developed infrastructure and good governance (see Chapter 8). We can hope that recent agricultural structural reforms, policy and institutional reform, and macroeconomic stabilization have increased Africa’s flexibility and competitiveness.
Food in India and China
During the Chinese Cultural Revolution from 1966 to 1976, some Western economists accepted the official claim that the country had no malnutrition. The French economist Al Imfeld (1976:157) maintained that “in contrast to India, China has eliminated hunger.” The best evidence indicates that food production per capita in China fell more than 12 percent between the 1930s and the late 1970s. Although growth in food production per capita of the world’s most populated country, China, from 1952 to 1984, was slightly faster than that of the second most populated country, neighboring India, breaking down the analysis into the pre-1977 to 1979 period, when China had primarily cooperative and collective farming, and the period after
7. Rural Poverty and Agricultural Transformation |
233 |
the 1979 agricultural reforms, is more revealing. India’s annual growth in food output per person, from 1954 to 1977, was 0.4 percent compared to China’s 0.3 percent (Nafziger 1985:366–392; Brown 1995:29; Nafziger 1997:183; U.S. Department of Agriculture 1986; U.S. Department of Agriculture 1999). (The five-year moving average avoids much influence from the abnormal growth just following China’s post-1949 war rehabilitation and India’s recovery from disruption caused by the 1947 Indian–Pakistani partition or following China’s reforms and India’s post-1978 liberalization.)
Yet, because China’s foodgrain output per person in the early 1950s was roughly 25–30 percent higher than India’s, China’s average level of food output per person remained higher than India’s through the 1980s. Furthermore, because income inequalities were less in China than India, the percentage of the population that was malnourished was lower than in India. Nevertheless, China’s Communist Party Central Committee admitted that in 1977, about 100 million people, or more than one-tenth of China’s population, did not have enough to eat (Perkins 1969; Howe 1978:xxiii, 180–184; Eberstadt 1979:33–46; Barnett 1981:305), thus contradicting Imfeld’s contention.
The Stanford economist John G. Gurley (1976:134) argues that “the Chinese have what is in effect an insurance policy against pestilence, famine, and other disasters.” But although China normally has had a lower malnutrition rate and distributes food more equally than does India, China has been more subject to famine than is India.
Amartya K. Sen emphasizes that having enough to eat does not depend on merely egalitarian income distribution or low poverty rates but on society’s system of entitlement. Entitlement refers to the set of alternative commodity bundles that a person can command in a society using the totality of rights and opportunities that he or she possesses. An entitlement helps people acquire capabilities (like being well nourished). In a market economy, the entitlement limit is based on ownership of factors of production and exchange possibilities (through trade or a shift in production possibilities). For most people, entitlement depends on the ability to find a job, the wage rate, and the prices of commodities bought. In a welfare or socialist economy, entitlement also depends on what families can obtain from the state through the established system of command. A hungry, destitute person will be entitled to something to eat, not by society’s low Gini concentration and a high food output per capita, but by a relief system offering free food. Thus, in 1974, thousands of people died in Bangladesh despite its low inequality, because floods reduced rural employment along with output, and inflation cut rural laborers’ purchasing power.
Sen argues that food is “purchased” with political pressure as well as income. Accordingly, one-third of the Indian population goes to bed hungry every night and leads a life ravaged by regular deprivation. India’s social system takes nonacute endemic hunger in stride; there are neither headlines nor riots. But although India’s politicians do not provide entitlements for chronic or endemic malnutrition, they do so for potential severe famine through food imports, redistribution, and relief. In Maoist China, the situation was almost the opposite. Its political commitment ensured lower regular malnutrition through more equal access to means of

234 Part Two. Poverty Alleviation and Income Distribution
160 |
|
|
|
|
|
||
140 |
China |
|
|
|
|||
120 |
|
|
|
100 |
|
|
|
|
India |
||
80 |
|
|
|
60
40
20
0
1961 1963 1965 1967 1969 1971 1973 1975 1977 1979 1981 1983 1985 1987 1989 1991 1993 1995 1997
Year
FIGURE 7-2. Growth in Food Production per Capita, China and India, 1961–1998 (1981–1991 = 100). Source: FAO Statistical Databases.
livelihood and state-provided entitlement to basic needs of food, clothing, and shelter. In a normal year, China’s poor were much better fed than India’s. Yet, if there were a political and economic crisis that confused the regime so that it pursued disastrous policies with confident dogmatism, then it could not be forced to change its policies by crusading newspapers or effective political opposition pressure, as in India.4
Famines result from a failure of the entitlement system. Sen, using Beijing University figures, calculates an extra mortality of 14–16 million people from famine in China from 1959 to 1961 (see Figure 7-2), greater in absolute or relative terms than the three million extra mortality in India’s largest 20th-century famine, the Great Bengal Famine of 1943. So although China was more successful than India before 1977 to 1979 in eliminating regular malnutrition, China has had more famines than India (Sen 1983a:757–60; Sen 1983b). (For further discussion of Sen’s entitlement theory of famine, see Bowbrick 1986:105–124; Sen 1986:125–132; Bowbrick 1987:5–9; Sen 1987:10–14; Devereux 1988:270–282; Kula 1988:112–116.)
China’s per-capita food production dropped sharply during the 1959 to 1961 famine (1960’s figure was 25 percent below 1952’s), resulting in widespread malnutrition. The cause of this decline was not only bad weather, floods, and drought but also poor quality work during the emphasis on collective labor-intensive projects during the Great Leap Forward (GLF) from 1958 to 1960. Reservoir construction work destroyed soil, rivers, and existing irrigation systems. Reservoir and water conservation work raised underground water levels, led to alkalized, salinized, and water-logged soil, halted stream and river flows, left irrigation channels unfinished,
4Sen (1999:16) notes a relationship between authoritarianism and famine, as suggested by the leading famine countries being North Korea, Sudan, and Ethiopia.
7. Rural Poverty and Agricultural Transformation |
235 |
and failed to provide for drainage. Moreover, GLF water projects removed land from cultivation. Furthermore, Chinese authorities discriminated against rural populations in grain procurement. Yet the GLF political pressure for agricultural success made local officials unwilling to report food shortages (Kung and Lin 2003:51–74; Prybyla 1970:264–269; Barnett 1981:271, 302; Lardy 1983:152–153; World Bank 1986:104–106).
In reforms beginning in 1979, China decontrolled farm prices for farm commodities, encouraged direct sale by peasants to the market, and instituted a household responsibility system, which allowed farmers more freedom to choose both farm and nonfarm activities. From 1977 to 1984, even India’s 3.0-percent annual growth in food output per capita under a modest post-1978 liberalization was outstripped by China’s 4.6-percent growth, which was not so rapid as gains in oilseed, livestock, and cotton output. Indeed, China reversed its pre-1979 dependence on imported grains, exporting corn, other coarse grains, and soybeans. These remarkable gains were achieved with few increased farm inputs (see Chapter 19). Even after 1984, longerterm leasing contracts, subleasing of land by peasants, free-market pricing for most farm products, and greater nonfarm options for the rural population was accompanied by rapid although decelerated growth in foodgrain output per person:3.2 percent yearly, 1984–1998, for China, compared to 1.2 percent per year in India (see Figure 7-2). China’s price decontrol of food inputs and outputs, although only partial, reinforces the World Bank’s emphasis in the Berg report (discussed later in this chapter) of “getting prices right.”
LDC Food Deficits
The LDC foodgrain (cereals) deficit, 9.3 percent in 1997, is expected to be 12.1 percent of food consumption in LDCs by 2020 (Table 7-2). Through trade, the United States and the (pre-2004) European Union 15, together with Canada, Australia, and New Zealand (in “Other” in Table 7-2), provide the lion’s share of the surpluses for the developing world. All LDC regions show large and increasing deficits, except for Latin America, which is expected to come close to a balance between consumption and production by 2020. The two largest deficits as a proportion of consumption are West Asia/North Africa (the Middle East) and sub-Saharan Africa. The major developing countries with food deficits are discussed in Chapter 8, which examines the population-food balance in more detail. Food importers, such as Britain, Germany, and Japan, generate enough industrial surplus to maintain a high level of nutrition.
An American Association for the Advancement of Science symposium argues that annual food production is enough to feed everyone on earth adequately if distribution were more equal. However, although intra-regional distribution would be adequate for Asia and Latin America, sub-Saharan Africa’s caloric intake, if equally distributed, would not exceed minimal nutritional standards (FAO 2003:29–32). Chapter 8’s discussion of the food-population balance and the previous section on Sino-Indian comparisons suggest that local food shortages are due not so much to inadequate world production as to deficiencies in food distribution. Although worldwide food output per capita should grow in the first two decades of the 21st century, inequality