

Mankiw Principles of Microeconomics (4th ed)
.pdf380 Monopolistic Competition
390 |
PART FIVE FIRM BEHAVIOR AND THE ORGANIZATION OF INDUSTRY |
|
|
|
|
IN THE NEWS
TV Networks as
Brand Names
BRAND NAMES CONVEY INFORMATION TO
consumers about the goods that firms are offering. Establishing a brand name—and ensuring that it conveys the right information—is an important strategy for many businesses, including TV networks.
A T V S e a s o n W h e n
I m a g e I s E v e r y t h i n g
BY STUART ELLIOTT
A marketing blitz to promote fall television programming, estimated at a record $400 million to $500 million, has been inundating America with a barrage of branding.
Branding is a shorthand term along Madison Avenue for attempts to create or burnish an identity or image, just as Coca-Cola seeks to distinguish itself from Pepsi-Cola. For the 1996–97 prime-time broadcast television season,
which officially began this week, viewers have been swamped by the torrent of teasing practically since the 1995–96 season ended in May.
At the center of those efforts is the most ambitious push ever by the broadcast networks to brand themselves and many of the blocks of programming they offer—a marked departure from the past, when they would promote only specific shows.
“The perception was that people watched shows, not networks,” said Bob Bibb, who with Lewis Goldstein jointly heads marketing for WB, a fledgling network owned by Time Warner, Inc., and based in Burbank, California.
“But that was when there were only three networks, three choices,” Mr. Bibb added, “and it was easy to find the shows you liked.”
WB has been presenting a sassy singing cartoon character named Michigan J. Frog as its “spokesphibian,” personifying the entire lineup of the “Dubba-dubba-WB”—as he insists upon calling the network.
“It’s not a frog, it’s an attitude,” Mr. Bibb said, “a consistency from show to show.”
In television, an intrinsic part of branding is selecting shows that seem related and might appeal to a certain audience segment. It means “developing
AN ATTITUDE, NOT JUST A FROG
an overall packaging of the network to build a relationship with viewers, so they will come to expect certain things from us,” said Alan Cohen, executive vice president for the ABC-TV unit of the Walt Disney Company in New York.
That, he said, means defining the network so that “when you’re watching ABC, you’ll know you’re watching ABC”—and to accomplish it in a way that appeals to the primary ABC audience of youngish urbanites and families with children.
SOURCE: The New York Times, September 20, 1996, p. D1.
physically possible, it is obligatory that the firm identify itself on the good or packaging with a “production mark.”
Goldman quotes the analysis of a Soviet marketing expert:
This [trademark] makes it easy to establish the actual producer of the product in case it is necessary to call him to account for the poor quality of his goods. For this reason, it is one of the most effective weapons in the battle for the quality of products. . . . The trademark makes it possible for the consumer to select the good which he likes. . . . This forces other firms to undertake measures to improve the quality of their own product in harmony with the demands of the consumer.
TLFeBOOK

Monopolistic Competition |
381 |
CHAPTER 17 MONOPOLISTIC COMPETITION |
391 |
Goldman notes that “these arguments are clear enough and sound as if they might have been written by a bourgeois apologist.”
QUICK QUIZ: How might advertising make markets less competitive? How might it make markets more competitive? Give the arguments for and against brand names.
CONCLUSION
Monopolistic competition is true to its name: It is a hybrid of monopoly and competition. Like a monopoly, each monopolistic competitor faces a downwardsloping demand curve and, as a result, charges a price above marginal cost. As in a competitive market, however, there are many firms, and entry and exit drive the profit of each monopolistic competitor toward zero. Because monopolistically competitive firms produce differentiated products, each firm advertises in order to attract customers to its own brand. To some extent, advertising manipulates consumers’ tastes, promotes irrational brand loyalty, and impedes competition. To a larger extent, advertising provides information, establishes brand names of reliable quality, and fosters competition.
The theory of monopolistic competition seems to describe many markets in the economy. It is somewhat disappointing, therefore, that the theory does not yield simple and compelling advice for public policy. From the standpoint of the economic theorist, the allocation of resources in monopolistically competitive markets is not perfect. Yet, from the standpoint of a practical policymaker, there may be little that can be done to improve it.
Summar y
A monopolistically competitive market is characterized by three attributes: many firms, differentiated products, and free entry.
The equilibrium in a monopolistically competitive market differs from that in a perfectly competitive market in two related ways. First, each firm has excess capacity. That is, it operates on the downward-sloping portion of the average-total-cost curve. Second, each firm charges a price above marginal cost.
Monopolistic competition does not have all the desirable properties of perfect competition. There is the standard deadweight loss of monopoly caused by the
markup of price over marginal cost. In addition, the number of firms (and thus the variety of products) can be too large or too small. In practice, the ability of policymakers to correct these inefficiencies is limited.
The product differentiation inherent in monopolistic competition leads to the use of advertising and brand names. Critics of advertising and brand names argue that firms use them to take advantage of consumer irrationality and to reduce competition. Defenders of advertising and brand names argue that firms use them to inform consumers and to compete more vigorously on price and product quality.
Key Concepts
monopolistic competition, p. 378
TLFeBOOK

382 Monopolistic Competition
392 |
PART FIVE FIRM BEHAVIOR AND THE ORGANIZATION OF INDUSTRY |
Questions for Review
1.Describe the three attributes of monopolistic competition. How is monopolistic competition like monopoly? How is it like perfect competition?
2.Draw a diagram depicting a firm in a monopolistically competitive market that is making profits. Now show what happens to this firm as new firms enter the industry.
3.Draw a diagram of the long-run equilibrium in a monopolistically competitive market. How is price related to average total cost? How is price related to marginal cost?
4.Does a monopolistic competitor produce too much or too little output compared to the most efficient level? What practical considerations make it difficult for policymakers to solve this problem?
5.How might advertising reduce economic well-being? How might advertising increase economic well-being?
6.How might advertising with no apparent informational content in fact convey information to consumers?
7.Explain two benefits that might arise from the existence of brand names.
Problems and Applications
1.Classify the following markets as perfectly competitive, monopolistic, or monopolistically competitive, and explain your answers.
a.wooden #2 pencils
b.bottled water
c.copper
d.local telephone service
e.peanut butter
f.lipstick
2.What feature of the product being sold distinguishes a monopolistically competitive firm from a monopolistic firm?
3.The chapter states that monopolistically competitive firms could increase the quantity they produce and lower the average total cost of production. Why don’t they do so?
4.Sparkle is one firm of many in the market for toothpaste, which is in long-run equilibrium.
a.Draw a diagram showing Sparkle’s demand curve, marginal-revenue curve, average-total-cost curve, and marginal-cost curve. Label Sparkle’s profitmaximizing output and price.
b.What is Sparkle’s profit? Explain.
c.On your diagram, show the consumer surplus derived from the purchase of Sparkle toothpaste. Also show the deadweight loss relative to the efficient level of output.
d.If the government forced Sparkle to produce the efficient level of output, what would happen to the firm? What would happen to Sparkle’s customers?
5.Do monopolistically competitive markets typically have the optimal number of products? Explain.
6.Complete the table below by filling in YES, NO, or MAYBE for each type of market structure.
|
PERFECT |
MONOPOLISTIC |
|
DO FIRMS: |
COMPETITION |
COMPETITION |
MONOPOLY |
Make differentiated products?
Have excess capacity?
Advertise?
Pick Q so that MR MC?
Pick Q so that P MC?
Earn economic profits in long-run equilibrium?
Face a downward-sloping demand curve?
Have MR less than price?
Face the entry of other firms?
Exit in the long run if profits are less than zero?
TLFeBOOK
7.The chapter says that monopolistically competitive firms may send Christmas cards to their customers. What do they accomplish by this? Explain in words and with a diagram.
8.If you were thinking of entering the ice-cream business, would you try to make ice cream that is just like one of the existing brands? Explain your decision using the ideas of this chapter.
9.Describe three commercials that you have seen on TV. In what ways, if any, were each of these commercials socially useful? In what ways were they socially wasteful? Did the commercials affect the likelihood of your buying the product, and why?
10.For each of the following pairs of firms, explain which firm would be more likely to engage in advertising.
a.a family-owned farm or a family-owned restaurant
b.a manufacturer of forklifts or a manufacturer of cars
c.a company that invented a very reliable watch or a company that invented a less reliable watch that costs the same amount to make
Monopolistic Competition |
383 |
CHAPTER 17 MONOPOLISTIC COMPETITION |
393 |
11.Twenty years ago the market for chicken was perfectly competitive. Then Frank Perdue began marketing chicken under his name.
a.How do you suppose Perdue created a brand name for chicken? What did he gain from doing so?
b.What did society gain from having brand-name chicken? What did society lose?
12.The makers of Tylenol pain reliever do a lot of advertising and have very loyal customers. In contrast, the makers of generic acetaminophen do no advertising, and their customers shop only for the lowest price. Assume that the marginal costs of Tylenol and generic acetaminophen are the same and constant.
a.Draw a diagram showing Tylenol’s demand, marginal-revenue, and marginal-cost curves. Label Tylenol’s price and markup over marginal cost.
b.Repeat part (a) for a producer of generic acetaminophen. How do the diagrams differ? Which company has the bigger markup? Explain.
c.Which company has the bigger incentive for careful quality control? Why?
TLFeBOOK
TLFeBOOK
18
T H E M A R K E T S F O R T H E
F A C T O R S O F P R O D U C T I O N
When you finish school, your income will be determined largely by what kind of job you take. If you become a computer programmer, you will earn more than if you become a gas station attendant. This fact is not surprising, but it is not obvious why it is true. No law requires that computer programmers be paid more than gas station attendants. No ethical principle says that programmers are more deserving. What then determines which job will pay you the higher wage?
Your income, of course, is a small piece of a larger economic picture. In 1999 the total income of all U.S. residents was about $8 trillion. People earned this income in various ways. Workers earned about three-fourths of it in the form of wages and fringe benefits. The rest went to landowners and to the owners of capi- tal—the economy’s stock of equipment and structures—in the form of rent, profit, and interest. What determines how much goes to workers? To landowners? To the owners of capital? Why do some workers earn higher wages than others, some
397
IN THIS CHAPTER YOU WILL . . .
Analyze the labor demand of competitive, pr ofit - maximizing fir ms
Consider the household decisions that lie behind labor supply
Learn why equilibrium wages equal the value of the mar ginal
pr oduct of labor
Consider how the other factors of pr oduction — land and capital — ar e compensated
Examine how a change in the supply of one factor alters the earnings of all the factors
385
TLFeBOOK

386 |
The Markets for the Factors of Production |
|
398 |
PART SIX THE ECONOMICS OF LABOR MARKETS |
|
|
|
landowners higher rental income than others, and some capital owners greater |
|
|
profit than others? Why, in particular, do computer programmers earn more than |
|
|
gas station attendants? |
|
|
The answers to these questions, like most in economics, hinge on supply and |
|
|
demand. The supply and demand for labor, land, and capital determine the prices |
|
|
paid to workers, landowners, and capital owners. To understand why some peo- |
|
|
ple have higher incomes than others, therefore, we need to look more deeply at |
|
|
the markets for the services they provide. That is our job in this and the next two |
|
|
chapters. |
|
|
This chapter provides the basic theory for the analysis of factor markets. As |
factors of production |
you may recall from Chapter 2, the factors of production are the inputs used to |
|
the inputs used to produce goods and produce goods and services. Labor, land, and capital are the three most important
services |
factors of production. When a computer firm produces a new software program, it |
|
uses programmers’ time (labor), the physical space on which its offices sit (land), |
|
and an office building and computer equipment (capital). Similarly, when a gas |
|
station sells gas, it uses attendants’ time (labor), the physical space (land), and the |
|
gas tanks and pumps (capital). |
|
Although in many ways factor markets resemble the goods markets we have |
|
analyzed in previous chapters, they are different in one important way: The de- |
|
mand for a factor of production is a derived demand. That is, a firm’s demand for a |
|
factor of production is derived from its decision to supply a good in another mar- |
|
ket. The demand for computer programmers is inextricably tied to the supply of |
|
computer software, and the demand for gas station attendants is inextricably tied |
|
to the supply of gasoline. |
|
In this chapter we analyze factor demand by considering how a competitive, |
|
profit-maximizing firm decides how much of any factor to buy. We begin our |
|
analysis by examining the demand for labor. Labor is the most important factor of |
|
production, for workers receive most of the total income earned in the U.S. econ- |
|
omy. Later in the chapter, we see that the lessons we learn about the labor market |
|
apply directly to the markets for the other factors of production. |
|
The basic theory of factor markets developed in this chapter takes a large step |
|
toward explaining how the income of the U.S. economy is distributed among |
|
workers, landowners, and owners of capital. Chapter 19 will build on this analysis |
|
to examine in more detail why some workers earn more than others. Chapter 20 |
|
will examine how much inequality results from this process and then consider |
|
what role the government should and does play in altering the distribution of |
|
income. |
THE DEMAND FOR LABOR
Labor markets, like other markets in the economy, are governed by the forces of supply and demand. This is illustrated in Figure 18-1. In panel (a) the supply and demand for apples determine the price of apples. In panel (b) the supply and demand for apple pickers determine the price, or wage, of apple pickers.
As we have already noted, labor markets are different from most other markets because labor demand is a derived demand. Most labor services, rather than
TLFeBOOK

|
The Markets for the Factors of Production |
387 |
CHAPTER 18 |
THE MARKETS FOR THE FACTORS OF PRODUCTION |
399 |
(a) The Market for Apples |
(b) The Market for Apple Pickers |
|
Price of |
|
|
Apples |
|
|
|
|
Supply |
P |
|
|
|
|
Demand |
|
|
|
0 |
Q |
Quantity of |
|
|
Apples |
Wage of |
|
|
Apple |
|
|
Pickers |
|
Supply |
|
|
|
W |
|
|
|
|
Demand |
0 |
L |
Quantity of |
|
|
Apple Pickers |
THE VERSATILITY OF SUPPLY AND DEMAND. The basic tools of supply and demand |
Figure 18-1 |
||
apply to goods and to labor services. Panel (a) shows how the supply and demand |
|||
|
|||
for apples determine the price of apples. Panel (b) shows how the supply and demand for |
|
||
apple pickers determine the wage of apple pickers. |
|
||
|
|
|
|
being final goods ready to be enjoyed by consumers, are inputs into the production of other goods. To understand labor demand, we need to focus on the firms that hire the labor and use it to produce goods for sale. By examining the link between the production of goods and the demand for labor, we gain insight into the determination of equilibrium wages.
THE COMPETITIVE PROFIT-MAXIMIZING FIRM
Let’s look at how a typical firm, such as an apple producer, decides the quantity of labor to demand. The firm owns an apple orchard and each week must decide how many apple pickers to hire to harvest its crop. After the firm makes its hiring decision, the workers pick as many apples as they can. The firm then sells the apples, pays the workers, and keeps what is left as profit.
We make two assumptions about our firm. First, we assume that our firm is competitive both in the market for apples (where the firm is a seller) and in the market for apple pickers (where the firm is a buyer). Recall from Chapter 14 that a competitive firm is a price taker. Because there are many other firms selling apples and hiring apple pickers, a single firm has little influence over the price it gets for apples or the wage it pays apple pickers. The firm takes the price and the wage as given by market conditions. It only has to decide how many workers to hire and how many apples to sell.
Second, we assume that the firm is profit-maximizing. Thus, the firm does not directly care about the number of workers it has or the number of apples it produces. It cares only about profit, which equals the total revenue from the sale of
TLFeBOOK
388 The Markets for the Factors of Production
400 |
PART SIX THE ECONOMICS OF LABOR MARKETS |
|
|
|
|
|
|
VALUE OF THE |
|
|
|
|
|
|
|
|
|
|
MARGINAL PRODUCT |
MARGINAL PRODUCT |
|
MARGINAL |
|||
|
|
LABOR |
OUTPUT |
OF LABOR |
OF LABOR |
WAGE |
PROFIT |
||||
|
|
L |
|
Q |
MPL ∆Q/∆L |
|
|
∆PROFIT |
|||
|
|
(NUMBER OF WORKERS) (BUSHELS PER WEEK) |
(BUSHELS PER WEEK) |
VMPL P MPL |
W |
VMPL W |
|||||
0 |
0 |
100 |
$1,000 |
$500 |
$500 |
|
|
||||
1 |
100 |
|
|
||||||||
80 |
800 |
500 |
300 |
|
|
||||||
2 |
180 |
|
|
||||||||
60 |
600 |
500 |
100 |
|
|
||||||
3 |
240 |
|
|
||||||||
40 |
400 |
500 |
100 |
||||||||
4 |
280 |
||||||||||
20 |
200 |
500 |
300 |
||||||||
5 |
300 |
||||||||||
|
|
|
|
|
|
||||||
|
|
|
|
|
|
|
|
||||
|
|
|
|
HOW THE COMPETITIVE FIRM DECIDES HOW MUCH LABOR TO HIRE |
|
|
|
||||
|
|
Table 18-1 |
|
|
|
||||||
|
|
|
|
|
|
|
|
|
|
||
|
|
|
|
apples minus the total cost of producing them. The firm’s supply of apples and its |
|||||||
|
|
|
|
||||||||
|
|
|
|
demand for workers are derived from its primary goal of maximizing profit. |
|||||||
|
|
|
|
THE PRODUCTION FUNCTION AND THE |
|
|
|
|
|||
|
|
|
|
MARGINAL PRODUCT OF LABOR |
|
|
|
|
|||
|
|
|
|
To make its hiring decision, the firm must consider how the size of its workforce |
|||||||
|
|
|
|
affects the amount of output produced. In other words, it must consider how the |
|||||||
|
|
|
|
number of apple pickers affects the quantity of apples it can harvest and sell. Ta- |
|||||||
|
|
|
|
ble 18-1 gives a numerical example. In the first column is the number of workers. |
|||||||
|
|
|
|
In the second column is the quantity of apples the workers harvest each week. |
|||||||
|
|
|
|
These two columns of numbers describe the firm’s ability to produce. As we |
|||||||
|
production function |
|
noted in Chapter 13, economists use the term production function to describe the |
||||||||
|
the relationship between the quantity |
|
relationship between the quantity of the inputs used in production and the quan- |
||||||||
|
of inputs used to make a good and |
|
tity of output from production. Here the “input” is the apple pickers and the “out- |
||||||||
|
the quantity of output of that good |
|
put” is the apples. The other inputs—the trees themselves, the land, the firm’s |
||||||||
|
|
|
|
trucks and tractors, and so on—are held fixed for now. This firm’s production |
|||||||
|
|
|
|
function shows that if the firm hires 1 worker, that worker will pick 100 bushels |
|||||||
|
|
|
|
of apples per week. If the firm hires 2 workers, the two workers together will pick |
|||||||
|
|
|
|
180 bushels per week, and so on. |
|
|
|
|
|
||
|
|
|
|
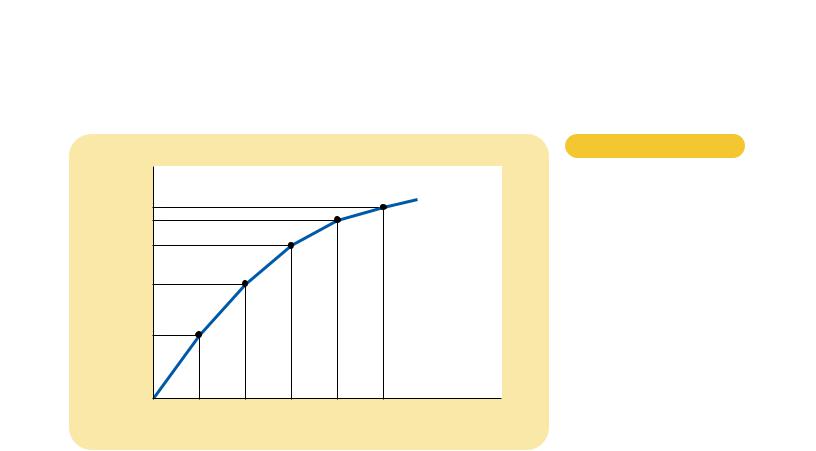
Figure 18-2 graphs the data on labor and output presented in Table 18-1. The |
|||||||
|
|
|
|
number of workers is on the horizontal axis, and the amount of output is on the |
|||||||
|
|
|
|
vertical axis. This figure illustrates the production function. |
|
|
|
||||
|
|
|
|
One of the Ten Principles of Economics introduced in Chapter 1 is that rational |
|||||||
|
|
|
|
people think at the margin. This idea is the key to understanding how firms decide |
|||||||
|
|
|
|
what quantity of labor to hire. To take a step toward this decision, the third column |
|||||||
|
mar ginal product |
|
in Table 18-1 gives the marginal product of labor, the increase in the amount of |
||||||||
|
of labor |
|
output from an additional unit of labor. When the firm increases the number of |
||||||||
|
the increase in the amount of output |
|
workers from 1 to 2, for example, the amount of apples produced rises from 100 to |
||||||||
|
from an additional unit of labor |
|
180 bushels. Therefore, the marginal product of the second worker is 80 bushels. |
||||||||
TLFeBOOK
The Markets for the Factors of Production |
389 |
CHAPTER 18 THE MARKETS FOR THE FACTORS OF PRODUCTION |
401 |
Quantity |
|
|
|
|
|
|
of Apples |
|
|
|
|
|
|
300 |
|
|
|
|
|
Production |
|
|
|
|
|
function |
|
280 |
|
|
|
|
|
|
|
|
|
|
|
|
|
240 |
|
|
|
|
|
|
180 |
|
|
|
|
|
|
100 |
|
|
|
|
|
|
0 |
1 |
2 |
3 |
4 |
5 |
Quantity of |
|
|
|
|
|
|
Apple Pickers |
Figure 18-2
THE PRODUCTION FUNCTION.
The production function is the relationship between the inputs into production (apple pickers) and the output from production (apples). As the quantity of the input increases, the production function gets flatter, reflecting the property of diminishing marginal product.
Notice that as the number of workers increases, the marginal product of labor declines. As you may recall from Chapter 13, this property is called diminishing marginal product. At first, when only a few workers are hired, they pick apples from the best trees in the orchard. As the number of workers increases, additional workers have to pick from the trees with fewer apples. Hence, as more and more workers are hired, each additional worker contributes less to the production of apples. For this reason, the production function in Figure 18-2 becomes flatter as the number of workers rises.
THE VALUE OF THE MARGINAL PRODUCT
AND THE DEMAND FOR LABOR
Our profit-maximizing firm is concerned more with money than with apples. As a result, when deciding how many workers to hire, the firm considers how much profit each worker would bring in. Because profit is total revenue minus total cost, the profit from an additional worker is the worker’s contribution to revenue minus the worker’s wage.
To find the worker’s contribution to revenue, we must convert the marginal product of labor (which is measured in bushels of apples) into the value of the marginal product (which is measured in dollars). We do this using the price of apples. To continue our example, if a bushel of apples sells for $10 and if an additional worker produces 80 bushels of apples, then the worker produces $800 of revenue.
The value of the marginal product of any input is the marginal product of that input multiplied by the market price of the output. The fourth column in Table 18-1 shows the value of the marginal product of labor in our example, assuming the price of apples is $10 per bushel. Because the market price is constant for a competitive firm, the value of the marginal product (like the marginal product itself) diminishes as the number of workers rises.
diminishing mar ginal product
the property whereby the marginal product of an input declines as the quantity of the input increases
value of the mar ginal product
the marginal product of an input times the price of the output
TLFeBOOK