742 |
PART TWELVE SHORT-RUN ECONOMIC FLUCTUATIONS |
“Ray Brown on bass, Elvin Jones on drums, and Alan Greenspan on interest rates.”
6 percent.” In other words, when the Fed sets a target for the interest rate, it commits itself to adjusting the money supply in order to make the equilibrium in the money market hit that target.
As a result, changes in monetary policy can be viewed either in terms of a changing target for the interest rate or in terms of a change in the money supply. When you read in the newspaper that “the Fed has lowered the federal funds rate from 6 to 5 percent,” you should understand that this occurs only because the Fed’s bond traders are doing what it takes to make it happen. To lower the federal funds rate, the Fed’s bond traders buy government bonds, and this purchase increases the money supply and lowers the equilibrium interest rate (just as in Figure 32-3). Similarly, when the FOMC raises the target for the federal funds rate, the bond traders sell government bonds, and this sale decreases the money supply and raises the equilibrium interest rate.
The lessons from all this are quite simple: Changes in monetary policy that aim to expand aggregate demand can be described either as increasing the money supply or as lowering the interest rate. Changes in monetary policy that aim to contract aggregate demand can be described either as decreasing the money supply or as raising the interest rate.
CASE STUDY WHY THE FED WATCHES THE STOCK MARKET (AND VICE VERSA)
“Irrational exuberance.” That was how Federal Reserve Chairman Alan Greenspan once described the booming stock market of the late 1990s. He is right that the market was exuberant: Average stock prices increased about fourfold during this decade. Whether this rise was irrational, however, is more open to debate.
Regardless of how we view the booming market, it does raise an important question: How should the Fed respond to stock-market fluctuations? The Fed

CHAPTER 32 THE INFLUENCE OF MONETARY AND FISCAL POLICY ON AGGREGATE DEMAND |
743 |
has no reason to care about stock prices in themselves, but it does have the job of monitoring and responding to developments in the overall economy, and the stock market is a piece of that puzzle. When the stock market booms, households become wealthier, and this increased wealth stimulates consumer spending. In addition, a rise in stock prices makes it more attractive for firms to sell new shares of stock, and this stimulates investment spending. For both reasons, a booming stock market expands the aggregate demand for goods and services.
As we discuss more fully later in the chapter, one of the Fed’s goals is to stabilize aggregate demand, for greater stability in aggregate demand means greater stability in output and the price level. To do this, the Fed might respond to a stock-market boom by keeping the money supply lower and interest rates higher than it otherwise would. The contractionary effects of higher interest rates would offset the expansionary effects of higher stock prices. In fact, this analysis does describe Fed behavior: Real interest rates were kept high by historical standards during the “irrationally exuberant” stock-market boom of the late 1990s.
The opposite occurs when the stock market falls. Spending on consumption and investment declines, depressing aggregate demand and pushing the economy toward recession. To stabilize aggregate demand, the Fed needs to increase the money supply and lower interest rates. And, indeed, that is what it typically does. For example, on October 19, 1987, the stock market fell by 22.6 percent— its biggest one-day drop in history. The Fed responded to the market crash by
IN THE NEWS
European Central Bankers
Expand Aggregate Demand
The move came a month before the nations adopt the euro as a single currency and marked a drastic shift in policy. As recently as two months ago, European central bankers had adamantly resisted demands from political leaders to lower rates because they were intent on establishing the credibility of the euro and the fledgling European Central Bank in world markets.
But today, citing signs that the global economic slowdown has begun
Europe, the central banks of euro-zone nations reduced their interest rates by at least tenths of a percent. The cuts are
ded to help bolster the European by making it cheaper for and consumers to borrow.
“We are deaf to political pressure, are not blind to facts and arguHans Tietmeyer, the president
of Germany’s central bank, the Bundesbank, said. . . .
In announcing the decision, Mr. Tietmeyer said today that the central bankers had acted in response to mounting evidence that European growth rates would be significantly slower next year than they had predicted as recently as last summer.
SOURCE: The New York Times, December 4, 1998, p. A1.
744 |
PART TWELVE SHORT-RUN ECONOMIC FLUCTUATIONS |
increasing the money supply and lowering interest rates. The federal funds rate fell from 7.7 percent at the beginning of October to 6.6 percent at the end of the month. In part because of the Fed’s quick action, the economy avoided a recession.
While the Fed keeps an eye on the stock market, stock-market participants also keep an eye on the Fed. Because the Fed can influence interest rates and economic activity, it can alter the value of stocks. For example, when the Fed raises interest rates by reducing the money supply, it makes owning stocks less attractive for two reasons. First, a higher interest rate means that bonds, the alternative to stocks, are earning a higher return. Second, the Fed’s tightening of monetary policy risks pushing the economy into a recession, which reduces profits. As a result, stock prices often fall when the Fed raises interest rates.
QUICK QUIZ: Use the theory of liquidity preference to explain how a de crease in the money supply affects the equilibrium interest rate. How does this change in monetary policy affect the aggregate-demand curve?
HOW FISCAL POLICY
INFLUENCES AGGREGATE DEMAND
The government can influence the behavior of the economy not only with monetary policy but also with fiscal policy. Fiscal policy refers to the government’s choices regarding the overall level of government purchases or taxes. Earlier in the book we examined how fiscal policy influences saving, investment, and growth in the long run. In the short run, however, the primary effect of fiscal policy is on the aggregate demand for goods and services.
CHANGES IN GOVERNMENT PURCHASES
When policymakers change the money supply or the level of taxes, they shift the aggregate-demand curve by influencing the spending decisions of firms or households. By contrast, when the government alters its own purchases of goods and services, it shifts the aggregate-demand curve directly.
Suppose, for instance, that the U.S. Department of Defense places a $20 billion order for new fighter planes with Boeing, the large aircraft manufacturer. This order raises the demand for the output produced by Boeing, which induces the company to hire more workers and increase production. Because Boeing is part of the economy, the increase in the demand for Boeing planes means an increase in the total quantity of goods and services demanded at each price level. As a result, the aggregate-demand curve shifts to the right.
By how much does this $20 billion order from the government shift the aggregate-demand curve? At first, one might guess that the aggregate-demand curve shifts to the right by exactly $20 billion. It turns out, however, that this is not
746 |
PART TWELVE SHORT-RUN ECONOMIC FLUCTUATIONS |
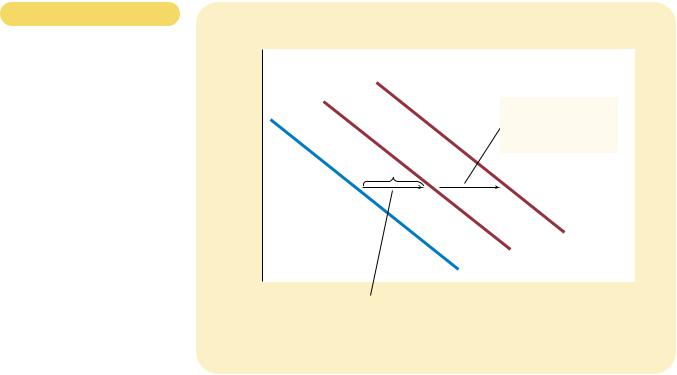
Figur e 32-4
THE MULTIPLIER EFFECT. An
increase in government purchases of $20 billion can shift the aggregate-demand curve to the right by more than $20 billion. This multiplier effect arises because increases in aggregate income
stimulate additional spending by consumers.
Price
Level
2. . . . but the multiplier effect can amplify the shift in aggregate demand.
$20 billion
|
|
|
AD3 |
|
|
|
AD2 |
|
|
Aggregate demand, AD1 |
|
|
|
|
0 |
|
|
Quantity of |
|
|
1. An increase in government purchases |
Output |
|
|
of $20 billion initially increases aggregate |
|
|
|
demand by $20 billion . . . |
|
|
|
|
|
To gauge the impact on aggregate demand of a change in government purchases, we follow the effects step-by-step. The process begins when the government spends $20 billion, which implies that national income (earnings and profits) also rises by this amount. This increase in income in turn raises consumer spending by MPC $20 billion, which in turn raises the income for the workers and owners of the firms that produce the consumption goods. This second increase in income again raises consumer spending, this time by MPC (MPC $20 billion). These feedback effects go on and on.
To find the total impact on the demand for goods and services, we add up all these effects:
Change in government purchases |
$20 billion |
First change in consumption |
MPC $20 billion |
Second change in consumption |
MPC2 |
$20 billion |
Third change in consumption |
MPC3 |
$20 billion |
• |
|
• |
• |
|
• |
• |
|
• |
Total change in demand |
|
|
(1 MPC MPC2 MPC3 · · ·) $20 billion.
Here, “. . .” represents an infinite number of similar terms. Thus, we can write the multiplier as follows:
CHAPTER 32 THE INFLUENCE OF MONETARY AND FISCAL POLICY ON AGGREGATE DEMAND |
747 |
Multiplier 1 MPC MPC2 MPC3 · · · ·
This multiplier tells us the demand for goods and services that each dollar of government purchases generates.
To simplify this equation for the multiplier, recall from math class that this expression is an infinite geometric series. For x between 1 and 1,
1 x x2 x3 · · · 1/(1 x).
In our case, x MPC. Thus,
Multiplier 1/(1 MPC).
For example, if MPC is 3/4, the multiplier is 1/(1 3/4), which is 4. In this case, the $20 billion of government spending generates $80 billion of demand for goods and services.
This formula for the multiplier shows an important conclusion: The size of the multiplier depends on the marginal propensity to consume. Whereas an MPC of 3/4 leads to a multiplier of 4, an MPC of 1/2 leads to a multiplier of only 2. Thus, a larger MPC means a larger multiplier. To see why this is true, remember that the multiplier arises because higher income induces greater spending on consumption. The larger the MPC is, the greater is this induced effect on consumption, and the larger is the multiplier.
OTHER APPLICATIONS OF THE MULTIPLIER EFFECT
Because of the multiplier effect, a dollar of government purchases can generate more than a dollar of aggregate demand. The logic of the multiplier effect, however, is not restricted to changes in government purchases. Instead, it applies to any event that alters spending on any component of GDP—consumption, investment, government purchases, or net exports.
For example, suppose that a recession overseas reduces the demand for U.S. net exports by $10 billion. This reduced spending on U.S. goods and services depresses U.S. national income, which reduces spending by U.S. consumers. If the marginal propensity to consume is 3/4 and the multiplier is 4, then the $10 billion fall in net exports means a $40 billion contraction in aggregate demand.
As another example, suppose that a stock-market boom increases households’ wealth and stimulates their spending on goods and services by $20 billion. This extra consumer spending increases national income, which in turn generates even more consumer spending. If the marginal propensity to consume is 3/4 and the multiplier is 4, then the initial impulse of $20 billion in consumer spending translates into an $80 billion increase in aggregate demand.
The multiplier is an important concept in macroeconomics because it shows how the economy can amplify the impact of changes in spending. A small initial change in consumption, investment, government purchases, or net exports can end up having a large effect on aggregate demand and, therefore, the economy’s production of goods and services.
CHAPTER 32 THE INFLUENCE OF MONETARY AND FISCAL POLICY ON AGGREGATE DEMAND |
749 |
(a) The Money Market
Interest |
|
|
|
Rate |
Money |
|
|
|
supply |
|
|
|
|
2. . . . the increase in |
|
|
|
spending increases |
|
r2 |
|
money demand . . . |
3. . . . which |
|
|
increases |
|
|
|
the |
r1 |
|
|
equilibrium |
|
|
|
interest |
|
|
MD2 |
rate . . . |
|
|
Money demand, MD1 |
|
|
|
|
0 |
Quantity fixed |
Quantity |
|
|
by the Fed |
of Money |
|
|
|
|
(b) The Shift in Aggregate Demand |
Price |
|
|
|
|
|
|
|
|
|
|
|
|
|
|
|
|
|
|
|
|
|
|
|
|
4. . . . which in turn |
|
Level |
|
|
|
|
|
|
|
|
|
|
|
|
|
|
|
partly offsets the |
|
1. When an |
|
|
|
|
|
|
|
|
|
|
|
$20 billion |
|
|
|
initial increase in |
|
increase in |
|
|
|
|
|
|
aggregate demand. |
|
|
|
|
|
|
|
|
|
government |
|
|
|
|
|
|
|
|
|
|
|
|
|
|
|
|
|
|
|
|
|
|
|
|
|
|
|
|
purchases |
|
|
|
|
|
|
|
|
|
|
increases |
|
|
|
|
|
|
|
|
|
|
aggregate |
|
|
|
|
|
|
|
|
|
|
demand . . . |
|
|
|
|
|
|
|
|
|
|
|
|
|
|
|
|
|
|
|
AD2 |
|
|
|
|
|
|
|
|
|
AD3 |
|
|
|
|
|
Aggregate demand, AD1 |
|
|
|
|
|
|
|
|
|
|
|
0 |
|
|
|
|
|
|
|
Quantity |
|
|
|
|
|
|
|
|
|
of Output |
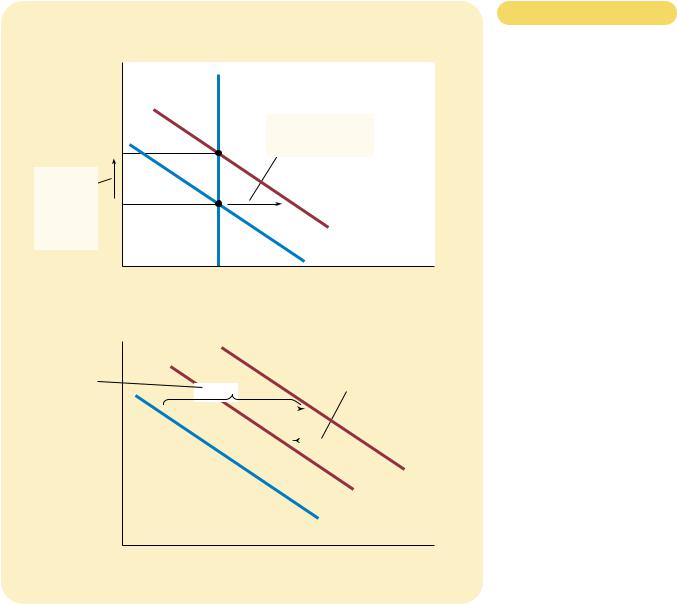
Figur e 32-5
THE CROWDING-OUT EFFECT.
Panel (a) shows the money market. When the government increases its purchases of goods and services, the resulting increase in income raises the demand for money from MD1 to MD2, and this causes the equilibrium interest rate to rise from r1 to r2. Panel (b) shows the effects on aggregate demand. The initial impact of the increase in government purchases shifts the aggregate-demand curve from AD1 to AD2. Yet, because the interest rate is the cost of borrowing, the increase in the interest rate tends to reduce
the quantity of goods and services demanded, particularly for investment goods. This crowding out of investment partially offsets the impact of the fiscal expansion on aggregate demand. In the end, the aggregate-demand curve shifts only to AD3.
interest rates make borrowing more costly, which reduces investment spending. This is the crowding-out effect. Depending on the size of the multiplier and crowding-out effects, the shift in aggregate demand could be larger or smaller than the tax change that causes it.
In addition to the multiplier and crowding-out effects, there is another important determinant of the size of the shift in aggregate demand that results from a tax change: households’ perceptions about whether the tax change is permanent or temporary. For example, suppose that the government announces a tax cut of $1,000 per household. In deciding how much of this $1,000 to spend, households must ask themselves how long this extra income will last. If households expect the
750 |
PART TWELVE SHORT-RUN ECONOMIC FLUCTUATIONS |
|
|
|
|
IN THE NEWS
Japan Tries a
Fiscal Stimulus
No other country has ever poured as much money—more than $830 billion the last 12 months alone—into economic revival as has Japan, and much of that money is now sloshing around the country and creating a noticeable impact. Here in this village in central Japan, as in much of the country, construction crews are busy again, small companies are getting loans again, and some people are feeling a tad more confident.
War II.
To the pessimists Japan is like a vehicle being towed away along the road by all that deficit spending; they doubt its engine will start without an overhaul.
Whatever the reasons for the movement, whatever the concerns for the future, though, the passengers throughout Japan seem relieved that at least the vehicle may be going forward again.
SOURCE: The New York Times, March 11, 1999, p. C1.
tax cut to be permanent, they will view it as adding substantially to their financial resources and, therefore, increase their spending by a large amount. In this case, the tax cut will have a large impact on aggregate demand. By contrast, if households expect the tax change to be temporary, they will view it as adding only slightly to their financial resources and, therefore, will increase their spending by only a small amount. In this case, the tax cut will have a small impact on aggregate demand.
An extreme example of a temporary tax cut was the one announced in 1992. In that year, President George Bush faced a lingering recession and an upcoming reelection campaign. He responded to these circumstances by announcing a reduction in the amount of income tax that the federal government was withholding from workers’ paychecks. Because legislated income tax rates did not change, however, every dollar of reduced withholding in 1992 meant an extra dollar of taxes due on April 15, 1993, when income tax returns for 1992 were to be filed. Thus, Bush’s “tax cut” actually represented only a short-term loan from the government. Not surprisingly, the impact of the policy on consumer spending and aggregate demand was relatively small.
QUICK QUIZ: Suppose that the government reduces spending on highway construction by $10 billion. Which way does the aggregate-demand curve shift? Explain why the shift might be larger than $10 billion. Explain why
the shift might be smaller than $10 billion.
CHAPTER 32 THE INFLUENCE OF MONETARY AND FISCAL POLICY ON AGGREGATE DEMAND |
751 |
F Y I
How Fiscal
Policy Might
Affect
Aggregate
Supply
So far our discussion of fiscal policy has stressed how changes in government purchases and changes in taxes influence the quantity of goods and services demanded. Most economists believe that the short-run macroeconomic effects of fiscal policy work primarily through aggregate demand. Yet fiscal policy can potentially also influence the quantity of goods and ser-
vices supplied.
For instance, consider the effects of tax changes on aggregate supply. One of the Ten Principles of Economics in Chapter 1 is that people respond to incentives. When government policymakers cut tax rates, workers get to keep more of each dollar they earn, so they have a greater incentive to work and produce goods and services. If they respond to this incentive, the quantity of goods and services supplied will be greater at each price level, and the
aggregate-supply curve will shift to the right. Some economists, called supply-siders, have argued that the influence of tax cuts on aggregate supply is very large. Indeed, as we discussed in Chapter 8, some supply-siders claim the influence is so large that a cut in tax rates will actually increase tax revenue by increasing worker effort. Most economists, however, believe that the supply-side effects of tax cuts are much smaller.
Like changes in taxes, changes in government purchases can also potentially affect aggregate supply. Suppose, for instance, that the government increases expenditure on a form of government-provided capital, such as roads. Roads are used by private businesses to make deliveries to their customers; an increase in the quantity of roads increases these businesses’ productivity. Hence, when the government spends more on roads, it increases the quantity of goods and services supplied at any given price level and, thus, shifts the aggregate-supply curve to the right. This effect on aggregate supply is probably more important in the long run than in the short run, however, because it would take some time for the government to build the new roads and put them into use.
USING POLICY TO STABILIZE THE ECONOMY
We have seen how monetary and fiscal policy can affect the economy’s aggregate demand for goods and services. These theoretical insights raise some important policy questions: Should policymakers use these instruments to control aggregate demand and stabilize the economy? If so, when? If not, why not?
THE CASE FOR ACTIVE STABILIZATION POLICY
Let’s return to the question that began this chapter: When the president and Congress cut government spending, how should the Federal Reserve respond? As we have seen, government spending is one determinant of the position of the aggregate-demand curve. When the government cuts spending, aggregate demand will fall, which will depress production and employment in the short run. If the Federal Reserve wants to prevent this adverse effect of the fiscal policy, it can act to expand aggregate demand by increasing the money supply. A monetary expansion would reduce interest rates, stimulate investment spending, and expand aggregate demand. If monetary policy responds appropriately, the combined changes in monetary and fiscal policy could leave the aggregate demand for goods and services unaffected.
This analysis is exactly the sort followed by members of the Federal Open Market Committee. They know that monetary policy is an important determinant