Mankiw Principles of Economics (3rd ed)
.pdf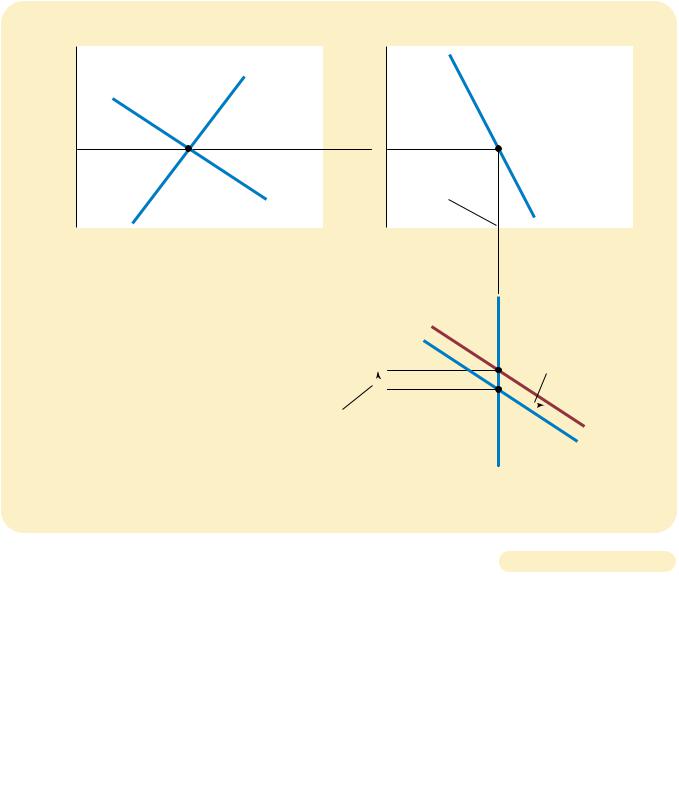
|
CHAPTER 30 |
A MACROECONOMIC THEORY OF THE OPEN ECONOMY |
691 |
|
(a) The Market for Loanable Funds |
(b) Net Foreign Investment |
|
Real |
|
Real |
|
Interest |
Supply |
Interest |
|
Rate |
Rate |
|
|
|
|
r1 |
|
r1 |
|
|
|
|
|
|
||||
|
|
|
|
|
|
|
|
3. Net exports, |
|
|
|
|
|
|
|
|
|
|
|
|
however, remain |
|
|
|
|
|
Demand |
|
|
|
|
the same. |
|
|
|
|
||
|
|
|
|
|
|
|
NFI |
|||||
|
|
|
|
|
|
|
|
|
|
|||
|
|
|
|
|
|
|
|
|
|
|
|
|
|
Quantity of |
|
|
|
|
|
|
|
Net Foreign |
|||
|
Loanable Funds |
|
|
|
|
|
|
|
Investment |
|||
|
|
|
|
|
Real |
|
|
|
|
|
|
|
|
|
|
|
|
|
Supply |
||||||
|
|
|
|
Exchange |
|
|
||||||
|
|
|
|
|
Rate |
|
|
|
|
|
|
|
|
|
|
|
|
|
|
|
|
|
|
1. An import |
|
|
|
|
|
|
|
|
|
|
|
|
quota increases |
|
|
|
|
|
|
E2 |
|
|
|
|
the demand for |
|
|
|
|
|
|
|
|
|
|
|
dollars . . . |
|
||
|
|
2. . . . and |
|
|
|
|
|
|
|
|
|
|
|
|
causes the |
|
E1 |
|
|
|
|
|
|
||
|
|
real exchange |
|
|
|
|
|
|
|
|
||
|
|
|
|
|
|
|
|
|
|
|||
|
|
rate to |
|
|
|
|
|
|
|
D2 |
||
|
|
appreciate. |
|
|
|
|
|
|
|
|||
|
|
|
|
|
|
|
|
|
|
|
||
|
|
|
|
|
|
|
|
|
|
|
D1 |
|
|
|
|
|
|
|
|
|
|
|
|
|
|
|
|
|
|
|
|
|
|
|
|
|
Quantity of |
|
|
|
|
|
|
|
|
|
|
|
|
Dollars |
|
|
|
|
|
|
|
|
(c) The Market for Foreign-Currency Exchange |
|||||
|
|
|
THE EFFECTS OF AN IMPORT QUOTA. When the U.S. government imposes a quota on the |
Figure 30-6 |
|
import of Japanese cars, nothing happens in the market for loanable funds in panel (a) or |
|
|
|
|
|
to net foreign investment in panel (b). The only effect is a rise in net exports (exports |
|
|
minus imports) for any given real exchange rate. As a result, the demand for dollars in the |
|
|
market for foreign-currency exchange rises, as shown by the shift from D1 to D2 in panel |
|
|
(c). This increase in the demand for dollars causes the value of the dollar to appreciate |
|
|
from E1 to E2. This appreciation of the dollar tends to reduce net exports, offsetting the |
|
|
direct effect of the import quota on the trade balance. |
|
|
|
|
|
|
|
|
due to the import quota. In the end, an import quota reduces both imports and exports, but net exports (exports minus imports) are unchanged.
We have thus come to a surprising implication: Trade policies do not affect the trade balance. That is, policies that directly influence exports or imports do not alter
692 |
PART ELEVEN THE MACROECONOMICS OF OPEN ECONOMIES |
|
net exports. This conclusion seems less surprising if one recalls the accounting |
|
identity: |
|
NX NFI S I. |
|
Net exports equal net foreign investment, which equals national saving minus |
|
domestic investment. Trade policies do not alter the trade balance because they do |
|
not alter national saving or domestic investment. For given levels of national |
|
saving and domestic investment, the real exchange rate adjusts to keep the trade |
|
balance the same, regardless of the trade policies the government puts in place. |
|
Although trade policies do not affect a country’s overall trade balance, these |
|
policies do affect specific firms, industries, and countries. When the U.S. govern- |
|
ment imposes an import quota on Japanese cars, General Motors has less competi- |
|
tion from abroad and will sell more cars. At the same time, because the dollar has |
|
appreciated in value, Boeing, the U.S. aircraft maker, will find it harder to compete |
|
with Airbus, the European aircraft maker. U.S. exports of aircraft will fall, and U.S. |
|
imports of aircraft will rise. In this case, the import quota on Japanese cars will in- |
|
crease net exports of cars and decrease net exports of planes. In addition, it will |
|
increase net exports from the United States to Japan and decrease net exports from |
|
the United States to Europe. The overall trade balance of the U.S. economy, how- |
|
ever, stays the same. |
|
The effects of trade policies are, therefore, more microeconomic than macro- |
|
economic. Although advocates of trade policies sometimes claim (incorrectly) that |
|
these policies can alter a country’s trade balance, they are usually more motivated |
|
by concerns about particular firms or industries. One should not be surprised, for |
|
instance, to hear an executive from General Motors advocating import quotas for |
|
Japanese cars. Economists almost always oppose such trade policies. As we saw in |
|
Chapters 3 and 9, free trade allows economies to specialize in doing what they do |
|
best, making residents of all countries better off. Trade restrictions interfere with |
|
these gains from trade and, thus, reduce overall economic well-being. |
POLITICAL INSTABILITY AND CAPITAL FLIGHT
|
In 1994 political instability in Mexico, including the assassination of a prominent |
|
political leader, made world financial markets nervous. People began to view |
|
Mexico as a much less stable country than they had previously thought. They |
|
decided to pull some of their assets out of Mexico in order to move these funds to |
|
the United States and other “safe havens.” Such a large and sudden movement of |
capital flight |
funds out of a country is called capital flight. To see the implications of capital |
a large and sudden reduction in |
flight for the Mexican economy, we again follow our three steps for analyzing a |
the demand for assets located |
change in equilibrium, but this time we apply our model of the open economy |
in a country |
from the perspective of Mexico rather than the United States. |
|
Consider first which curves in our model capital flight affects. When investors |
|
around the world observe political problems in Mexico, they decide to sell some of |
|
their Mexican assets and use the proceeds to buy U.S. assets. This act increases |
|
Mexican net foreign investment and, therefore, affects both markets in our model. |
|
Most obviously, it affects the net-foreign-investment curve, and this in turn influ- |
|
ences the supply of pesos in the market for foreign-currency exchange. In addition, |
|
because the demand for loanable funds comes from both domestic investment and |
|
net foreign investment, capital flight affects the demand curve in the market for |
|
loanable funds. |

694 |
PART ELEVEN THE MACROECONOMICS OF OPEN ECONOMIES |
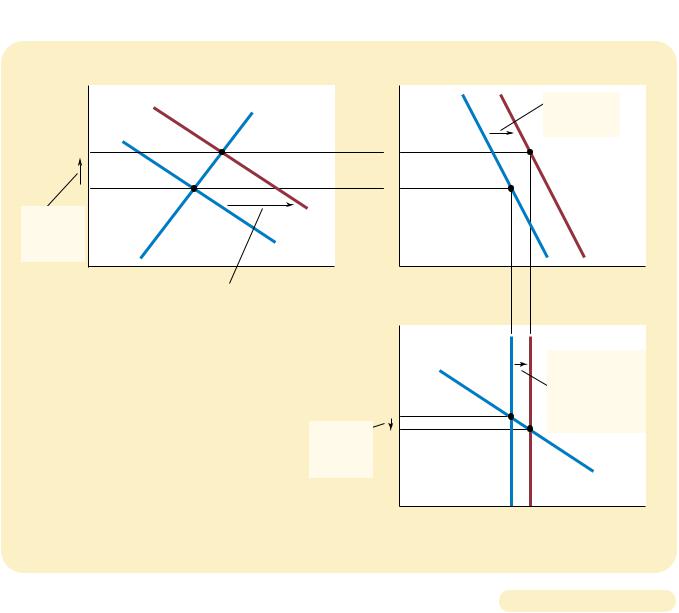
any interest rate, the net-foreign-investment curve also shifts to the right from NFI1 to NFI2, as in panel (b).
To see the effects of capital flight on the economy, we compare the old and new equilibria. Panel (a) of Figure 30-7 shows that the increased demand for loanable funds causes the interest rate in Mexico to rise from r1 to r2. Panel (b) shows that Mexican net foreign investment increases. (Although the rise in the interest rate does make Mexican assets more attractive, this development only partly offsets the impact of capital flight on net foreign investment.) Panel (c) shows that the increase in net foreign investment raises the supply of pesos in the market for foreign-currency exchange from S1 to S2. That is, as people try to get out of Mexican assets, there is a large supply of pesos to be converted into dollars. This increase in supply causes the peso to depreciate from E1 to E2. Thus, capital flight from Mexico increases Mexican interest rates and decreases the value of the Mexican peso in the market for foreign-currency exchange. This is exactly what was observed in 1994. From November 1994 to March 1995, the interest rate on short-term Mexican government bonds rose from 14 percent to 70 percent, and the peso depreciated in value from 29 to 15 U.S. cents per peso.
Although capital flight has its largest impact on the country from which capital is fleeing, it also affects other countries. When capital flows out of Mexico into the United States, for instance, it has the opposite effect on the U.S. economy as it has on the Mexican economy. In particular, the rise in Mexican net foreign investment coincides with a fall in U.S. net foreign investment. As the peso depreciates in value and Mexican interest rates rise, the dollar appreciates in value and U.S. interest rates fall. The size of this impact on the U.S. economy is small, however, because the economy of the United States is so large compared to that of Mexico.
The events that we have been describing in Mexico could happen to any economy in the world, and in fact they do from time to time. In 1997, the world learned that the banking systems of several Asian economies, including Thailand, South Korea, and Indonesia, were at or near the point of bankruptcy, and this news induced capital to flee from these nations. In 1998, the Russian government defaulted on its debt, inducing international investors to take whatever money they could and run. In each of these cases of capital flight, the results were much as our model predicts: rising interest rates and a falling currency.
Could capital flight ever happen in the United States? Although the U.S. economy has long been viewed as a safe economy in which to invest, political developments in the United States have at times induced small amounts of capital flight. For example, the September 22, 1995, issue of The New York Times reported that on the previous day, “House Speaker Newt Gingrich threatened to send the United States into default on its debt for the first time in the nation’s history, to force the Clinton administration to balance the budget on Republican terms” (p. A1). Even though most people believed such a default was unlikely, the effect of the announcement was, in a small way, similar to that experienced by Mexico in 1994. Over the course of that single day, the interest rate on a 30-year U.S. government bond rose from 6.46 percent to 6.55 percent, and the exchange rate fell from 102.7 to 99.0 yen per dollar. Thus, even the stable U.S. economy is potentially susceptible to the effects of capital flight.
QUICK QUIZ: Suppose that Americans decided to spend a smaller fraction of their incomes. What would be the effect on saving, investment, interest rates, the real exchange rate, and the trade balance?