Mankiw Principles of Economics (3rd ed)
.pdf680 |
PART ELEVEN THE MACROECONOMICS OF OPEN ECONOMIES |
economy. The preceding chapter introduced some of the key macroeconomic variables that describe an economy’s relationship with other economies—including net exports, net foreign investment, and the real and nominal exchange rates. This chapter develops a model that shows what forces determine these variables and how these variables are related to one another.
To develop this macroeconomic model of an open economy, we build on our previous analysis in two important ways. First, the model takes the economy’s GDP as given. We assume that the economy’s output of goods and services, as measured by real GDP, is determined by the supplies of the factors of production and by the available production technology that turns these inputs into output. Second, the model takes the economy’s price level as given. We assume the price level adjusts to bring the supply and demand for money into balance. In other words, this chapter takes as a starting point the lessons learned in Chapters 24 and 28 about the determination of the economy’s output and price level.
The goal of the model in this chapter is to highlight those forces that determine the economy’s trade balance and exchange rate. In one sense, the model is simple: It merely applies the tools of supply and demand to an open economy. Yet the model is also more complicated than others we have seen because it involves looking simultaneously at two related markets—the market for loanable funds and the market for foreign-currency exchange. After we develop this model of the open economy, we use it to examine how various events and policies affect the economy’s trade balance and exchange rate. We will then be able to determine the government policies that are most likely to reverse the trade deficits that the U.S. economy has experienced over the past decade.
SUPPLY AND DEMAND FOR LOANABLE FUNDS
AND FOR FOREIGN-CURRENCY EXCHANGE
To understand the forces at work in an open economy, we focus on supply and demand in two markets. The first is the market for loanable funds, which coordinates the economy’s saving and investment (including its net foreign investment). The second is the market for foreign-currency exchange, which coordinates people who want to exchange the domestic currency for the currency of other countries. In this section we discuss supply and demand in each of these markets. In the next section we put these markets together to explain the overall equilibrium for an open economy.
THE MARKET FOR LOANABLE FUNDS
When we first analyzed the role of the financial system in Chapter 25, we made the simplifying assumption that the financial system consists of only one market, called the market for loanable funds. All savers go to this market to deposit their saving, and all borrowers go to this market to get their loans. In this market, there is one interest rate, which is both the return to saving and the cost of borrowing.
CHAPTER 30 A MACROECONOMIC THEORY OF THE OPEN ECONOMY |
681 |
To understand the market for loanable funds in an open economy, the place to start is the identity discussed in the preceding chapter:
S I NFI
Saving Domestic investment Net foreign investment.
Whenever a nation saves a dollar of its income, it can use that dollar to finance the purchase of domestic capital or to finance the purchase of an asset abroad. The two sides of this identity represent the two sides of the market for loanable funds. The supply of loanable funds comes from national saving (S). The demand for loanable funds comes from domestic investment (I) and net foreign investment (NFI). Note that the purchase of a capital asset adds to the demand for loanable funds, regardless of whether that asset is located at home or abroad. Because net foreign investment can be either positive or negative, it can either add to or subtract from the demand for loanable funds that arises from domestic investment.
As we learned in our earlier discussion of the market for loanable funds, the quantity of loanable funds supplied and the quantity of loanable funds demanded depend on the real interest rate. A higher real interest rate encourages people to save and, therefore, raises the quantity of loanable funds supplied. A higher interest rate also makes borrowing to finance capital projects more costly; thus, it discourages investment and reduces the quantity of loanable funds demanded.
In addition to influencing national saving and domestic investment, the real interest rate in a country affects that country’s net foreign investment. To see why, consider two mutual funds—one in the United States and one in Germany—de- ciding whether to buy a U.S. government bond or a German government bond. The mutual funds would make this decision in part by comparing the real interest rates in the United States and Germany. When the U.S. real interest rate rises, the U.S. bond becomes more attractive to both mutual funds. Thus, an increase in the U.S. real interest rate discourages Americans from buying foreign assets and encourages foreigners to buy U.S. assets. For both reasons, a high U.S. real interest rate reduces U.S. net foreign investment.
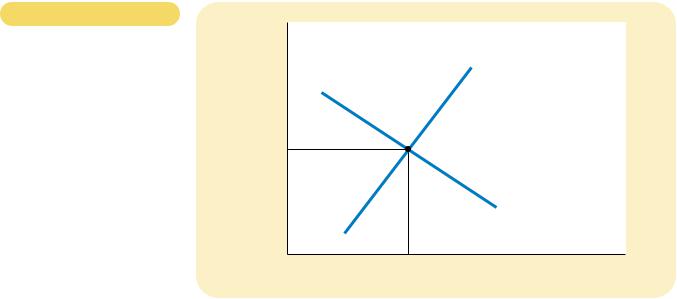
We represent the market for loanable funds on the familiar supply-and- demand diagram in Figure 30-1. As in our earlier analysis of the financial system, the supply curve slopes upward because a higher interest rate increases the quantity of loanable funds supplied, and the demand curve slopes downward because a higher interest rate decreases the quantity of loanable funds demanded. Unlike the situation in our previous discussion, however, the demand side of the market now represents the behavior of both domestic investment and net foreign investment. That is, in an open economy, the demand for loanable funds comes not only from those who want to borrow funds to buy domestic capital goods but also from those who want to borrow funds to buy foreign assets.
The interest rate adjusts to bring the supply and demand for loanable funds into balance. If the interest rate were below the equilibrium level, the quantity of loanable funds supplied would be less than the quantity demanded. The resulting shortage of loanable funds would push the interest rate upward. Conversely, if the interest rate were above the equilibrium level, the quantity of loanable funds supplied would exceed the quantity demanded. The surplus of loanable funds would drive the interest rate downward. At the equilibrium interest rate, the supply of loanable funds exactly balances the demand. That is, at the equilibrium interest rate,

684 |
PART ELEVEN THE MACROECONOMICS OF OPEN ECONOMIES |
rate were above the equilibrium level, the quantity of dollars supplied would exceed the quantity demanded. The surplus of dollars would drive the value of the dollar downward. At the equilibrium real exchange rate, the demand for dollars by foreigners arising from the U.S. net exports of goods and services exactly balances the supply of dollars from Americans arising from U.S. net foreign investment.
At this point, it is worth noting that the division of transactions between “supply” and “demand” in this model is somewhat artificial. In our model, net exports are the source of the demand for dollars, and net foreign investment is the source of the supply. Thus, when a U.S. resident imports a car made in Japan, our model treats that transaction as a decrease in the quantity of dollars demanded (because net exports fall) rather than an increase in the quantity of dollars supplied. Similarly, when a Japanese citizen buys a U.S. government bond, our model treats that transaction as a decrease in the quantity of dollars supplied (because net foreign investment falls) rather than an increase in the quantity of dollars demanded. This use of language may seem somewhat unnatural at first, but it will prove useful when analyzing the effects of various policies.
QUICK QUIZ: Describe the sources of supply and demand in the market for loanable funds and the market for foreign-currency exchange.
EQUILIBRIUM IN THE OPEN ECONOMY
So far we have discussed supply and demand in two markets—the market for loanable funds and the market for foreign-currency exchange. Let’s now consider how these markets are related to each other.
|
F Y I |
|
|
|
|
|
Purchasing- |
|
An alert reader of this book |
were cheaper in one country than in another, they would be |
|
|
Power Parity as |
|
might ask: Why are we develop- |
exported from the first country and imported into the sec- |
|
|
|
ing a theory of the exchange |
ond until the price difference disappeared. In other words, |
||
|
a Special Case |
|
rate here? Didn’t we already do |
the theory of purchasing-power parity assumes that net ex- |
|
|
|
|
|
that in the preceding chapter? |
ports are highly responsive to small changes in the real ex- |
|
|
|
|
As you may recall, the pre- |
change rate. If net exports were in fact so responsive, the |
|
|
|
|
ceding chapter developed a |
demand curve in Figure 30-2 would be horizontal. |
|
|
|
|
theory of the exchange rate |
Thus, the theory of purchasing-power parity can be |
|
|
|
|
called purchasing-power parity. |
viewed as a special case of the model considered here. In |
|
|
|
|
This theory asserts that a dol- |
that special case, the demand curve for foreign-currency ex- |
|
|
|
|
lar (or any other currency) must |
change, rather than being downward sloping, is horizontal at |
|
|
|
|
buy the same quantity of goods |
the level of the real exchange rate that ensures parity of |
|
|
|
|
and services in every country. |
purchasing power at home and abroad. That special case is |
|
As a result, the real exchange rate is fixed, and all changes |
a good place to start when studying exchange rates, but it is |
|||
|
in the nominal exchange rate between two currencies reflect |
far from the end of the story. |
|||
|
changes in the price levels in the two countries. |
This chapter, therefore, concentrates on the more real- |
|||
|
The model of the exchange rate developed here is re- |
istic case in which the demand curve for foreign-currency ex- |
|||
|
lated to the theory of purchasing-power parity. According to |
change is downward sloping. This allows for the possibility |
|||
|
the theory of purchasing-power parity, international trade re- |
that the real exchange rate changes over time, as in fact it |
|||
|
sponds quickly to international price differences. If goods |
sometimes does in the real world. |
|||
|
|
|
|
|
|
686 |
PART ELEVEN THE MACROECONOMICS OF OPEN ECONOMIES |
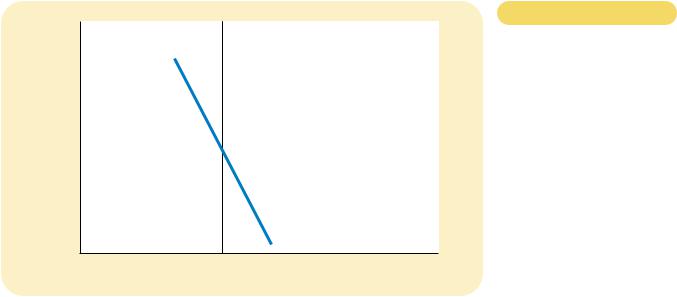
relationship between the interest rate and net foreign investment. This net-foreign- investment curve is the link between the market for loanable funds and the market for foreign-currency exchange.
SIMULTANEOUS EQUILIBRIUM IN TWO MARKETS
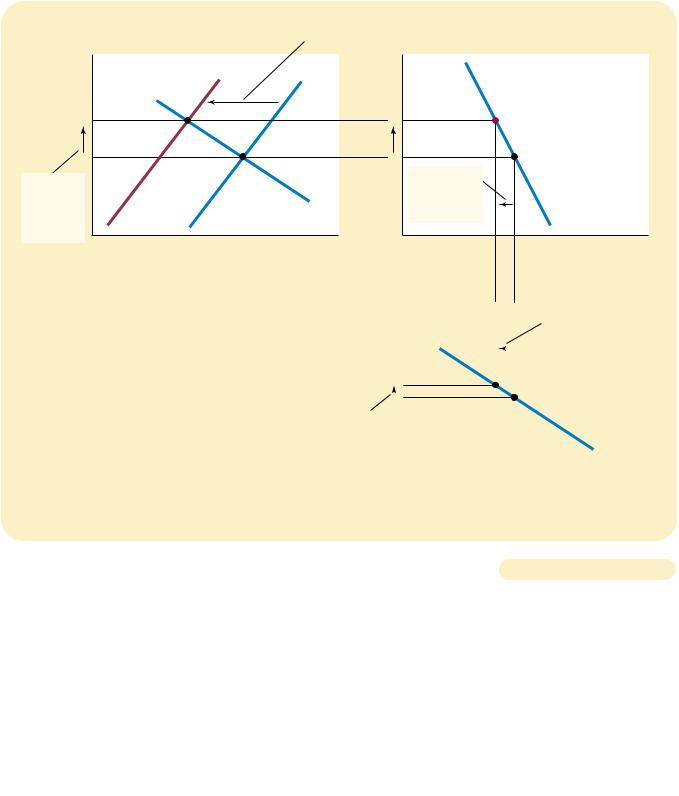
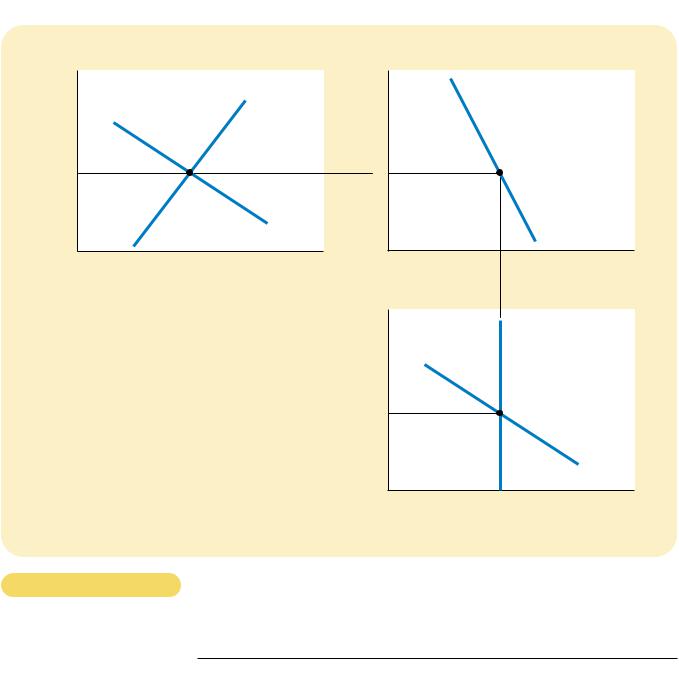
We can now put all the pieces of our model together in Figure 30-4. This figure shows how the market for loanable funds and the market for foreign-currency
(a) The Market for Loanable Funds |
(b) Net Foreign Investment |
Real |
|
Real |
|
Interest |
Supply |
Interest |
|
Rate |
Rate |
|
|
|
|
||
r1 |
|
r1 |
|
|
Demand |
|
Net foreign |
|
|
investment, |
|
|
|
|
NFI |
|
Quantity of |
|
Net Foreign |
|
Loanable Funds |
|
Investment |
|
|
Real |
Supply |
|
|
Exchange |
|
|
|
Rate |
|
|
|
E1 |
|
|
|
|
Demand |
|
|
|
Quantity of |
|
|
|
Dollars |
|
|
|
(c) The Market for Foreign-Currency Exchange |
Figure 30-4
THE REAL EQUILIBRIUM IN AN OPEN ECONOMY. In panel (a), the supply and demand for loanable funds determine the real interest rate. In panel (b), the interest rate determines net foreign investment, which provides the supply of dollars in the market for foreigncurrency exchange. In panel (c), the supply and demand for dollars in the market for foreign-currency exchange determine the real exchange rate.

CHAPTER 30 A MACROECONOMIC THEORY OF THE OPEN ECONOMY |
687 |
exchange jointly determine the important macroeconomic variables of an open economy.
Panel (a) of the figure shows the market for loanable funds (taken from Figure 30-1). As before, national saving is the source of the supply of loanable funds. Domestic investment and net foreign investment are the source of the demand for loanable funds. The equilibrium real interest rate (r1) brings the quantity of loanable funds supplied and the quantity of loanable funds demanded into balance.
Panel (b) of the figure shows net foreign investment (taken from Figure 30-3). It shows how the interest rate from panel (a) determines net foreign investment. A higher interest rate at home makes domestic assets more attractive, and this in turn reduces net foreign investment. Therefore, the net-foreign-investment curve in panel (b) slopes downward.
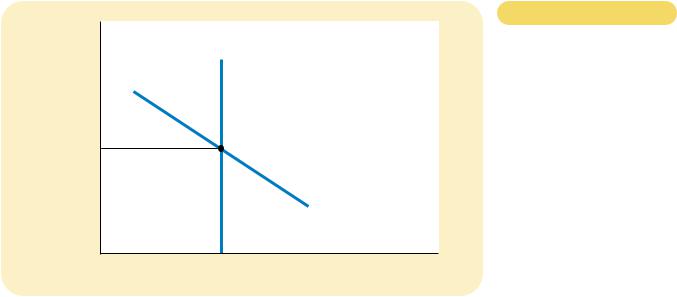
Panel (c) of the figure shows the market for foreign-currency exchange (taken from Figure 30-2). Because net foreign investment must be paid for with foreign currency, the quantity of net foreign investment from panel (b) determines the supply of dollars to be exchanged into foreign currencies. The real exchange rate does not affect net foreign investment, so the supply curve is vertical. The demand for dollars comes from net exports. Because a depreciation of the real exchange rate increases net exports, the demand curve for foreign-currency exchange slopes downward. The equilibrium real exchange rate (E1) brings into balance the quantity of dollars supplied and the quantity of dollars demanded in the market for foreigncurrency exchange.
The two markets shown in Figure 30-4 determine two relative prices—the real interest rate and the real exchange rate. The real interest rate determined in panel
(a) is the price of goods and services in the present relative to goods and services in the future. The real exchange rate determined in panel (c) is the price of domestic goods and services relative to foreign goods and services. These two relative prices adjust simultaneously to balance supply and demand in these two markets. As they do so, they determine national saving, domestic investment, net foreign investment, and net exports. In a moment, we will use this model to see how all these variables change when some policy or event causes one of these curves to shift.
QUICK QUIZ: In the model of the open economy just developed, two markets determine two relative prices. What are the markets? What are the two relative prices?
HOW POLICIES AND EVENTS
AFFECT AN OPEN ECONOMY
Having developed a model to explain how key macroeconomic variables are determined in an open economy, we can now use the model to analyze how changes in policy and other events alter the economy’s equilibrium. As we proceed, keep in mind that our model is just supply and demand in two markets—the market for loanable funds and the market for foreign-currency exchange. When using the model to analyze any event, we can apply the three steps outlined in Chapter 4.
688 |
PART ELEVEN THE MACROECONOMICS OF OPEN ECONOMIES |
First, we determine which of the supply and demand curves the event affects. Second, we determine which way the curves shift. Third, we use the supply-and- demand diagrams to examine how these shifts alter the economy’s equilibrium.
GOVERNMENT BUDGET DEFICITS
When we first discussed the supply and demand for loanable funds earlier in the book, we examined the effects of government budget deficits, which occur when government spending exceeds government revenue. Because a government budget deficit represents negative public saving, it reduces national saving (the sum of public and private saving). Thus, a government budget deficit reduces the supply of loanable funds, drives up the interest rate, and crowds out investment.
Now let’s consider the effects of a budget deficit in an open economy. First, which curve in our model shifts? As in a closed economy, the initial impact of the budget deficit is on national saving and, therefore, on the supply curve for loanable funds. Second, which way does this supply curve shift? Again as in a closed economy, a budget deficit represents negative public saving, so it reduces national saving and shifts the supply curve for loanable funds to the left. This is shown as the shift from S1 to S2 in panel (a) of Figure 30-5.
Our third and final step is to compare the old and new equilibria. Panel (a) shows the impact of a U.S. budget deficit on the U.S. market for loanable funds. With fewer funds available for borrowers in U.S. financial markets, the interest rate rises from r1 to r2 to balance supply and demand. Faced with a higher interest rate, borrowers in the market for loanable funds choose to borrow less. This change is represented in the figure as the movement from point A to point B along the demand curve for loanable funds. In particular, households and firms reduce their purchases of capital goods. As in a closed economy, budget deficits crowd out domestic investment.
In an open economy, however, the reduced supply of loanable funds has additional effects. Panel (b) shows that the increase in the interest rate from r1 to r2 reduces net foreign investment. [This fall in net foreign investment is also part of the decrease in the quantity of loanable funds demanded in the movement from point A to point B in panel (a).] Because saving kept at home now earns higher rates of return, investing abroad is less attractive, and domestic residents buy fewer foreign assets. Higher interest rates also attract foreign investors, who want to earn the higher returns on U.S. assets. Thus, when budget deficits raise interest rates, both domestic and foreign behavior cause U.S. net foreign investment to fall.
Panel (c) shows how budget deficits affect the market for foreign-currency exchange. Because net foreign investment is reduced, people need less foreign currency to buy foreign assets, and this induces a leftward shift in the supply curve for dollars from S1 to S2. The reduced supply of dollars causes the real exchange rate to appreciate from E1 to E2. That is, the dollar becomes more valuable compared to foreign currencies. This appreciation, in turn, makes U.S. goods more expensive compared to foreign goods. Because people both at home and abroad switch their purchases away from the more expensive U.S. goods, exports from the United States fall, and imports into the United States rise. For both reasons, U.S. net exports fall. Hence, in an open economy, government budget deficits raise real interest rates, crowd out domestic investment, cause the dollar to appreciate, and push the trade balance toward deficit.