494 |
PART EIGHT THE DATA OF MACROECONOMICS |
microeconomics
the study of how households and firms make decisions and how they interact in markets
macroeconomics the study of economy-wide
phenomena, including inflation, unemployment, and economic growth
sales), or the imbalance of trade between the United States and the rest of the world (the trade deficit). All these statistics are macroeconomic. Rather than telling us about a particular household or firm, they tell us something about the entire economy.
As you may recall from Chapter 2, economics is divided into two branches: microeconomics and macroeconomics. Microeconomics is the study of how individual households and firms make decisions and how they interact with one another in markets. Macroeconomics is the study of the economy as a whole. The goal of macroeconomics is to explain the economic changes that affect many households, firms, and markets at once. Macroeconomists address diverse questions: Why is average income high in some countries while it is low in others? Why do prices rise rapidly in some periods of time while they are more stable in other periods? Why do production and employment expand in some years and contract in others? What, if anything, can the government do to promote rapid growth in incomes, low inflation, and stable employment? These questions are all macroeconomic in nature because they concern the workings of the entire economy.
Because the economy as a whole is just a collection of many households and many firms interacting in many markets, microeconomics and macroeconomics are closely linked. The basic tools of supply and demand, for instance, are as central to macroeconomic analysis as they are to microeconomic analysis. Yet studying the economy in its entirety raises some new and intriguing challenges.
In this chapter and the next one, we discuss some of the data that economists and policymakers use to monitor the performance of the overall economy. These data reflect the economic changes that macroeconomists try to explain. This chapter considers gross domestic product, or simply GDP, which measures the total income of a nation. GDP is the most closely watched economic statistic because it is thought to be the best single measure of a society’s economic well-being.
THE ECONOMY’S INCOME AND EXPENDITURE
If you were to judge how a person is doing economically, you might first look at his or her income. A person with a high income can more easily afford life’s necessities and luxuries. It is no surprise that people with higher incomes enjoy higher standards of living—better housing, better health care, fancier cars, more opulent vacations, and so on.
The same logic applies to a nation’s overall economy. When judging whether the economy is doing well or poorly, it is natural to look at the total income that everyone in the economy is earning. That is the task of gross domestic product (GDP).
GDP measures two things at once: the total income of everyone in the economy and the total expenditure on the economy’s output of goods and services. The reason that GDP can perform the trick of measuring both total income and total expenditure is that these two things are really the same. For an economy as a whole, income must equal expenditure.
Why is this true? The reason that an economy’s income is the same as its expenditure is simply that every transaction has two parties: a buyer and a seller. Every dollar of spending by some buyer is a dollar of income for some seller. Suppose, for instance, that Karen pays Doug $100 to mow her lawn. In this case, Doug is a seller of a service, and Karen is a buyer. Doug earns $100, and Karen spends $100. Thus,
Revenue
(= GDP)
Goods
and services sold
FIRMS
Inputs for production
Wages, rent, and profit (= GDP)
CHAPTER 22 MEASURING A NATION’S INCOME |
495 |
MARKETS FOR
GOODS AND
SERVICES
Spending
(= GDP)
Goods and services bought
HOUSEHOLDS
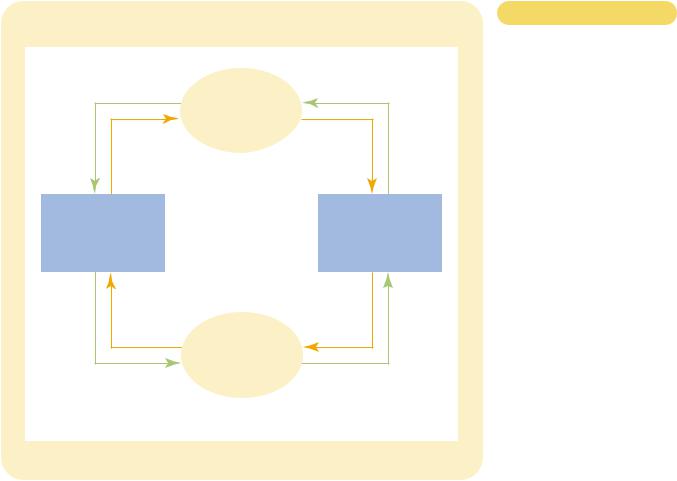
Figur e 22-1
THE CIRCULAR-FLOW DIAGRAM.
Households buy goods and services from firms, and firms use their revenue from sales to pay wages to workers, rent to landowners, and profit to firm owners. GDP equals the total amount spent by households in the market for goods and services. It also equals the total wages, rent, and profit paid by firms in the markets for the factors of production.
MARKETS FOR FACTORS OF PRODUCTION
Labor, land, and capital
Income (= GDP)
 Flow of goods and services
 Flow of dollars
the transaction contributes equally to the economy’s income and to its expenditure. GDP, whether measured as total income or total expenditure, rises by $100.
Another way to see the equality of income and expenditure is with the circularflow diagram in Figure 22-1. (You may recall this circular-flow diagram from Chapter 2.) This diagram describes all the transactions between households and firms in a simple economy. In this economy, households buy goods and services from firms; these expenditures flow through the markets for goods and services. The firms in turn use the money they receive from sales to pay workers’ wages, landowners’ rent, and firm owners’ profit; this income flows through the markets for the factors of production. In this economy, money continuously flows from households to firms and then back to households.
We can compute GDP for this economy in one of two ways: by adding up the total expenditure by households or by adding up the total income (wages, rent, and profit) paid by firms. Because all expenditure in the economy ends up as someone’s income, GDP is the same regardless of how we compute it.
The actual economy is, of course, more complicated than the one illustrated in Figure 22-1. In particular, households do not spend all of their income. Households pay some of their income to the government in taxes, and they save and invest some of their income for use in the future. In addition, households do not buy all
CHAPTER 22 MEASURING A NATION’S INCOME |
497 |
drugs. It also excludes most items that are produced and consumed at home and, therefore, never enter the marketplace. Vegetables you buy at the grocery store are part of GDP; vegetables you grow in your garden are not.
These exclusions from GDP can at times lead to paradoxical results. For example, when Karen pays Doug to mow her lawn, that transaction is part of GDP. If Karen were to marry Doug, the situation would change. Even though Doug may continue to mow Karen’s lawn, the value of the mowing is now left out of GDP because Doug’s service is no longer sold in a market. Thus, when Karen and Doug marry, GDP falls.
“FINAL . . .”
When International Paper makes paper, which Hallmark then uses to make a greeting card, the paper is called an intermediate good, and the card is called a final good. GDP includes only the value of final goods. The reason is that the value of intermediate goods is already included in the prices of the final goods. Adding the market value of the paper to the market value of the card would be double counting. That is, it would (incorrectly) count the paper twice.
An important exception to this principle arises when an intermediate good is produced and, rather than being used, is added to a firm’s inventory of goods to be used or sold at a later date. In this case, the intermediate good is taken to be “final” for the moment, and its value as inventory investment is added to GDP. When the inventory of the intermediate good is later used or sold, the firm’s inventory investment is negative, and GDP for the later period is reduced accordingly.
“GOODS AND SERVICES . . .”
GDP includes both tangible goods (food, clothing, cars) and intangible services (haircuts, housecleaning, doctor visits). When you buy a CD by your favorite singing group, you are buying a good, and the purchase price is part of GDP. When you pay to hear a concert by the same group, you are buying a service, and the ticket price is also part of GDP.
“PRODUCED . . .”
GDP includes goods and services currently produced. It does not include transactions involving items produced in the past. When General Motors produces and sells a new car, the value of the car is included in GDP. When one person sells a used car to another person, the value of the used car is not included in GDP.
“WITHIN A COUNTRY . . .”
GDP measures the value of production within the geographic confines of a country. When a Canadian citizen works temporarily in the United States, his production is part of U.S. GDP. When an American citizen owns a factory in Haiti, the production at his factory is not part of U.S. GDP. (It is part of Haiti’s GDP.) Thus, items are included in a nation’s GDP if they are produced domestically, regardless of the nationality of the producer.
498 |
PART EIGHT THE DATA OF MACROECONOMICS |
F Y I
Other Measures
of Income
When the U.S. Department of Commerce computes the nation’s GDP every three months, it also computes various other measures of income to get a more complete picture of what’s happening in the economy. These other measures differ from GDP by excluding or including certain categories of income. What follows is a brief description of five of these income measures, ordered from largest to smallest.
Gross national product (GNP) is the total income earned by a nation’s permanent residents (called nationals). It differs from GDP by including income that our citizens earn abroad and excluding income that foreigners earn here. For example, when a Canadian citizen works temporarily in the United States, his production is part of U.S. GDP, but it is not part of U.S. GNP. (It is part of Canada’s GNP.) For most countries, including the United States, domestic residents are responsible for most domestic production, so GDP and GNP are quite close.
National income is the total income earned by a nation’s residents in the production of goods and services. It differs from net national product by excluding indirect business taxes (such as sales taxes) and including business subsidies. NNP and national income also differ because of a “statistical discrepancy” that arises from problems in data collection.
Personal income is the income that households and noncorporate businesses receive. Unlike national income, it excludes retained earnings, which is income that corporations have earned but have not paid out to their owners. It also subtracts corporate income taxes and contributions for social insurance (mostly Social Security taxes). In addition, personal income includes the interest income that households receive from their holdings of government debt and the income that households receive from government transfer programs, such as welfare and Social Security.
Disposable personal income is the income that households and noncorporate businesses have left after satisfying all their obligations to the government. It equals personal income minus personal taxes and certain nontax payments (such as traffic tickets).
Although the various measures of income differ in detail,
Net national product (NNP) is the total income of a they almost always tell the same story about economic con-
nation’s residents (GNP) minus losses from depreciation. Depreciation is the wear and tear on the economy’s stock of equipment and structures, such as trucks rusting and lightbulbs burning out. In the national income accounts prepared by the Department of Commerce, depreciation is called the “consumption of fixed capital.”
ditions. When GDP is growing rapidly, these other measures of income are usually growing rapidly. And when GDP is falling, these other measures are usually falling as well. For monitoring fluctuations in the overall economy, it does not matter much which measure of income we use.
“. . . IN A GIVEN PERIOD OF TIME.”
GDP measures the value of production that takes place within a specific interval of time. Usually that interval is a year or a quarter (three months). GDP measures the economy’s flow of income and expenditure during that interval.
When the government reports the GDP for a quarter, it usually presents GDP “at an annual rate.” This means that the figure reported for quarterly GDP is the amount of income and expenditure during the quarter multiplied by 4. The government uses this convention so that quarterly and annual figures on GDP can be compared more easily.
In addition, when the government reports quarterly GDP, it presents the data after they have been modified by a statistical procedure called seasonal adjustment. The unadjusted data show clearly that the economy produces more goods and services during some times of year than during others. (As you might guess, December’s Christmas shopping season is a high point.) When monitoring the
CHAPTER 22 MEASURING A NATION’S INCOME |
499 |
condition of the economy, economists and policymakers often want to look beyond these regular seasonal changes. Therefore, government statisticians adjust the quarterly data to take out the seasonal cycle. The GDP data reported in the news are always seasonally adjusted.
Now let’s repeat the definition of GDP:
Gross domestic product (GDP) is the market value of all final goods and services produced within a country in a given period of time.
It should be apparent that GDP is a sophisticated measure of the value of economic activity. In advanced courses in macroeconomics, you will learn more of the subtleties that arise in its calculation. But even now you can see that each phrase in this definition is packed with meaning.
QUICK QUIZ: Which contributes more to GDP—the production of a pound of hamburger or the production of a pound of caviar? Why?
THE COMPONENTS OF GDP
Spending in the economy takes many forms. At any moment, the Smith family may be having lunch at Burger King; General Motors may be building a car factory; the Navy may be procuring a submarine; and British Airways may be buying an airplane from Boeing. GDP includes all of these various forms of spending on domestically produced goods and services.
To understand how the economy is using its scarce resources, economists are often interested in studying the composition of GDP among various types of spending. To do this, GDP (which we denote as Y) is divided into four components: consumption (C), investment (I), government purchases (G), and net exports (NX):
Y C I G NX.
This equation is an identity—an equation that must be true by the way the variables in the equation are defined. In this case, because each dollar of expenditure included in GDP is placed into one of the four components of GDP, the total of the four components must be equal to GDP.
We have just seen an example of each component. Consumption is spending by households on goods and services, such as the Smiths’ lunch at Burger King. Investment is the purchase of capital equipment, inventories, and structures, such as the General Motors factory. Investment also includes expenditure on new housing. (By convention, expenditure on new housing is the one form of household spending categorized as investment rather than consumption.) Government purchases include spending on goods and services by local, state, and federal governments, such as the Navy’s purchase of a submarine. Net exports equal the purchases of domestically produced goods by foreigners (exports) minus the domestic purchases of foreign goods (imports). A domestic firm’s sale to a buyer in another country, such as the Boeing sale to British Airways, increases net exports.
The “net” in “net exports” refers to the fact that imports are subtracted from exports. This subtraction is made because imports of goods and services are
consumption
spending by households on goods and services, with the exception of purchases of new housing
investment
spending on capital equipment, inventories, and structures, including household purchases of new housing
government purchases spending on goods and services by local, state, and federal governments
net expor ts
spending on domestically produced goods by foreigners (exports) minus spending on foreign goods by domestic residents (imports)
500 |
PART EIGHT THE DATA OF MACROECONOMICS |
Table 22-1
GDP AND ITS COMPONENTS.
This table shows total GDP for the U.S. economy in 1998 and the breakdown of GDP among its four components. When reading this table, recall the identity
Y C I G NX.
|
TOTAL |
|
PERCENT |
|
(IN BILLIONS) |
PER PERSON |
OF TOTAL |
|
|
|
|
Gross domestic product, Y |
$8,511 |
$31,522 |
100% |
Consumption, C |
5,808 |
21,511 |
68 |
Investment, I |
1,367 |
5,063 |
16 |
Government purchases, G |
1,487 |
5,507 |
18 |
Net exports, NX |
151 |
559 |
2 |
|
|
|
|
SOURCE: U.S. Department of Commerce.
included in other components of GDP. For example, suppose that a household buys a $30,000 car from Volvo, the Swedish carmaker. That transaction increases consumption by $30,000 because car purchases are part of consumer spending. It also reduces net exports by $30,000 because the car is an import. In other words, net exports include goods and services produced abroad (with a minus sign) because these goods and services are included in consumption, investment, and government purchases (with a plus sign). Thus, when a domestic household, firm, or government buys a good or service from abroad, the purchase reduces net exports—but because it also raises consumption, investment, or government purchases, it does not affect GDP.
The meaning of “government purchases” also requires a bit of clarification. When the government pays the salary of an Army general, that salary is part of government purchases. But what happens when the government pays a Social Security benefit to one of the elderly? Such government spending is called a transfer payment because it is not made in exchange for a currently produced good or service. From a macroeconomic standpoint, transfer payments are like a tax rebate. Like taxes, transfer payments alter household income, but they do not reflect the economy’s production. Because GDP is intended to measure income from (and expenditure on) the production of goods and services, transfer payments are not counted as part of government purchases.
Table 22-1 shows the composition of U.S. GDP in 1998. In this year, the GDP of the United States was about $8.5 trillion. If we divide this number by the 1998 U.S. population of 270 million, we find that GDP per person—the amount of expenditure for the average American—was $31,522. Consumption made up about twothirds of GDP, or $21,511 per person. Investment was $5,063 per person. Government purchases were $5,507 per person. Net exports were –$559 per person. This number is negative because Americans earned less from selling to foreigners than they spent on foreign goods.
QUICK QUIZ: List the four components of expenditure. Which is the largest?
REAL VERSUS NOMINAL GDP
As we have seen, GDP measures the total spending on goods and services in all markets in the economy. If total spending rises from one year to the next, one of two things must be true: (1) the economy is producing a larger output of goods

|
|
|
CHAPTER 22 MEASURING A NATION’S INCOME |
501 |
|
|
|
PRICES AND QUANTITIES |
|
|
|
|
|
|
|
|
|
YEAR |
PRICE OF HOT DOGS |
QUANTITY OF HOT DOGS |
PRICE OF HAMBURGERS |
QUANTITY OF HAMBURGERS |
|
|
|
|
|
|
|
2001 |
$1 |
100 |
$2 |
50 |
|
2002 |
2 |
150 |
3 |
100 |
|
2003 |
3 |
200 |
4 |
150 |
|
YEAR |
CALCULATING NOMINAL GDP |
|
|
2001 |
($1 per hot dog 100 hot dogs) ($2 per hamburger 50 hamburgers) $200 |
2002 |
($2 per hot dog 150 hot dogs) ($3 per hamburger 100 hamburgers) $600 |
2003 |
($3 per hot dog 200 hot dogs) ($4 per hamburger 150 hamburgers) $1,200 |
YEAR |
CALCULATING REAL GDP (BASE YEAR 2001) |
|
|
2001 |
($1 per hot dog 100 hot dogs) ($2 per hamburger 50 hamburgers) $200 |
2002 |
($1 per hot dog 150 hot dogs) ($2 per hamburger 100 hamburgers) $350 |
2003 |
($1 per hot dog 200 hot dogs) ($2 per hamburger 150 hamburgers) $500 |
YEAR |
CALCULATING THE GDP DEFLATOR |
|
|
2001 |
($200/$200) 100 100 |
2002 |
($600/$350) 100 171 |
2003 |
($1,200/$500) 100 240 |
|
REAL AND NOMINAL GDP. This table shows how to calculate real GDP, nominal GDP, |
Table 22-2 |
|
and the GDP deflator for a hypothetical economy that produces only hot dogs and |
|
|
|
hamburgers. |
|
|
|
|
|
and services, or (2) goods and services are being sold at higher prices. When studying changes in the economy over time, economists want to separate these two effects. In particular, they want a measure of the total quantity of goods and services the economy is producing that is not affected by changes in the prices of those goods and services.
To do this, economists use a measure called real GDP. Real GDP answers a hypothetical question: What would be the value of the goods and services produced this year if we valued these goods and services at the prices that prevailed in some specific year in the past? By evaluating current production using prices that are fixed at past levels, real GDP shows how the economy’s overall production of goods and services changes over time.
To see more precisely how real GDP is constructed, let’s consider an example.
A NUMERICAL EXAMPLE
Table 22-2 shows some data for an economy that produces only two goods—hot dogs and hamburgers. The table shows the quantities of the two goods produced and their prices in the years 2001, 2002, and 2003.
CHAPTER 22 MEASURING A NATION’S INCOME |
503 |
The GDP deflator is calculated as follows:
GDP deflator Nominal GDP 100.
Real GDP
Because nominal GDP and real GDP must be the same in the base year, the GDP deflator for the base year always equals 100. The GDP deflator for subsequent years measures the rise in nominal GDP from the base year that cannot be attributable to a rise in real GDP.
The GDP deflator measures the current level of prices relative to the level of prices in the base year. To see why this is true, consider a couple of simple examples. First, imagine that the quantities produced in the economy rise over time but prices remain the same. In this case, both nominal and real GDP rise together, so the GDP deflator is constant. Now suppose, instead, that prices rise over time but the quantities produced stay the same. In this second case, nominal GDP rises but real GDP remains the same, so the GDP deflator rises as well. Notice that, in both cases, the GDP deflator reflects what’s happening to prices, not quantities.
Let’s now return to our numerical example in Table 22-2. The GDP deflator is computed at the bottom of the table. For year 2001, nominal GDP is $200, and real GDP is $200, so the GDP deflator is 100. For the year 2002, nominal GDP is $600, and real GDP is $350, so the GDP deflator is 171. Because the GDP deflator rose in year 2002 from 100 to 171, we can say that the price level increased by 71 percent.
The GDP deflator is one measure that economists use to monitor the average level of prices in the economy. We examine another—the consumer price index—in the next chapter, where we also describe the differences between the two measures.
GDP deflator
a measure of the price level calculated as the ratio of nominal GDP to real GDP times 100
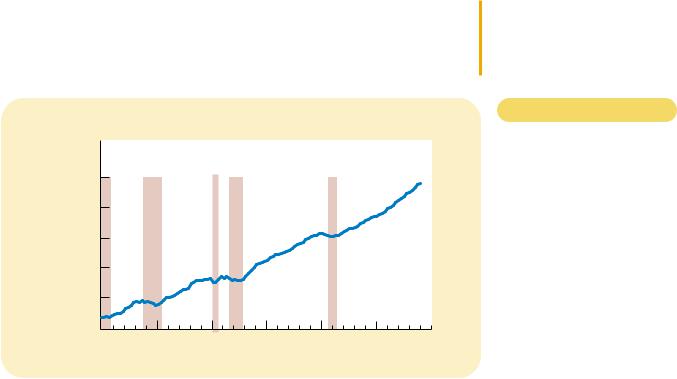
CASE STUDY REAL GDP OVER RECENT HISTORY
Now that we know how real GDP is defined and measured, let’s look at what this macroeconomic variable tells us about the recent history of the United States. Figure 22-2 shows quarterly data on real GDP for the U.S. economy since 1970.
Billions of
1992 Dollars
$8,000 |
|
|
|
|
|
|
$7,000 |
|
|
|
|
|
|
6,000 |
|
|
|
|
|
|
5,000 |
|
|
|
|
|
|
4,000 |
|
|
|
|
|
|
3,000 |
|
|
|
|
|
|
1970 |
1975 |
1980 |
1985 |
1990 |
1995 |
2000 |
Figur e 22-2
REAL GDP IN THE UNITED
STATES. This figure shows quarterly data on real GDP for the U.S. economy since 1970. Recessions—periods of falling real GDP—are marked with the shaded vertical bars.
SOURCE: U.S. Department of Commerce.