

Словари и журналы / Психологические журналы / p15Journal of Occupational and Organizational Psychology
.pdf15
Journal of Occupational and Organizational Psychology (2002), 75, 15–32
© 2002 The British Psychological Society
www.bps.org.uk
Reducing latent deprivation during unemployment: The role of meaningful leisure activity
Lea E. Waters1 * and Kathleen A. Moore2
1University of Melbourne, Australia
2Deakin University, Australia
The aim of this study was to investigate the role of meaningful leisure activity in reducing latent deprivation during unemployment. Samples of unemployed (N=201) and employed (N=128) participants were asked to rate their levels of latent deprivation using the Access to Categories of Experience Scale. They were also asked to complete the ProŽ le of Mood States depression subscale, Adult SelfPerception ProŽ le, Meaningful Leisure Activities Questionnaire, and to rate the frequency with which they engaged in social and solitary leisure activities. Results indicate that unemployed participants engaged in social leisure activities less frequently than employed participants and solitary leisure activities more frequently; and they reported higher perceived latent deprivation, higher depressive affect and lower self-esteem. Structural Equation Modelling revealed that a sense of latent deprivation contributed to depressive affect and reduced self-esteem in both unemployed and employed samples, although the impact of latent deprivation upon depressive affect and self-esteem was signiŽcantly greater in the unemployed sample. The meaning attained through social and solitary leisure activities acted to reduce perceived latent deprivation, and thus psychological distress, in unemployed participants. However, only social leisure activities had an impact upon latent deprivation and psychological health in the employed sample. Overall, these Ž ndings suggest that participation in leisure activities that are meaningful, rather than simply frequent, may be a constructive and readily achievable coping response during unemployment.
A major explanation of the negative relationship between unemployment and psychological health is Jahoda’s (1979, 1992) deprivation theory. Jahoda argued that unemployment causes psychological distress because it deprives people of the latent functions that employment provides. These functions are time structure, regular shared experiences, information about personal identity, a link with collective purpose and enforced activity. In support of Jahoda’s theory, Evans and Haworth (1991) and Haworth and Ducker (1991) showed that deprivation of shared experiences, information about identity, collective purpose, and enforced activity were associated with low self-esteem, poor psychological health, and reduced life satisfaction in unemployed people. In addition, Feather and Bond (1983) and Wanberg, Griffiths, and Gavin
*Requests for reprints should be addressed to Lea Waters, Department of Management, The University of Melbourne, Parkville 3052, Australia (e-mail: l.waters@unimelb.edu.au).
16 Lea Waters and Kathleen Moore
(1997) found that deprivation of time structure during unemployment was linked to poor mental health.
Given the negative relationship between the deprivation of these latent functions (latent deprivation) and psychological distress it is important to ascertain ways in which such deprivation can be reduced (Waters, 2000). The current study aims to investigate the role of meaningful leisure activity in reducing latent deprivation and psychological distress during unemployment. This investigation is important for several reasons. First, it will help to demonstrate empirically the interrelationships between meaningful leisure activity, latent deprivation, and psychological health as well as to explore the separate contributions that social leisure activities and solitary leisure activities make towards deprivation and psychological health. Secondly, this study will use a comparison group of adults in full-time employment and will move away from the concentration in previous literature on youth samples. Finally, this study adopts a phenomenological approach and assesses the subjective meaning people attach to leisure rather than following the traditional research approach of assessing the frequency with which unemployed people engage in leisure.
Although the literature has typically found a positive relationship between leisure activity and psychological health during unemployment (Roberts, Lamb, Dench, & Brodie, 1989; Winefield, Tiggemann, & Winefield, 1992), the underlying reason for this relationship has received limited research attention. Evans and Haworth (1991) suggested that the way in which leisure activities might promote psychological health during unemployment is by partially fulfilling the latent functions of employment nominated by Jahoda. They assessed the relationship between use of leisure time and fulfilment of the latent functions in a sample of young adults. They found that unemployed youths who were busy during the day experienced lower levels of latent deprivation than unemployed youths who were inactive. They concluded, therefore, that ‘high levels of activity (keeping busy) during unemployment can operate in a psychologically supportive manner’ (p. 257). However, this finding should be interpreted with some caution because the authors assessed ‘time-used’ rather than ‘activity’ engaged in.
An attempt to address this issue was made by Haworth and Ducker (1991) when they compared active and passive leisure activities. While their results suggested that involvement in leisure activities may help to fulfil the latent functions of employment, they also indicated that it was not leisure activities per se but, rather, certain types of leisure activities that satisfied these functions. Specifically, they found that participation in ‘active leisure’ (e.g. playing a game, sport, going to the theatre) produced higher levels of fulfilment of the latent functions of employment in young unemployed adults than participation in ‘passive leisure’ (e.g. reading, listening to music, watching television). Clearly, the type of activity, in this case active vs. passive lesiure, must be considered when investigating the influence of leisure on latent deprivation.
Another way to conceptualize the activities assessed by Haworth and Ducker may be as social vs. solitary activities. Certainly, Lemon, Bengsten, and Peterson (1972) and Reitzes, Mutran, and Verrill (1995) proposed that leisure activities can be classified along a social–solitary dimension. Furthermore, they suggested that social activities provide stronger opportunities for role enhancement and self-development then solitary activities and are, therefore, more strongly linked to well-being. Although Haworth and Ducker (1991) classified leisure activities as either ‘active’ or ‘passive’ they also suggested that active leisure may ‘provide some social structure’ (p. 270)
Reducing latent deprivation during unemployment |
17 |
thereby indirectly suggesting that social activities, perhaps through a sense of shared experiences, play an important role in reducing latent deprivation.
The effect of social vs. solitary leisure activities in psychological health was examined by Winefield et al. (1992) in a sample of unemployed school leavers. Winefield et al. asked respondents to rate how much of their spare time they spent engaged in activities with other people (gregarious activities) and how much of their spare time they spent in solitary activities. They found that social activities were negatively related to depressive affect, negative mood and psychological distress while solitary activities were unrelated to these psychological indices. This important finding highlights the need to distinguish between social and solitary leisure activities.
However, even Winefield et al.’s results may underrepresent the need for the separate analysis of social and solitary activities. As Steinkemp and Kelly (1987) observed, their assessment of ‘use of time spent on activities’ ignored the role of the subjective meaning that individuals attach to an activity. It could be argued, therefore, that the differences in subjective meaning that individuals attach to their social and solitary activities would be more predictive of psychological health and a reduced sense of latent deprivation than simply the amount of time spent in either activity.
While some studies have directly, or indirectly, captured the elements of Jahoda’s latent functions in leisure activities, Winefield et al.’s study is the only one to examine the separate effects of social and solitary leisure activities. However, given that psychological health was the outcome used by Winefield et al. the unique effects of social and solitary leisure activities upon latent deprivation remain unknown. Moreover, information about the subjective meaning that individuals attach to social and solitary leisure activities compared with an assessment of the frequency of activities during unemployment, and their relative contributions to reducing latent deprivation, is still required.
It is also important to extend prior investigations into the role of leisure activityduring unemployment from a focus on youth and young-adult samples to an older cohort of unemployed persons. Although it maybe reasonable to suggest that, as in youth samples, leisure activitywould also promote psychological health and decrease latent deprivation in adults, researchers must be cautious in generalizing results from youth samples. This is particularlytrue in light of several studies which show that youth and adult samples have different reactions to, and experiences during, unemployment (e.g. Goldsmith, Veum, & Darity, 1996; Gurney, 1980; Jackson & Warr, 1984).
This paper will report the results of a comparison between unemployed and employed adults on their levels of perceived latent deprivation; the frequency with which they engage in social and solitary leisure activities; the subjective meaning attached to social and solitary leisure activities, and psychological health (operationalized by low depressive affect and high self-esteem). The study will also investigate the interrelationships between latent deprivation, meaningful leisure activity, and psychological health within the unemployed and employed samples.
It is hypothesized that unemployed participants will report higher levels of perceived latent deprivation, higher levels of depressive affect and lower levels of self-esteem than employed participants. It is also predicted that unemployed people will engage in social and solitary leisure activities less frequently than employed participants and will report deriving lower levels of meaning from both social and solitary leisure activities. It is hypothesized that unemployed participants will engage in social activities less frequently than solitary activities, and that employed participants will engage in solitary leisure activities less frequently than social leisure activities.
18 Lea Waters and Kathleen Moore
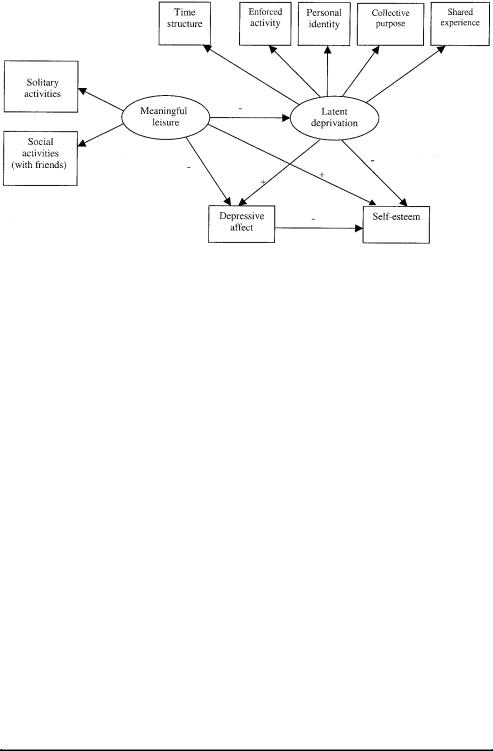
Figure 1. Hypothesized model of meaningful leisure activity, latent deprivation, depressive affect and self-esteem
Within the unemployed sample, it is hypothesized that social activities will be more negatively related to perceived latent deprivation and depressive affect, and more positively related to self-esteem than solitary activities; perceived latent deprivation will be positively associated with depressive affect and negatively associated with self-esteem; meaningful leisure activity will have a direct negative impact on depressive affect and a direct positive impact on self-esteem; and meaningful leisure activity will have an indirect impact on self-esteem and depressive affect through its impact on perceived latent deprivation (see Fig. 1). In addition, these relationships will be explored in the employed comparison group.
Method
Participants
The number of people participating in the study was 329: 201 people were unemployed (49% female, 51%male; age M=32.41, SD=10.18 years) and 128 people were in full-time employment (59%female, 41%male; age M=35.00, SD=11.73 years).
The unemployed participants were recruited through the Commonwealth Employment Service (CES). At the time of data collection during 1997/98 the CES (now obsolete) was a national government service providing referrals to jobs and/or individually tailored case management for job seekers through network offices Australia-wide. The unemployed sample was recruited via offices in the southern area of Melbourne, Australia.
In an attempt to achieve consistency in financial situation among the unemployed sample, only people who were receiving the Federal Government unemployment benefit (Newstart Allowance)1 were recruited into the study. In addition, unemployed participants were required to have been unemployed for at least 6 weeks in order to overcome possible short-term confoundings in relation to either extreme distress or to apathy upon initially experiencing unemployment (Patton & Noller, 1990; Rowley & Feather, 1987; Shamir, 1986).
The ability to screen out unemployed people who were not receiving unemployment benefits was an advantage offered by the current method of recruiting unemployed people via the CES.
1The minimum beneŽt paid through Newstart Allowance is Australian $264.70 per fortnight and the maximum amount set at Australian $347.80 per fortnight (Department of Employment, Education, Training and Youth Affairs (1997)).

Reducing latent deprivation during unemployment |
19 |
This recruitment method also allowed the researchers to achieve a reasonably equal gender distribution, to screen out unemployed youth, and to recruit people from the same regional area, therefore controlling for a number of confounding variables. However, it must be recognized that by only approaching unemployed people who were officially registered with the CES, the generalizability of the current sample may be somewhat limited. For example, it may be that jobless people who are not officially registered as unemployed are less financially needy than people who are officially registered and this potential difference in financial status might influence the leisure patterns and feelings of deprivation of these two groups; although, as mentioned above, financial status was one of the variables that the researchers attempted to hold constant. Ultimately, the researchers decided to risk a possible compromise to generalizability2 in order to reduce the number of possible confounding variables.
The employed sample was recruited by two means. First, staff at the CES used their contacts with local employers to distribute 300 questionnaires. Responses were received from 106 people (35%). In an attempt to increase the size of the employed sample, the researchers distributed 50 questionnaires to employed people through their own social networks. In an attempt to overcome any possible bias, the researcher ensured that a roughly even number of professional and non-professional acquaintances were approached. A further 20 surveys were distributed to employees of a small rubber factory in the south-eastern region of Melbourne: these questionnaires were distributed to employees on the factory floor. Of the 70 surveys distributed in these ways, 23 people returned the completed questionnaire (33%). Employed participants received essentially the same questionnaire, plain language statement, and consent form as unemployed participants.
MANOVA was used to compare the two employed groups on depressive affect, self-esteem, deprivation, solitary activity frequency, social activity frequency, solitary activity meaning, and social activitymeaning. No significant differences were found (F(7,109)=.85, p>.05). Chi-square tests revealed no association between the method of recruitment with gender, education level, marital status and occupational status. These results enable the data to be combined into the one group of employed respondents.
Forty per cent of employed participants were working in white-collar jobs (e.g., professional, management) and 60%were working in blue-collar jobs (e.g. clerical, unskilled labour, trade, transport) as classified by the Australian Standard Classification of Occupations (Department of Employment, Education, Training and Youth Affairs, 1997). These percentages are similar to the labour force statistics at the time of data collection (38% white-collar and 62% blue-collar) (Australian Bureau of Statistics, 1997).
Materials
Respondents were asked to record their age, gender, and educational level.
The frequency with which participants engaged in social leisure activities (activities with friends) and solitary leisure activities (activities performed alone) over the previous month was assessed using a 7-point Likert scale from 1 ‘Less than once a month’ to 7 ‘Twice daily’. In addition, participants completed the following battery of tests. Descriptive statistics and internal reliabilities for the current samples are presented in Table 1.
The Meaningful Leisure Activities Questionnaire (MLAQ) (Waters & Moore, 1999) was used to assess the degree of meaning attached to leisure activities. Respondents were asked to rate their social and solitary activities along four dimensions: satisfaction, perceived importance, goal achievement, and interest. Each dimension was answered along a 7-point Likert scale, e.g. 1 ‘Not satisfying’ to 7 ‘Extremely satisfying’ with the possible score ranging from 4 to 28.
Appraisal of latent deprivation was assessed using the Access to Categories of Experience Scale (ACE) (Evans & Haworth, 1991). This scale assesses deprivation in the five latent functions nominated by Jahoda (1979): time structure, shared experiences, identity, collective purpose and enforced activity. Each function is assessed by 3 items. Respondents are asked to rate how strongly they agree or disagree with the items along a 5-point Likert scale ranging from 1
2The demographic proŽ le of the current unemployed sample (e.g. gender, length of unemployment, marital status, occupational status and educational level) was comparable to the Australian national data on unemployed people at the time of data collection (Australian Bureau of Statistics, 1997), indicating that this sample was generalizable to the larger population of jobless people registered with the CES.
20 Lea Waters and Kathleen Moore
‘Strongly disagree’ to 5 ‘Strongly agree’. This yields a range of 3 to 15 for each subscale. Higher scores indicate a greater level of deprivation in relation to each function. Evans and Banks (1992) reported internal reliability for each function as: time structure (a=.52), shared experiences (a=.62), identity (a=.58), collective purpose (a=.62), and enforced activity (a=.58). Content validity evidence for the ACE scale based on factor analysis was also provided by Evans and Banks (1992).
Depressive affect, as experienced in the past week, was assessed using the 15-item depression subscale from the Profile of Mood States (McNair, Lorr, & Droppleman, 1981). Items are answered along a 4-point Likert scale from 0 ‘Not at all’ to 3 ‘Extremely’. Scores range from 0 to 60 with a higher score reflecting higher levels of depressive affect. McNair et al.’s (1981) normative studies reported strong internal reliability(a=.95).
Self-esteem was measured via the 6-item Global Self Worth subscale from Messer and Harter’s (1986) Adult Self Perception Profile. Items are answered along a 4-point Likert scale from 1 ‘Strongly disagree’ to 4 ‘Strongly agree’. Scores range from 6 to 24 with a higher score reflecting a more positive self-esteem. Messer and Harter reported strong internal reliability (a=.92).
Procedure
In order to maintain client confidentiality, the sampling frame and subsequent mail-out to unemployed persons was conducted by CES staff. A random sample of 500 unemployed people who met the above inclusion criteria was generated and an invitation to participate in a study investigating ‘leisure activities, feelings of deprivation, mood and self-esteem’ was mailed to these people together with a request for volunteers to collect a questionnaire from the CES office. The 40%response rate (201/500) is similar to that obtained by Leana and Feldman (1990, 1995) and Wanberg, Watt, and Rumsey (1996) in unemployed samples. Employed participants were recruited with the support of their employers or directly via the researchers (combined response rate=34%) and, like the unemployed participants, they too returned the questionnaires anonymously in the reply aid envelope provided.
All questionnaires were completed in respondents’ own time. Unemployed participants received a ten-dollar payment upon return of the questionnaire. All respondents were sent a thank-you letter.
Results
An analysis of unemployed and employed people revealed no associations between employment status and gender (c2(1)=3.04, p>.05) or between employment status and education level (c2(1)=.10, p>.05) suggesting the two groups were comparable in terms of demographic profile.
Aone-way between-subjects MANOVAwas performed to assess differences between unemployed and employed participants on frequency of social and solitary leisure activities, meaning attained through social and solitary leisure activities, perceived deprivation of latent functions and psychological health (depressive affect and selfesteem). Pillai’s Trace test for unequal sized groups revealed a global difference between unemployed and employed participants on these dependent variables (F(11,305)=46.87, p<.001) (see Table 1). Eta Square was .65, suggesting that employment status was able to predict 65%of the difference in frequency of social and solitary leisure activities, meaning attained through social and solitary leisure activities, perceived deprivation of latent functions and psychological health.
The unemployed sample engaged in social leisure activities less frequently and solitary leisure activities more frequently than the employed sample; they also reported higher depressive affect and lower self-esteem. Furthermore, unemployed participants reported that they were significantly more deprived of the latent functions of time structure, shared experience, personal identity, collective purpose and enforced

Reducing latent deprivation during unemployment |
21 |
Table 1. Means, standard deviations, Cronbach alpha, F and p values for the frequency and meaning of social and solitary leisure activities, depressive affect, self-esteem and latent deprivation in unemployed and employed participants
|
|
Employment status |
|
|
|
|
|
|
|
|
|
|
Eta2 |
Variables |
|
Unemployed |
Employed |
F(1,327) |
p |
|
|
|
|
|
|
|
|
Activity frequency |
|
|
|
|
|
|
Social activities |
M |
2.81 |
4.92 |
160.65 |
.0001 |
.32 |
|
SD |
1.50 |
1.62 |
|
|
|
Solitary activities |
M |
5.24 |
3.41 |
112.84 |
.0001 |
.26 |
|
SD |
1.72 |
1.25 |
|
|
|
Activity meaning |
|
|
|
|
|
|
Social activities |
M |
22.35 |
22.84 |
.02 |
.099 |
.01 |
|
SD |
4.84 |
3.79 |
|
|
|
|
a |
.82 |
.81 |
|
|
|
Solitary activities |
M |
23.27 |
23.02 |
2.74 |
.903 |
.01 |
|
SD |
6.67 |
4.06 |
|
|
|
|
a |
.67 |
.70 |
|
|
|
Psychological health |
|
|
|
|
|
|
Depressive affect |
M |
16.97 |
6.39 |
58.87 |
.0001 |
.14 |
|
SD |
14.41 |
7.68 |
|
|
|
|
a |
.95 |
.93 |
|
|
|
Self-esteem |
M |
15.96 |
18.99 |
87.98 |
.0001 |
.22 |
|
SD |
3.22 |
2.46 |
|
|
|
|
a |
.78 |
.80 |
|
|
|
Latent deprivation |
|
|
|
|
|
|
Time structure |
M |
10.76 |
6.50 |
108.33 |
.0001 |
.22 |
|
SD |
3.94 |
2.56 |
|
|
|
|
a |
.59 |
.65 |
|
|
|
Shared experience |
M |
10.98 |
7.23 |
91.68 |
.0001 |
.25 |
|
SD |
3.50 |
3.01 |
|
|
|
|
a |
.64 |
.63 |
|
|
|
Personal identity |
M |
11.41 |
6.65 |
128.01 |
.0001 |
.30 |
|
SD |
4.02 |
2.49 |
|
|
|
|
a |
.61 |
.62 |
|
|
|
Collective purpose |
M |
11.19 |
7.41 |
85.37 |
.0001 |
.23 |
|
SD |
3.87 |
2.93 |
|
|
|
|
a |
.61 |
.61 |
|
|
|
Enforced activity |
M |
10.43 |
6.58 |
79.01 |
.0001 |
.20 |
|
SD |
4.09 |
3.19 |
|
|
|
|
a |
.62 |
.64 |
|
|
|
|
|
|
|
|
|
|
activity. No differences were found between unemployed and employed people on the meaning they attached to their social and solitary leisure activities.
A within-sample t test revealed that unemployed people reported less frequent engagement in social activities than solitary activities (t(191)=28.40, p<.001). In contrast, employed people engaged in social activities significantly more frequently than solitary activities (t(116)=6.16, p<.001) (see Table 1 for means and standard deviations).

22 Lea Waters and Kathleen Moore
Correlations for the unemployed and employed samples between the frequency of social leisure activities, frequency of solitary activities, meaning of social leisure activities, meaning of solitary activities, depressive affect, self-esteem, time structure, shared experience, personal identity, collective purpose and enforced activity are presented in Table 2. In the unemployed sample, the five latent functions of employment were all interrelated, as would be expected. The highest relationship occurred between shared experience and personal identity (r=.64), this was followed in magnitude by the relationship between time structure and enforced activity (r=.53). The five latent functions were also interrelated in the employed sample with personal identity and time structure having the strongest correlation (r=.56). A similar profile of intercorrelations between the five subscales was reported by Creed and Machin (1999). Despite these significant correlations, the current data pose no problems with respect to multicollinearity or singularity (Tabachick & Fidell, 1995).
The two indicators of psychological health (depressive affect and self-esteem) were negatively related in both samples (unemployed r= - .46; employed r= - .36). The measures of activity meaning were more significantly related to latent deprivation than the measures of activity frequency in both samples. The structural equation model investigating the relationship between leisure activity and latent deprivation will, therefore, use activity meaning rather than activity frequency.
These correlations were then used to test the structural model separately for unemployed and employed samples (see Fig. 1) using Structural Equation Modelling with AMOS (Version 4) (Arbuckle & Wothke, 1999). However, following Anderson and Gerbing’s (1988) recommendation of a two-stage approach, the measurement models were tested prior to assessment of the structural model. The measurement models for the assessment of meaning attained from social activities, depressive affect and self-esteem were not initially acceptable. However, modifications based on intercorrelations of scale items which were substantively appropriate improved the fit of the data to the factor. Table 3 presents the model indicators for each of the scales: latent deprivation, meaning attained through solitary leisure activities, meaning attained through social leisure activities, depressive affect, and self-esteem, among the unemployed group.
Structural Equation Modelling (SEM) was run in the unemployed sample and the independent model which tests the hypothesis that variables are uncorrelated was easily rejected (c2(9)=543.65, p>.001). The hypothesized model was tested next and while the unemployed data provided an adequate fit to the model (c2(23)=59.63, p>.001; Goodness of Fit=.938; Adjusted Goodness of Fit=.879; IFI=.930; CFI=.949; Tucker–Lewis=.887; RMSEA=.089; P/CLOSE=.011)3, the pathways between meaningful leisure activity and self-esteem; depressive affect and self-esteem; and meaningful leisure activity and depressive affect were not significant, and the modification indices
3Following suggestions made by the editor and one anonymous reviewer, a possible alternative model was also tested whereby pathways between depressive affect, self-esteem, and deprivation were altered to test the assumption that ‘people with depressed affect and low self-esteem experience more deprivation’. Given that the degrees of freedom were the same in both models, the traditional test of chi-square change could not be applied. As such, we followed the recommendation of Browne and Cudeck (1993) to compare the RMSEA of both models. The RMSEA is a test of ‘lack of Ž t’ and demonstrates how well the model, with parameter values based on the sample, Ž ts the population covariance matrix. The RMSEA for the alternative model was .089, which corresponded exactly to the hypothesized model. The alternative model was then modiŽed to get the best Ž t and the RMSEA was compared between the Ž nal version of the hypothesized model and the Ž nal version of the alternative model. In both cases the RMSEA was .046. In these circumstances, Browne and Cudeck (1993) recommend that where the RMSEA shows no difference in the Ž t of models, researchers should retain the theoretically grounded model. In this case, the hypothesized model is the preferred model.

Table 2. Pearson correlations between activity frequency, activity meaning, psychological health and latent functions in unemployed and employed samples
|
|
|
|
|
|
Employed sample |
|
|
|
|
||
|
|
|
|
|
|
|
|
|
|
|
|
|
Variables |
1 |
2 |
3 |
4 |
5 |
6 |
7 |
8 |
9 |
10 |
11 |
|
|
|
|
|
|
|
|
|
|
|
|
|
|
1. |
Social activity frequency |
1 |
.09 |
.04 |
.18* |
.16 |
2.05 |
2.07 |
.03 |
2.06 |
2.06 |
.06 |
2. |
Solitary activity frequency |
.14* |
1 |
.22* |
.18* |
2.03 |
.09 |
.09 |
2.04 |
2.08 |
2.12 |
2.01 |
3. |
Social activity meaning |
.18* |
.03 |
1 |
.16 |
2.14 |
.62** |
2.27** |
2.14 |
2.29** |
2.17 |
2.18* |
4. |
Solitary activity meaning |
.01 |
.22** |
.25** |
1 |
2.11 |
.10 |
2.09 |
2.05 |
2.29** |
2.12 |
2.16 |
5. |
Depressive affect |
2.10 |
2.03 |
2.18** |
2.12 |
1 |
2.36** |
.43** |
.12 |
.30** |
.26** |
.38** |
6. |
Self-esteem |
.05 |
.04 |
.10 |
.10 |
2.46** |
1 |
2.39** |
2.21* |
2.33** |
2.27** |
2.21* |
7. |
Time structure |
2.06 |
2.07 |
2.18** |
2.19** |
.38** |
.34** |
1 |
.34** |
.56** |
.36** |
.44** |
8. |
Shared experience |
2.13 |
2.02 |
2.24** |
2.06 |
.37** |
.40** |
.43** |
1 |
.26** |
.17 |
.19* |
9. |
Personal identity |
2.06 |
2.13 |
2.27** |
2.19** |
.59** |
.54** |
.49** |
.64** |
1 |
.21** |
.42** |
10. |
Purpose |
2.02 |
2.06 |
2.26** |
2.25** |
.33** |
.29** |
.38** |
.44** |
.49** |
1 |
.26** |
11. |
Enforced activity |
.09 |
2.15* |
2.08 |
2.17* |
.39** |
.37** |
.53** |
.26** |
.42** |
.27** |
1 |
Unemployed sample
*Correlation is signiŽ cant at the .05 level (two-tailed). **Correlation is signiŽ cant at the .01 level (two-tailed).
unemployment during deprivation latent Reducing
23

24 Lea Waters and Kathleen Moore
Table 3. Model indicators for scales assessing latent deprivation, activity meaning, depressive affect and self-esteem using unemployed sample
|
|
|
|
|
|
|
|
Tucker– |
|
|
v2 |
d.f. |
p |
GFI |
AGFI |
IFI |
CFI |
Lewis |
RMSEA |
|
|
|
|
|
|
|
|
|
|
Latent deprivation |
5.84 |
4 |
.212 |
.989 |
.957 |
.994 |
.994 |
.914 |
.048 |
Activity meaning |
|
|
|
|
|
|
|
|
|
Solitary |
4.62 |
2 |
.099 |
.989 |
.943 |
.990 |
.990 |
.969 |
.081 |
Social |
0.86 |
1 |
.770 |
.966 |
.831 |
.956 |
.955 |
.865 |
.076 |
Depressive affect |
173.26 |
84 |
.000a |
.935 |
.907 |
.911 |
.909 |
.887 |
.073 |
Self-esteem |
10.87 |
7 |
.144 |
.974 |
.923 |
.963 |
.906 |
.914 |
.053 |
aSample sizes larger than 100 are likely to produce a false signiŽcance in the chi-square index. A ratio of v2 (<10) is therefore considered acceptable (Hair, Anderson, Tatham, & Black, 1995).
Figure 2. Unemployed sample: Ž nal model depicting the interrelationships between meaningful leisure activity, latent deprivation, depressive affect and self-esteem
suggested that there was a direct path from the meaning attained through social activities to depressive affect and from the meaning attained through solitary activities to time structure. The non-significant paths were progressively removed from the model and the paths between the meaning attained through social activities and depressive affect and the meaning attained through solitary activities and time structure were added to improve the fit of the model. The final model (c2(23)=32.516, p=.090; Goodness of Fit=.962; Adjusted Goodness of Fit=.925; IFI=.982; CFI=.981; Tucker–Lewis=.971; RMSEA=.046; P/CLOSE=.564) provided a good fit of the data to the model (Fig. 2). The final model for the unemployed sample revealed that social and solitary activities contributed to 11% of the variance in meaningful leisure activity. Time structure, shared experience, personal identity, collective purpose, enforced activity, and meaningful leisure activity contributed to 30%of the variance in perceived