

Beginning Algorithms (2006)
.pdfChapter 19
Following is the code for the sort() method. It accepts a list of words, using the comparator just defined, and a shell sort implementation to sort them. Finally, it simply prints out the sorted list of words one by one:
private static void sort(List wordList) {
assert wordList != null : “tree can’t be null”;
System.out.println(“Starting sort...”);
Comparator comparator = ReverseStringComparator.INSTANCE;
ListSorter sorter = new ShellsortListSorter(comparator);
List sorted = sorter.sort(wordList);
Iterator i = sorted.iterator(); i.first();
while (!i.isDone()) { System.out.println(i.current()); i.next();
}
}
The final method in our sample program is loadWords(), which simply drains standard input, adding each line to a List that is returned to the caller when no more input is available. The only issue here is that you need to catch any IOException that may arise:
private static List loadWords() throws IOException { List result = new LinkedList();
BufferedReader reader = new BufferedReader(new
InputStreamReader(System.in));
try {
String word;
while ((word = reader.readLine()) != null) { result.add(word);
}
} finally { reader.close();
}
return result;
}
If you compile and run the program, then you will need to direct it to read its input from a file, as shown by the following command line:
java com.wrox.algorithms.sorting.FileSortingHelper <words.txt
To run this command, you need to be in the directory that contains the compiled Java class files for the sample program. You also need to create or obtain a file called words.txt with a large number of lines of text in it. A quick Internet search for dictionary files will lead you to files with many thousands of words in them for this purpose. Appendix B contains the URL of the one we used when developing this book.
474

Pragmatic Optimization
On our Pentium 4 laptop, running this program with a file containing 10,000 words took about a minute, with the CPU running at 100 percent. This is much longer than we are prepared to wait, so some optimization is in order. Let’s take a look at what’s going on by profiling this program.
Profiling with hprof
The standard Sun Java virtual machine supports basic profiling out of the box. To determine whether your Java environment has this support, try the following command:
java -Xrunhprof:help
The -Xrun command-line option loads extra modules into the virtual machine when it starts. In this case, you’re running the hprof module. You’re also passing that module a command — in this case, help — to get some instructions on how to use it. The following listing shows the output from this command:
Hprof usage: -Xrunhprof[:help]|[:<option>=<value>, ...]
Option Name and Value |
Description |
Default |
--------------------- |
---------------------- |
------- |
heap=dump|sites|all |
heap profiling |
all |
cpu=samples|times|old |
CPU usage |
off |
monitor=y|n |
monitor contention |
n |
format=a|b |
ascii or binary output |
a |
file=<file> |
write data to file |
java.hprof(.txt for ascii) |
net=<host>:<port> |
send data over a socket |
write to file |
depth=<size> |
stack trace depth |
4 |
cutoff=<value> |
output cutoff point |
0.0001 |
lineno=y|n |
line number in traces? |
y |
thread=y|n |
thread in traces? |
n |
doe=y|n |
dump on exit? |
y |
gc_okay=y|n |
GC okay during sampling |
y |
Example: java -Xrunhprof:cpu=samples,file=log.txt,depth=3 FooClass
Note: format=b cannot be used with cpu=old|times
The preceding output shows that several different parameters can be passed to hprof to tailor its behavior. The parameter for this example is cpu=samples, which provides you with sample-based profiling of your application. The following command uses this profiling option on our sample application, and redirects both input and output to files in the current directory:
java -Xrunhprof:cpu=samples com.wrox.algorithms.sorting.FileSortingHelper <words.txt >sorted.txt
When you run the program with profiling turned on, it will run noticeably slower than before, but that is understandable because quite a bit of work is required to collect the statistics. All profilers have a big impact on performance, but the idea is that the relative measures of time spent in various parts of the program will be quite accurate.
After the program finishes, you will see the following message:
Dumping CPU usage by sampling running threads ... done.
475

Chapter 19
Although it doesn’t tell you, this has created a file in the working directory called java.hprof.txt that contains the information gathered during profiling. If you open this file in a text editor, then you will see contents like the following (after some boilerplate text at the top of the file):
THREAD START (obj=2b76bc0, id = 1, name=”Finalizer”, group=”system”)
THREAD START (obj=2b76cc8, id = 2, name=”Reference Handler”, group=”system”) THREAD START (obj=2b76da8, id = 3, name=”main”, group=”main”)
THREAD START (obj=2b79bc0, id = 4, name=”HPROF CPU profiler”, group=”system”)
...
This gives you information about the threads that were running in the virtual machine. As you can see, hprof creates a thread of its own to do its work. After the thread information, you will see a series of small Java stack traces like the following:
TRACE 23: java.lang.StringBuffer.<init>(<Unknown>:Unknown line) java.lang.StringBuffer.<init>(<Unknown>:Unknown line)
com.wrox.algorithms.sorting.ReverseStringComparator.reverse
(ReverseStringComparator.java:48)
com.wrox.algorithms.sorting.ReverseStringComparator.compare
(ReverseStringComparator.java:44)
TRACE 21: com.wrox.algorithms.sorting.ReverseStringComparator.reverse
(ReverseStringComparator.java:51)
com.wrox.algorithms.sorting.ReverseStringComparator.compare
(ReverseStringComparator.java:44)
com.wrox.algorithms.sorting.ShellsortListSorter.sortSublist
(ShellsortListSorter.java:79)
com.wrox.algorithms.sorting.ShellsortListSorter.hSort
(ShellsortListSorter.java:69)
You will see many of these stack traces occupying the bulk of the contents of the output file. They are simply all the different stack contents encountered during the sampling effort. The idea is that each time a sample is taken, hprof looks at the top of the stack to determine whether that combination of method calls has been encountered before. If so, the statistics are updated, but another TRACE record is not created. The number after TRACE (for example, TRACE 21 above) is simply an identifier that is used farther down in the profiling output, as you will see shortly.
The final section of the output is the most interesting because it indicates where the program is spending most of its time. Here are the first few lines of the final section:
CPU SAMPLES |
BEGIN (total = |
1100) |
Wed Jun 22 21:54:20 2005 |
||
rank |
self |
accum |
count |
trace |
method |
1 |
29.55% |
29.55% |
325 |
16 |
ReverseStringComparator.reverse |
2 |
17.18% |
46.73% |
189 |
15 |
LinkedList.getElementBackwards |
3 |
16.00% |
62.73% |
176 |
18 |
LinkedList.getElementForwards |
4 |
13.09% |
75.82% |
144 |
17 |
LinkedList.getElementBackwards |
5 |
11.55% |
87.36% |
127 |
14 |
LinkedList.getElementForwards |
6 |
2.55% |
89.91% |
28 |
19 |
LinkedList.getElementBackwards |
7 |
2.09% |
92.00% |
23 |
29 |
LinkedList.getElementBackwards |
8 |
1.91% |
93.91% |
21 |
24 |
LinkedList.getElementForwards |
... |
|
|
|
|
|
476

Pragmatic Optimization
The most important columns here are the self and accum columns, as well as the final column that identifies which method is being described by each row. The self column indicates the percentage of execution time spent in the method itself, while the accum column defines the percentage of time spent in that method and all methods called by it. As you can see, this list is ordered by the self column in descending order, on the assumption that you are most interested in finding out which individual method is consuming the most time. The trace column is the identifying number that enables you to refer back to the trace section of the file to see more detail about the execution stack for the method in question.
Before trying to improve this situation, you’ll first try profiling the same program with the Java Memory Profiler.
Profiling with JMP
The Java Memory Profiler is a free tool that you can download from the following URL:
http://www.khelekore.org/jmp/
The JMP comes with great documentation to get you started, so you’ll need to follow the instructions carefully. Bear in mind that the JMP is not itself a Java program, so the installation may not be familiar to you if Java is your main programming environment. For example, on a Windows system, you need to copy a DLL into your Windows system directory to get it going.
To determine whether you have the JMP installed correctly, the test is very similar to the hprof example in the preceding section. Type the following at the command line:
java -Xrunjmp:help
This will ask the JMP to give you some instructions on its use, as shown here:
jmp/jmp/0.47-win initializing: (help):...
help wanted..
java -Xrunjmp[:[options]] package.Class
options is a comma separated list and may include:
help |
- to show this text. |
||
nomethods |
- to disable |
method |
profiling. |
noobjects |
- to disable |
object |
profiling. |
nomonitors - to disable monitor profiling.
allocfollowsfilter - to group object allocations into filtered methods.
nogui |
- |
to |
run jmp without the user interface. |
dodump |
- |
to |
allow to be called with signals. |
dumpdir=<directoryr> - to specify where the dump-/heapdumpfiles go. dumptimer=<n> - to specify automatic dump every n:th second. filter=<somefilter> - to specify an initial recursive filter. threadtime - to specify that timing of methods and monitors
should use thread cpu time instead of absolute time. simulator - to specify that jmp should not perform any jni tricks.
probably only useful if you debug jmp.
An example may look like this:
java -Xrunjmp:nomethods,dumpdir=/tmp/jmpdump/ rabbit.proxy.Proxy
477
Chapter 19
As you can see, the JMP has many options that you can use to tailor its behavior. For our purposes, we’ll simply use the default configuration and run it against our sample program with the following command line:
java -Xrunjmp com.wrox.algorithms.sorting.FileSortingHelper <words.txt >sorted.txt
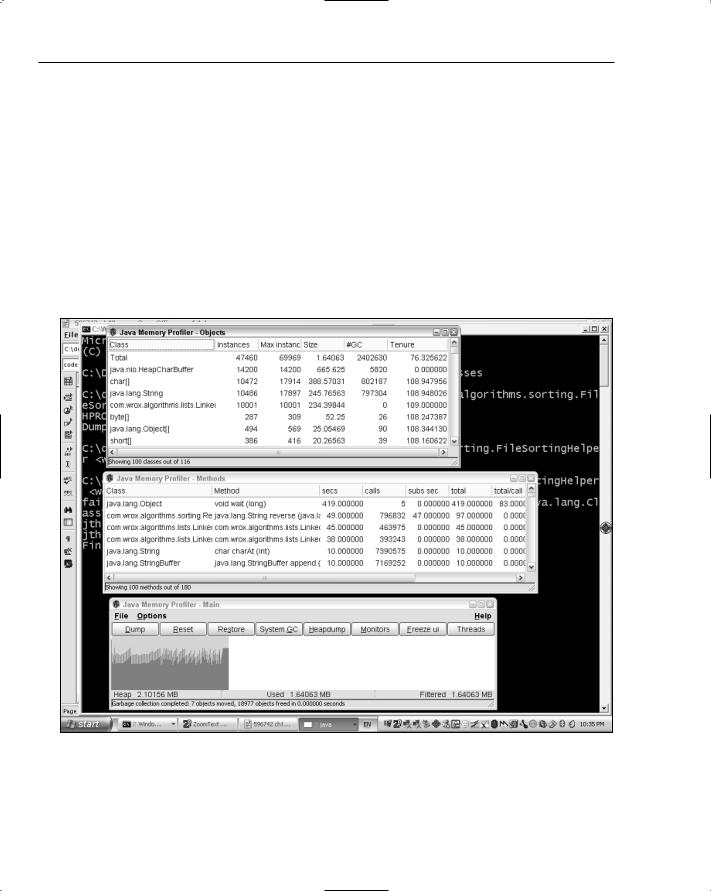
Three windows will appear with statistics, as shown in Figure 19-1.
The main JMP window (shown at the bottom of Figure 19-1) provides a graphical view of the memory being used by the running application. This shows two values changing over time: the total heap size allocated to the virtual machine, and the amount that is currently allocated for object use. You can see from the fluctuating shape of the graph that the amount of memory being used changes constantly as objects are created and garbage is collected. If the amount of memory needed exceeds the current total heap size allocated to the virtual machine, more will be requested from the operating system and the extra space will be used to store more objects.
Figure 19-1: JMP windows during profiling.
478

Pragmatic Optimization
The JMP Objects window, shown at the top of Figure 19-1, lists many interesting statistics about the instances in the virtual machine. The first column shows the class name, followed by the current number of instances of the class, the maximum number of instances that have been active at any point during the running of the program, the amount of memory used by the current instances, and the number of instances that have been garbage collected during the execution. This is a column you’ll have some interest in when you optimize this program shortly.
The JMP Methods window, shown in the middle of Figure 19-1, contains statistics about the methods called during the program’s execution, such as the class and method name, the number of calls, how long those calls took (in seconds), and how long the methods called by the method took (in seconds).
This information will also prove extremely useful when you attempt to speed up the sample program.
Understanding Optimization
Before you attempt to optimize a program, be aware that if you have chosen the wrong algorithm, you will be absolutely wasting your time attempting to optimize it. For example, if you are wondering why a sorting program is slow when sorting a million records using a bubble sort, don’t turn to optimization for the answer. No amount of tweaking will change the fact that an O(N2) algorithm on a large data set is going to give you plenty of time to go for a coffee while it’s running. You could probably have lunch as well. This is why optimization is not the first chapter of this book; it really is not as important as you might think. We’ll assume for the rest of this chapter that you have chosen the most appropriate algorithm for your purposes and that you just need to get the most out of it with your optimization efforts.
Another good way to waste time is to optimize a part of your program that is not a bottleneck on its performance. That may sound obvious, but it is extremely common for developers to twist themselves into knots to create a faster version of some code that is rarely called, or is called only at application startup, for example. These efforts inevitably result in code that is harder to understand and harder to maintain, and contributes nothing to the overall performance of the application, even though it runs faster than it previously did.
If you only remember one thing from this chapter, remember this: Don’t guess why your program is slow. Find out the facts about its performance via profiling or some other means, so that you can take a targeted approach to improving it. Our recommended approach to program optimization is as follows:
1.Measure the performance of your program with a profiler.
2.Identify the significant contributors to the performance problem.
3.Fix one of the problems, preferably the most significant, but go for an easier one if it is also significant.
4.Measure the performance again.
5.Ensure that the change effected the desired result. If not, undo the change.
6.Repeat these steps until the benefits are no longer worth the effort or the performance is acceptable.
There is really no mystery to this method. It is simply a targeted approach based on some hard facts, ensuring that each change you make has a measurable benefit. The next section uses this technique to optimize our sample program.
479
Chapter 19
Putting Optimization into Practice
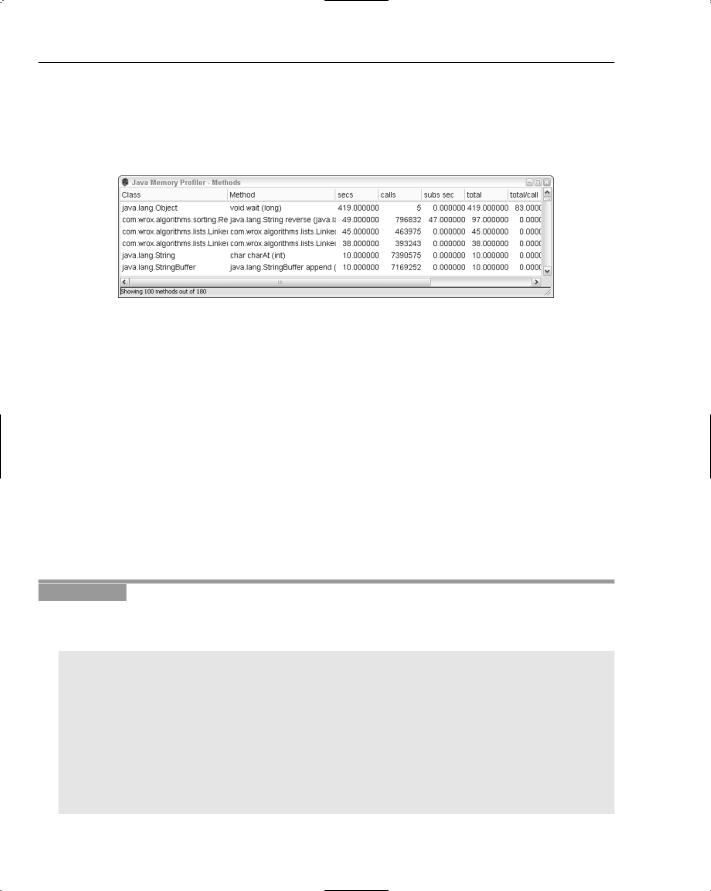
You’ve already profiled the sample application using the JMP, and now you’re interested in why it is so slow. Take a closer look at the JMP Methods window shown in Figure 19-2 to see where all the time is going.
Figure 19-2: The JMP Methods window.
You’ll notice that you’re spending a lot of time reversing String objects, and you’re spending a lot of time doing LinkedList manipulations as well. (You can ignore the top item in this list because that’s just the time you spent looking at the screen before you pressed Ctrl+C to kill the application.)
So what do you do? You could try to figure out a more efficient way of reversing String objects, but it seems easier to deal with the LinkedList issue for now. You initially used a LinkedList, as you didn’t know how many words were going to be coming in as input, but you knew it would be a lot, so you thought adding them to the back of a LinkedList would be the way to go. However, now you recall that the sorting needs a lot of index-based access to items in the list, and that’s where you seem to be losing out according to the profiler. If you look at the calls column in Figure 19-2, you’ll see that the two LinkedList operations are being called several hundred thousand times, with only ten thousand words to sort. This leads to the conclusion that you made the wrong choice of data structure here; building the initial list will only involve ten thousand calls to add(), so you should choose the data structure that supports the operations you need most. In this case, that’s index-based access to items after the list has been built, so you need to use an ArrayList instead.
Try It Out |
Implementing an ArrayList |
It’s extremely simple to replace the LinkedList with an ArrayList in the loadWords() method of our sample FileSortingHelper, as shown here:
private static List loadWords() throws IOException {
List result = new ArrayList();
BufferedReader reader = new BufferedReader(new InputStreamReader (System.in));
try {
String word;
while ((word = reader.readLine()) != null) { result.add(word);
}
480
Pragmatic Optimization
} finally { reader.close();
}
return result;
}
The next step is to recompile the program and profile it again with the following command:
java -Xrunjmp com.wrox.algorithms.sorting.FileSortingHelper <words.txt >sorted.txt
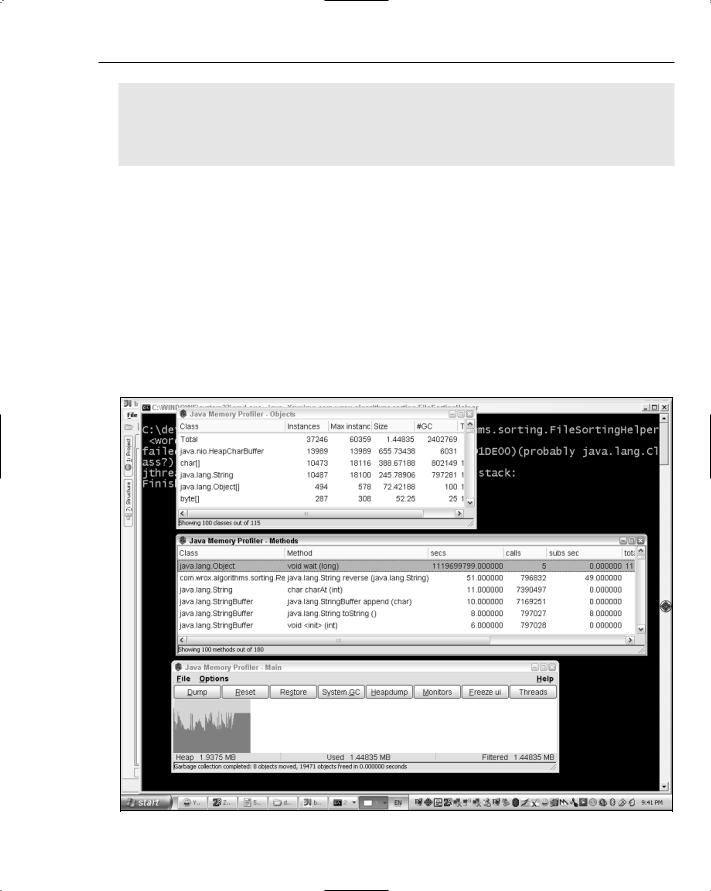
This time, the JMP profiler produces the results shown in Figure 19-3.
How It Works
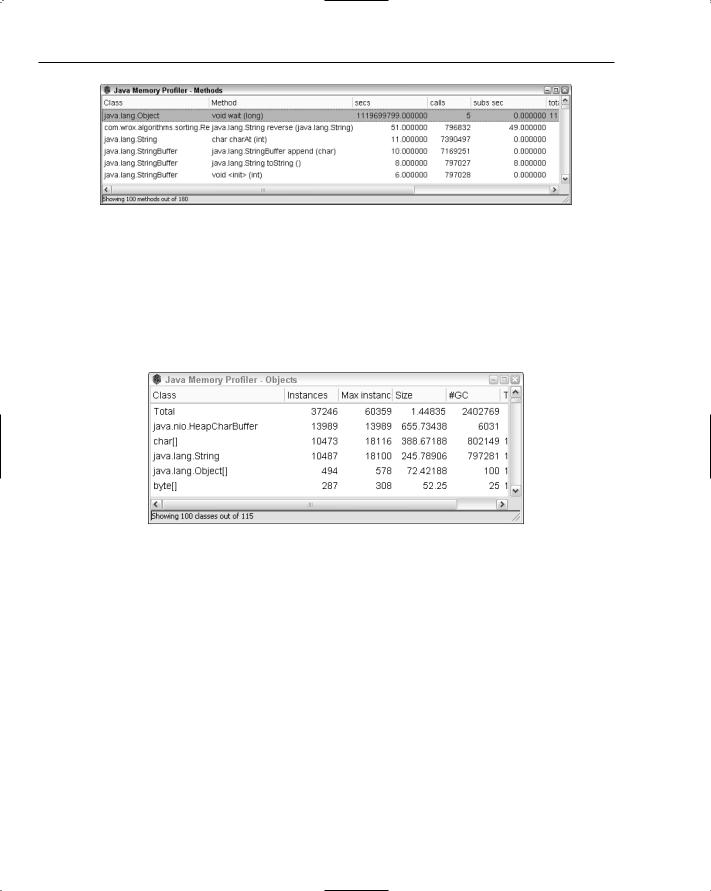
Take a closer look at the JMP Methods window again, as shown in Figure 19-4.
There’s no sign of the LinkedList anymore, and, just as important, there’s no sign of the ArrayList you just added. Although it often happens that a change you make will just move the problem, or even make it worse, that isn’t the case here. However, this is why it is so important to measure after each change you make to ensure that your optimization efforts are moving you forward.
Figure 19-3: Profiling after switching to an ArrayList.
481
Chapter 19
Figure 19-4: The JMP Methods window with the ArrayList implementation.
Notice in Figure 19-4 that the reverse() method in the ReverseStringComparator is taking 51 seconds, while the next largest method only takes 11 seconds. It’s time to think about all this String reversing business if you’re going to make the next big step forward. Take a look at how many times the reverse() method is called — almost 800,000 times! This is important information. If it took 51 seconds and was only called once, that would mean it was a fairly poorly written method indeed. As it is, it’s more of an issue that it’s being called so often. The situation is made even clearer by the JMP Objects window, shown in Figure 19-5.
Figure 19-5: The JMP Objects window.
Look at the #GC column, which indicates how many objects of the given class were garbage collected during the program execution. The total shows almost 2.5 million objects were garbage collected. Surely that’s ridiculous given that you only created one list with ten thousand words in it, wouldn’t you think?
The clue is the number of String objects that are garbage collected. It’s also around 800,000, about the same number of calls to the reverse() method in the Methods window. You can now feel confident that the issue is caused by the fact that you are reversing the String objects you are comparing every time pairs of String objects are evaluated during the sorting process. Given that each String will be involved in multiple pairwise comparisons, you’re reversing the same String objects repeatedly, creating new String objects each time and spinning off thousands of objects for garbage collection. There must be a better way to do this.
If you have 10,000 input words, you could reduce the amount of work the program is doing by only reversing each String once. If you reversed them before putting them into the list for sorting, you would not even need our ReverseStringComparator at all! You could just use a natural comparator on the reversed String objects. This would eliminate all the tedious work being done during the current
482

Pragmatic Optimization
sorting routine, and drastically reduce the number of temporary objects you create. At least we think so; you’ll have to try it and measure it, of course.
There will be the problem of printing out the sorted list at the end of the sorting process; you’ll have to reverse all the String objects again to put them back into their original correct character sequences; otherwise, the output won’t be what the user expects. That will be another 10,000 reverse operations, but even so, it should be a lot more effective than what you have now. Again, you won’t know until you make the change and measure its effect.
Try It Out |
Optimizing the FileSortingHelper |
Our FileSortingHelper is going to have to change a little, so you create a new class in our sample code base called OptimizedFileSortingHelper to keep the two different implementations available for quick reference. The start of the OptimizedFileSortingHelper class is shown here:
package com.wrox.algorithms.sorting;
import com.wrox.algorithms.iteration.Iterator; import com.wrox.algorithms.lists.ArrayList; import com.wrox.algorithms.lists.List;
import java.io.BufferedReader; import java.io.IOException;
import java.io.InputStreamReader;
public final class OptimizedFileSortingHelper {
private OptimizedFileSortingHelper() {
}
...
}
Like the FileSortingHelper, this optimized version has a private constructor to prevent it from being inadvertently instantiated by other programs. The main() method is shown below:
public static void main(String[] args) throws Exception { List words = loadWords();
reverseAll(words);
System.out.println(“Starting sort...”);
Comparator comparator = NaturalComparator.INSTANCE;
ListSorter sorter = new ShellsortListSorter(comparator);
List sorted = sorter.sort(words); reverseAll(sorted); printAll(sorted);
System.err.println(“Finished...press CTRL-C to exit”);
Thread.sleep(100000);
}
483