482 You Say Printing, We Say Plotting, They Say Publishing
Clicking Next advances the wizard to the next page, which is different depending on which of the three options you selected. In this example, we use the My Computer option because going through it covers the most steps in the wizard.
5.On the Plotter Model page, select a manufacturer from the list on the left and then one of the available models from the list on the right. Click Next.
Based on the selected manufacturer, you might have a list of models for a physical device or a virtual device. A physical device would be in the form of a plotter, whereas a virtual device allows you to take the output from AutoCAD and convert it into a specific format of electronic file. Clicking Next advances the wizard to the next page.
6.On the Import PCP or PC2 page, click the Import File button if you have a .PCP or .PC2 file available to you. Click Next.
.PCP files were the very first plotter configuration files that AutoCAD used and were created with AutoCAD R13 and earlier versions. .PC2 files were the second generation of the plotter configuration file type and were created with AutoCAD R14.
7.If you click Import File, the Import dialog box is displayed and allows you to browse to and select a .PCP or .PC2 file that was exported out of an earlier release. After you have selected the file, click Open.
You might see a warning message about paper sizes not matching between the device you are configuring and the device that is contained in the .PCP or .PC2 file. Click OK to the warning message. The Imported Data Information message should be displayed after the warning message (if one was displayed). The Imported Data Information message displays the settings that have been imported for the plotter that you are configuring. Click OK to close the Imported Data Information dialog box, and you return to the Add Plotter Wizard.
8.In the Add Plotter Wizard on the Ports page, select one of the three types of ports to be used for the plotter, and select a port from the list based on the port option selected.
The page allows you to choose from three different types of ports:
•Plot to Port: Allows for the output to be sent to a location such as LPT1 or a UNC path. This option depends on whether you are specifying a physical or virtual device.
•Plot to File: Specifies that the output will be created as an electronic file that can then be viewed or sent to a graphics/print shop for printing.
•AutoSpool: Specifies that the output should be sent to an application that determines how to route the output file. The program used for AutoSpool is specified on the Files tab of the Options dialog box under Print File, Spooler, Prolog Section Names, Print Spool Executable. An
You Say Printing, We Say Plotting, They Say Publishing 483
AutoSpool program can be used to log plots or even redirect output based on paper size.
Click Next to advance the wizard to the next page.
9.On the Plotter Name page, enter a name in the Plotter Name text box. Click Next.
The name entered is displayed in the lists that allow you to specify an output device in AutoCAD, and is also used for the name of the PC3 file that is created when the wizard is finished. Click Next to advance the wizard to the next page.
10.On the Finish page, click Edit Plotter Configuration or Calibrate Plotter to further configure the new device. Click Finish.
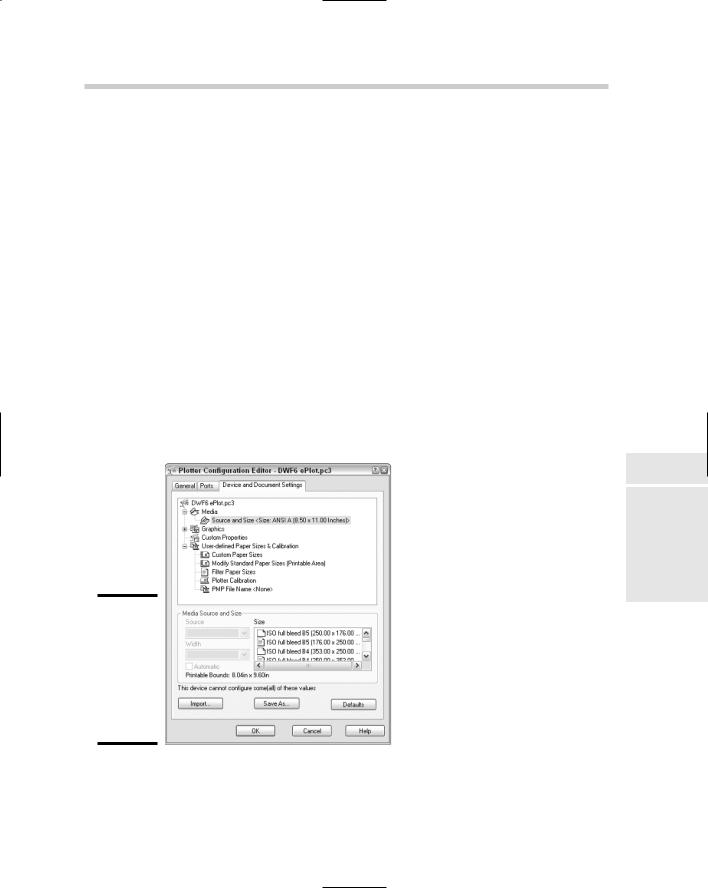
Based on the device you are configuring, the Calibrate Plotter button might be disabled. The Calibrate Plotter button allows you to verify drawing measurements that the device can handle. The Edit Plotter Configuration button launches the Plotter Configuration Editor dialog box (see Figure 3-3) and allows you to specify custom paper sizes and other device specific settings. Make any necessary changes in the Plotter Configuration Editor dialog box, and click OK to save changes and close the dialog box.
Book VII
Chapter 3
Print,Publish
Plot,
Figure 3-3:
The Plotter Configuration Editor enables you to tweak custom settings of the plotter.
In the Plotters window, the new device is added and ready for use in
AutoCAD.
11. Click the X on the Plotters window to close it.
484 You Say Printing, We Say Plotting, They Say Publishing
Editing a non-system printer configuration
At times, you may want to edit a non-system printer configuration in order to add or remove available paper sizes, along with options such as line merge and others. The following procedure explains how to modify a plotter configuration (.PC3) file for a non-system printer.
1.Use one of the previously listed methods to open the Plotter Manager.
2.In the Plotters window, double-click the plotter configuration (PC3) file you want to edit.
The Plotter Configuration Editor dialog box is displayed.
3.In the Plotter Configuration Editor dialog box, make the necessary changes and click Save & Close.
The changes are saved to the .PC3 file.
4.Click the X on the Plotters window to close it.
Putting style in your plots
AutoCAD uses plot styles to control the output of objects in a drawing. Plot styles can be used to control lineweight and even the color in which objects are plotted. Most printers/plotters in offices today are capable of outputting in grayscale, whereas some may even support color. Even though AutoCAD drawings are displayed and created in color, you can use plot styles to control whether that is the same with the final output. Plot styles can be used to map colors to grayscale colors or even to a different color altogether.
AutoCAD supports two different plot styles, color-dependent and named. Colordependent plot styles are the most commonly used of the two and represent how plotting was handled before the introduction of plot styles in AutoCAD 2000. Color-dependent plot styles allow you to map specific AutoCAD colors to different lineweights and even to different colors. When you create a new drawing, the drawing template determines the type of plot style used when plotting.
You can switch between a drawing using color-dependent or named plot styles. You use the command CONVERTPSTYLES to toggle a drawing between the two plot styles.
Named plot styles are the newest of the two plotting methods. Named plot styles allow you to create a name and assign that name a specific lineweight and color. This allows you to display multiple colors on-screen but use one plot style for multiple layers and colors. Named plot styles do have limitations, unlike color-dependent plot styles. Named plot styles are not supported well
486 You Say Printing, We Say Plotting, They Say Publishing
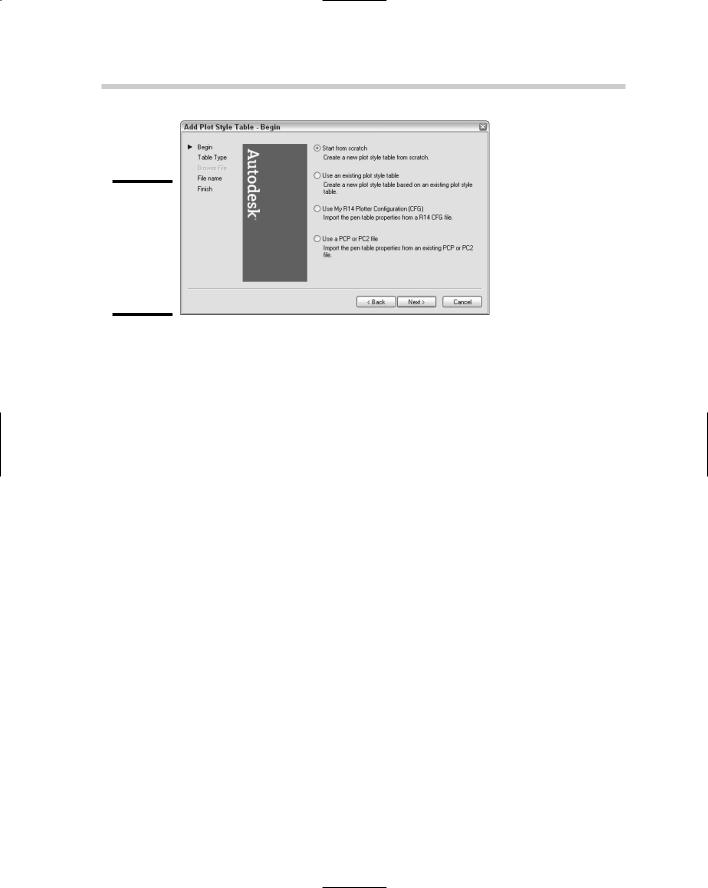
Figure 3-4:
The Add Plot Style Table Wizard is used to create a plot style.
4.On the Begin page, select one of the four different methods for configuring a plot style. Click Next.
The page allows you to choose from four different methods for configuring a plot style:
•Start from Scratch. Use this option if you are not upgrading from a release prior to AutoCAD 2000, or if you don’t want to base the new plot style on an existing style.
•Use an Existing Plot Style Table. If you have an existing plot style that is close to the one you want to configure, use the existing one as a template for the new plot style.
•Use My R14 Plotter Configuration (.CFG). Pen tables, as they once were called in AutoCAD R14, were stored in a configuration (.CFG) file. If you have one of these files around, you can import the pen information into the wizard for the new plot style.
•Use a .PCP or .PC2 File. AutoCAD 14 and earlier versions allowed you to export your plot device configuration and pen table to a single configuration file that could be shared with other computers. The pen table contained in these files can be imported into the wizard for the new plot style.
Clicking Next advances the wizard to the next page, which is different based on which of the four options you selected. This procedure uses the Start from Scratch option.
5.On the Pick Plot Style Table page, select either Color-Dependent Plot Style Table or Named Plot Style Table option. Click Next.
6.Select either the Color-Dependent or Named Plot Style Table option, based on the type your drawings use. Clicking Next advances the wizard to the next page. In these instructions, we use the colordependent option because it is the most commonly used plot style.
You Say Printing, We Say Plotting, They Say Publishing 487
7.On the File name page, enter a name in the File name text box. Click Next.
The name entered is the one that is displayed in the list of plot styles within AutoCAD and is also used for the name of the .CTB or .STB file that is created when the wizard is finished. Clicking Next advances the wizard to the next page.
8.On the Finish page, click the Plot Style Table Editor button to configure lineweights, colors, and other settings for the new plot style. Click Finish.
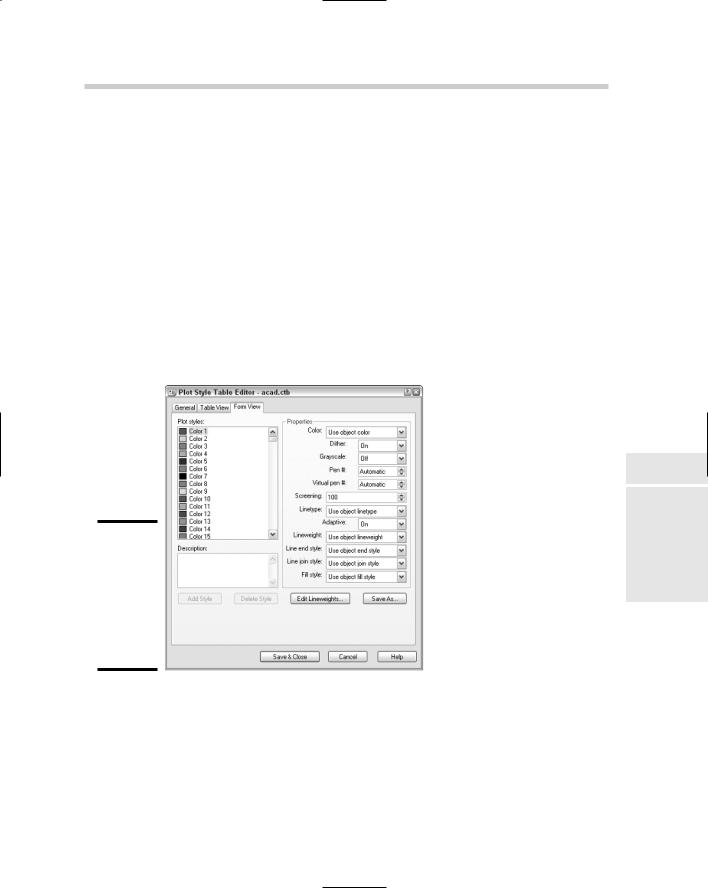
9.Based on the type of plot style created, the options in the Plot Style Table Editor dialog box (see Figure 3-5) differ. Make any necessary changes in the dialog box.
The Plot Style Table Editor dialog box is displayed and allows you to define how the linework will look when it is plotted.
Book VII
Chapter 3
Figure 3-5:
The Plot Style Table Editor enables you to tweak settings for the plot style table.
10.In the Plot Style Table Editor dialog box, select the color or named plot style from the Plot Styles list box on the Form View tab. Then modify the properties based on how you want the linework assigned to the plot style to appear when plotted.
Based on the plot style you are creating, you might want to assign a lineweight or linetype property that will override the values assigned to the objects in a drawing when it is plotted.

11.Click Save & Close.
The changes to the plot style are saved, and the new plot style is added to the Plot Style window and is ready to use in AutoCAD.
12.Click the X on the Plot Styles window to close it.
Editing a plot style
As your standards change, you need to make some changes based on the colors that are used in your drawing or the lineweights used during output. The following procedure explains how to modify a plot style file.
1.Use one of the previously listed methods to open the Plot Style Manager.
2.In the Plot Styles window, double-click the Plot Style (.CTB or .STB) file you want to edit.
The Plot Style Table Editor dialog box is displayed.
3.In the Plot Style Table Editor dialog box, make the necessary changes and click Save & Close.
The changes are saved to the .CTB or .STB file.
4.Click the X on the Plot Styles window to close it.
Outputting Made Easy
Plotting is not as easy as creating a line, for instance, in AutoCAD, and this is mainly due to the number of options that are available. Over the years, the plotting process (after you have defined your plot configurations and plot styles) has been streamlined, but there are still a number of things you have to know before you can plot. This section helps get you on the fast track to understanding plotting by taking you step-by-step through the process. Depending on whether you are plotting from the Model tab or a paper space layout, the general process is the same, but some options are slightly different.
To plot out the Model tab or a paper space layout, you use the PLOT command. (You don’t use the PRINT command, but those folks at Autodesk did create a command alias so you can type in PRINT at the command line or at the dynamic input tooltip.) To start the PLOT command, use one of the following methods:
File menu: Click File Plot.
Standard toolbar: Click the Plot button on the Standard toolbar.
Outputting Made Easy 489
Shortcut key: Press the key combination CTRL+P.
Keyboard input: Type PLOT and press Enter.
Right-click the Model tab or a paper space layout: From the shortcut menu, select Plot.
Plotting the Model tab
The following procedure takes you step-by-step through the basics of plotting the Model tab of a drawing:
1.Click the Model tab at the bottom of the drawing window.
2.Use one of the previously listed methods to open the Plot dialog box.
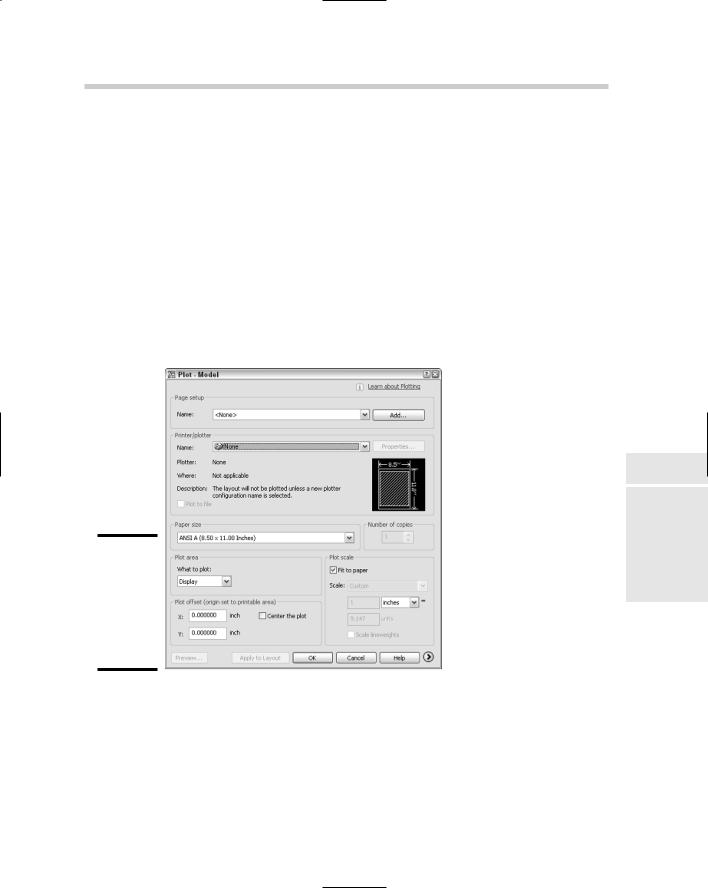
The Plot dialog box (see Figure 3-6) is displayed.
Book VII
Chapter 3
Figure 3-6:
The Plot dialog box is the gateway to outputting your drawing.
3.In the Plot dialog box, if a named page setup is contained in your drawing, select it from the Name drop-down list under the Page Setup heading and skip to Step 10. If you don’t have a named page setup, continue on with the next step.
A page setup saves you the time of having to specify the printer/plotter, paper size, what to plot, scale, and other settings. Page setups were covered in Book VII, Chapter 1.

4.In the Printer/Plotter area, select a printer from the Name drop-down list.
The drop-down list contains both the system and non-system printers, unless the Hide System Devices option is selected from the Plot and Publish tab of the Options dialog box.
5.In the Paper Size area, select the paper size that your output will best fit on for the area that is to be plotted and the designated scale.
The drop-down list contains all the available paper sizes that the device can output to. If you are using a .PC3 file, you can add or remove paper sizes from the list through the Plotter Configuration Editor dialog box.
For more information, see the section “Editing a non-system printer configuration” in this chapter.
6.In the Number of Copies area, enter the number of copies you want to produce.
This option is disabled if the selected device outputs to a file.
7.Under the Plot Area heading, select what you want to plot in the drawing — often, you select Extents when plotting the Model tab.
The drop-down list contains a number of options to select from. These options include
•Display: Outputs the objects in the current view of the drawing.
•View: Allows you to specify a named view that is saved in the drawing to output.
•Window: Allows you to specify a rectangular area in the drawing that should be output by picking two points in the drawing. What is displayed inside the selected area is what is outputted.
•Limits (Model Tab Only): If you have set up limits in your drawing properly, you can use this option to specify the objects that are displayed within this area.
•Extents: The extents of the drawing are calculated and are used to print all the objects contained in the drawing.
8.In the Plot Offset area, either specify an X and a Y offset from the edge of the printable area or select the Center the Plot check box.
The option that you selected in the Plot Area determines whether the Center the Plot check box is enabled.
9.In the Plot Scale area, either specify the print area to be fit on the specified paper size by checking Fit to Paper, or uncheck Fit to Paper and specify a scale (by selecting a standard scale from the drop-down list or entering a number in the text boxes for a custom scale).
During production, you specify a specific scale for all your drawings. You might choose Fit to Paper if you are doing conceptual designs and are