

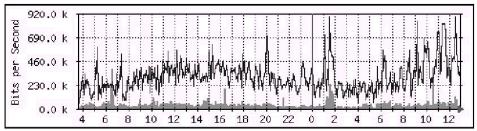
Figure 19−1: Sample MRTG graph
Get MRTG measuring traffic on one of your machines, and then we'll measure some other interesting things by choosing our SNMP MIBs.
Tracking Other System Values
By default, MRTG measures network traffic, but you can use it to measure any information available via SNMP. All you need are the MIBs for the information you want to measure. To make MRTG monitor these MIBs instead of network traffic, add them to the Target entry like so:
...............................................................................................
Target[label]:mibnumber1&mibnumber2:GetLostLoser@localhost
...............................................................................................
For example, to measure system CPU time (MIB .1.3.6.1.4.1.2021.11.9.0) and user CPU time (MIB .1.3.6.1.4.1.2021.11.10.0), use this line:
...............................................................................................
Target[cpu]:1.3.6.1.4.1.2021.11.9.0&1.3.6.1.4.1.2021.11.10.0.:GetLostLoser@localhost
...............................................................................................
Remember, MRTG charts MIBs in pairs, so pick values to monitor accordingly. Sensible choices are things like "available swap and total swap" or "system CPU usage and user CPU usage." Measuring combinations such as available swap versus the percentage of disk available would give you difficult−to−understand charts.
How do we know which MIBs to use? Well, digging through the snmpwalk output, and translating the system and user CPU times (enterprises.ucdavis.systemStats.ssCpuUser.0 and enterprises.ucdavis.systemStats.ssCpuSystem.0, respectively), we find that they translate to .1.3.6.1.4.1.2021.11.9.0 and .1.3.6.1.4.1.2021.11.10.0. You don't want to go digging through the MIB tree to find this sort of thing, however, so I'll make it a little easier for you.
Useful Net−snmp MIBs
Here are some net−snmp MIBs worth monitoring by name, with their corresponding numerical values in parentheses. All of these can be found under .1.3.6.1.4.1.2021. For example, the M e m o r y . M e m T o t a l S w a p M I B c a n b e d e t e r m i n e d b y q u e r y i n g
1.3.6.1.4.1.2021.Memory.MemTotalSwap.
Note Before using any MIB, be sure to test it at snmpwalk. Each query should return a single line. If it returns multiple lines, there's probably an index on the end of it that you should include before entering that MIB in MRTG.
445
Without further ado, here are some useful MIBs:
memory.memTotalSwap (4.3) |
The total swap on the system. Check this value |
|
before assigning limits involving swap in other |
|
MRTG graphs. |
memory.memAvailSwap (4.4) |
The amount of swap remaining. |
memory.memTotalReal (4.5) |
The total memory actually available on the system. |
|
While you don't need to monitor this value (after all, |
|
the RAM in a system rarely changes), you should |
|
check it before setting limits in MRTG. |
memory.memAvailReal (4.6) memory.memBuffer (4.14) memory.memCached (4.15) dskTable.dskEntry.dskTotal (9.1.6)
dskTable.dskEntry.dskAvail (9.1.7)
dskTable.dskEntry.dskPercent
(9.1.9) systemStats.ssCpuUser (11.9)
The amount of unused real memory.
The amount of memory in the system buffer.
The amount of memory in the system cache.
The total size of a partition. Like the other totals, this is just for reference. This MIB will almost certainly have indexes.
The amount of space remaining on the disk, in blocks.
The percentage of the disk in use.
The percentage of the CPU time spent in non−kernel programs.
systemStats.ssCpuSystem (11.10) |
The percentage of CPU time spent running the |
|
kernel. |
There are many, many more MIBs you could monitor, and entire books have been written about SNMP and monitoring. Still, these select few should cover the basic system services, and give you those important pretty pictures for your staff meeting.
Monitoring a Single MIB
Although MRTG is designed to monitor things in pairs, you can monitor a single MIB by listing it twice:
...............................................................................................
Target[localhost.memAvail]:.1.3.6.1.4.1.2021.4.6.0&.1.3.6.1.4.1.2021.4.6.0:GetLostLo
ser@localhost
...............................................................................................
This will work just fine to show only one MIB on the MRTG graph.
Note Be sure to pick a separate label for the target, and use it for all configuration statements for that target. If you don't, MRTG will either complain or overwrite the log files from other targets.
446
Customizing MRTG
Once you have a working MRTG setup, be careful testing new configurations. I generally test a new MRTG configuration in a separate WorkDir, so that any mis−configurations won't damage existing log files or production status pages.
The mrtg.cfg file contains a wide variety of options that allows you to customize almost every aspect of MRTG's appearance and functionality. Here you'll find some of the most useful MRTG configuration options, and how they can be used in production environments.
WithPeak[label]: wmy
MRTG's log format condenses older entries into average values, which tends to decrease values over time. The WithPeak option forces MRTG to keep and graph the maximum values over time. While your graphs will be more complex as a result, they will contain more useful information. This option can be set for the weekly, monthly, and yearly graphs, or a combination.
MaxBytes[label]: number
This is the maximum value that a MIB can reach. (The label is misleading if the MIB doesn't measure bytes.) MRTG uses this value to decide if it got a sensible answer from the device.
Both MIBs being measured use MaxBytes, so be sure you're measuring sensible pairs! If you're doing something particularly weird and need different MaxBytes variables, use MaxBytes1 and
MaxBytes2.
YLegend[label]: text
MRTG will put this text along the side of the graph. Put whatever you're measuring here, such as "% CPU Time".
LegendI[label] & LegendO[label]: text
MRTG always measures two MIBs. The first MIB is the traditional "In" value, and the second the "Out". You can put short descriptions of what you're measuring here to have them appear beneath the graph.
Legend1[label] & Legend2[label]: text
Legend1 is the label for the first MIB you measure; Legend2, the second. Both will appear at the bottom of your chart, in the key.
Legend3[label] & Legend4[label]: text
These labels will be used if you're recording maximums (with the WithPeak option). If you're not recording maximums, these labels will have no effect.
Directory[label]: directoryname
Large MRTG setups can generate a lot of files. The directory keyword allows you to put the files for a particular label in a subdirectory of the WorkDir.
447
Options[label]: option−names
Options allow you to handle special cases. All options are specified on one line, after the target. Some good examples follow:
growright |
By default, MRTG draws graphs from right to left. Use this option to make it draw |
|
graphs from left to right. |
bits |
This changes the graphs from measuring bytes to bits. Bits are not only more |
|
impressive, but they may also be more accurate, depending on what you're |
|
measuring. For example, many people measure bandwidth in bits, not kilobytes. |
gauge |
SNMP generally retains information in counter form. MRTG subtracts the previous |
|
reading from the current reading to get the change in the last five minutes. Use the |
|
gauge option for SNMP MIBs that don't change, such as disk capacity. |
unknaszero When a target is not reachable for any reason (including power failure or network problems), the system will assume the last known value for the charts. Whether or not this is more accurate is a matter of some controversy. This option causes MRTG to assume a value of zero when it cannot reach a target.
MRTG Index Page
The last bit of configuration we'll need to do is to create a single HTML index page for our MRTG setup. MRTG includes an indexmaker tool that automagically does this for us. Just run this:
...............................................................................................
# indexmaker mrtg.cfg > index.html
...............................................................................................
You'll probably want to edit this, but it's a nice starting place.
Sample MRTG Configurations
This section contains some sample MRTG configurations. To use them, insert the correct hostname and community name. Also, note that the Target statements are supposed to be all on one line; the printed page simply isn't wide enough to handle this at a type size you can see without a magnifying glass. In each example, you will need to edit the Target statement to give the proper hostname and community name, and you'll probably want to edit the PageTop setting so your graph displays the correct information for your host.
User and System CPU Usage
This first sample compares user CPU usage with system CPU usage as percentages. (Note that we use the gauge option.)
...............................................................................................
Title[myhost.AbsoluteBSD.com.cpu]: myhost.AbsoluteBSD.com CPU usage YLegend[myhost.AbsoluteBSD.com.cpu]: CPU usage WithPeak[myhost.AbsoluteBSD.com.cpu]: wmy MaxBytes[myhost.AbsoluteBSD.com.cpu]: 100
Target[myhost.AbsoluteBSD.com.cpu]:.1.3.6.1.4.1.2021.11.9.0&.1.3.6.1.4.1.2021.11.10.
0:public@myhost.AbsoluteBSD.com ShortLegend[myhost.AbsoluteBSD.com.cpu]: CPU LegendI[myhost.AbsoluteBSD.com.cpu]: User CPU
448
LegendO[myhost.AbsoluteBSD.com.cpu]: System CPU Legend1[myhost.AbsoluteBSD.com.cpu]: User Processor Usage Legend2[myhost.AbsoluteBSD.com.cpu]: System Processor Usage Legend3[myhost.AbsoluteBSD.com.cpu]: Maximal 5 Minute User Processor Usage Legend4[myhost.AbsoluteBSD.com.cpu]: Maximal 5 Minute System Processor Usage Options[myhost.AbsoluteBSD.com.cpu]: growright, gauge PageTop[myhost.AbsoluteBSD.com.cpu]: <H1>CPU usage for myhost.AbsoluteBSD.com </H1>
...............................................................................................
Swap Usage
Before you can measure swap space, you'll need to know how much swap your system has. You can get that information by doing an snmpwalk to get the total swap available, or snmpwalk hostname community .1.3.6.1.4.1.2021.4.3. Put that value in the MaxBytes space, and under the PageTop, so it will show up on your graph.
...............................................................................................
Title[myhost.AbsoluteBSD.com.swap]: myhost.AbsoluteBSD.com Available Swap YLegend[myhost.AbsoluteBSD.com.swap]: swap WithPeak[myhost.AbsoluteBSD.com.swap]: wmy MaxBytes[myhost.AbsoluteBSD.com.swap]: 128000 Target[myhost.AbsoluteBSD.com.swap]:
.1.3.6.1.4.1.2021.4.4.0&.1.3.6.1.4.1.2021.4.4.0:public@myhost.AbsoluteBSD.com ShortLegend[myhost.AbsoluteBSD.com.swap]: Swap LegendI[myhost.AbsoluteBSD.com.swap]: Available Swap LegendO[myhost.AbsoluteBSD.com.swap]: Available Swap Legend1[myhost.AbsoluteBSD.com.swap]: Available Swap Legend2[myhost.AbsoluteBSD.com.swap]: Available Swap Legend3[myhost.AbsoluteBSD.com.swap]: Maximal 5 Minute Available Swap Legend4[myhost.AbsoluteBSD.com.swap]: Maximal 5 Minute Available Swap Options[myhost.AbsoluteBSD.com.swap]: growright, gauge PageTop[myhost.AbsoluteBSD.com.swap]: <H1>Available Swap (out of 128M) for myhost.AbsoluteBSD.com </H1>
...............................................................................................
Disk Partition
Measuring the amount of space used on a disk partition is similarly easy, though you'll need to know the MIB index for the disk partition first. (See the examples in "Index Numbers" earlier in this chapter.) Be sure to give the correct size in the PageTop space.
...............................................................................................
Target[myhost.AbsoluteBSD.com.root]:.1.3.6.1.4.1.2021.9.1.9.1&.1.3.6.1.4.1.2021.9.1.
9.1:public@myhost.AbsoluteBSD.com
Title[myhost.AbsoluteBSD.com.root]: Myhost.AbsoluteBSD.com Root partition % used MaxBytes[myhost.AbsoluteBSD.com.root]: 100 WithPeak[myhost.AbsoluteBSD.com.root]: wmy Suppress[myhost.AbsoluteBSD.com.root]: y
LegendI[myhost.AbsoluteBSD.com.root]: % used Legend1[myhost.AbsoluteBSD.com.root]: % used YLegend[myhost.AbsoluteBSD.com.root]: percent used ShortLegend[myhost.AbsoluteBSD.com.root]: used Options[myhost.AbsoluteBSD.com.root]: gauge, growright PageTop[myhost.AbsoluteBSD.com.root]: <H1>myhost Root partition (% of 128M) used </H1>
449
...............................................................................................
Network Traffic
Just for completeness, let's look at a sample of how to measure network traffic. This assumes a 10Mbps network connection; if you're using 100BaseT, multiply MaxBytes by 10.
...............................................................................................
Title[myhost.AbsoluteBSD.com.traffic]: myhost.AbsoluteBSD.com network traffic MaxBytes[myhost.AbsoluteBSD.com.traffic]: 125000 WithPeak[myhost.AbsoluteBSD.com.traffic]: wmy Target[myhost.AbsoluteBSD.com.traffic]: public@myhost.AbsoluteBSD.com Options[myhost.AbsoluteBSD.com.traffic]: growright, bits PageTop[myhost.AbsoluteBSD.com.traffic]: <H1>Network traffic on myhost.AbsoluteBSD.com </H1>
...............................................................................................
Monitoring Non−BSD Systems
MRTG can monitor any system that uses SNMP; it is a standard spoken by almost every network−equipment and operating−system vendor. To do so, all you need is the list of MIBs that the product supports and what they mean. Tables of MIB interpretations—simple text files containing tables of how to read the vendor's MIB tree–are generally available from vendors. Each file starts something like this:
...............................................................................................
IPV6−MIB DEFINITIONS ::= BEGIN
IMPORTS
MODULE−IDENTITY, OBJECT−TYPE, NOTIFICATION−TYPE, mib−2, Counter32, Unsigned32, Integer32,
Gauge32 |
FROM SNMPv2−SMI |
DisplayString, PhysAddress, TruthValue, TimeStamp, |
|
VariablePointer, RowPointer |
FROM SNMPv2−TC |
MODULE−COMPLIANCE, OBJECT−GROUP, |
|
NOTIFICATION−GROUP |
FROM SNMPv2−CONF |
Ipv6IfIndex, Ipv6Address, Ipv6AddressPrefix, |
|
Ipv6AddressIfIdentifier, |
|
Ipv6IfIndexOrZero |
FROM IPV6−TC; |
...............................................................................................
Copy these definition files to a directory on your system. Next, set the environment variable MIBDIRS to point to that directory, and snmptranslate will recognize them.
You can even install SNMP on your NT systems; this makes them easy to monitor, at a fraction of the cost of commercial systems. The only difference between MRTG and a commercial system is that you must know what you're doing to use MRTG. I highly recommend Garth Williams’ "SNMP for the Public Community" site (http://www.wtcs.org/snmp4tpc/) for SNMP on other platforms. Be warned in advance: To call Microsoft's implementation of SNMP "skeletal" would leave you without an adequate description of its error messages. Windows 2000 and XP are better than NT, but not
450

by a huge amount.
451