

Beginning Visual C++ 2005 (2006) [eng]-1
.pdf
|
Debugging Techniques |
#define NDEBUG |
// Switch off assertions in the code |
#include <cassert> |
// Declares assert() |
If the expression passed as an argument to assert() is non-zero (i.e. true) the function does nothing. If the expression is 0 (false in other words) and NDEBUG are not defined, a diagnostic message is output showing the expression that failed, the source file name, and the line number in the source file where the failure occurred. After displaying the diagnostic message, the assert() function calls abort() to end the program. Here’s an example of an assertion used in a function:
char* append(char* pStr, const char* pAddStr)
{
//Verify non-null pointers assert(pStr != 0); assert(pAddStr != 0);
//Code to append pAddStr to pStr...
}
Calling the append() function with a null pointer argument in a simple program produced the following diagnostic message on my machine:
Assertion failed: pStr != 0, file c:\beginning visual c++.net\examples\testassert\ testassert \ testassert.cpp, line 11
The assertion also displays a message box offering you the three options shown in Figure 10-10.
Figure 10-10
Clicking the Abort button ends the program immediately. The Retry button starts the Visual C++ 2005 debugger so you can step through the program to find out more about why the assertion failed. In principle, the Ignore button allows the program to continue in spite of the error, but this is usually an unwise choice as the results are likely to be unpredictable.
579

Chapter 10
You can use any kind of logical expression as an argument to assert(). You can compare values, check pointers, validate object types, or whatever is a useful check on the correct operation of your code. Getting a message when some logical condition fails helps a little, but in general you will need considerably more assistance than that to detect and fix bugs. Tale a look at how you can add diagnostic code of a more general nature.
Adding Your Own Debugging Code
Using preprocessor directives, you can arrange to add any code you like to your program so that it is only compiled and executed in the debug version. Your debug code is omitted completely from the release version, so it does not affect the efficiency of the tested program at all. You could use the absence of the NDEBUG symbol as the control mechanism for the inclusion of debugging code; that’s the symbol used to control the assert() function operation in the standard library, as discussed in the last section. Alternatively, for a better and more positive control mechanism, you can use another preprocessor symbol, _DEBUG, that is always defined automatically in Visual C++ in the debug version of a program, but is not defined in the release version. You simply enclose code that you only want compiled and executed when you are debugging between a preprocessor #ifdef/#endif pair of directives, with the test applied to the _DEBUG the symbol, as follows:
#ifdef _DEBUG
// Code for debugging purposes...
#endif // _DEBUG
The code between the #ifdef and the #endif is only compiled only if the symbol _DEBUG is defined. This means that once your code is fully tested, you can produce the release version completely free of any overhead from your debugging code. The debug code can do anything that is helpful to you in the debugging process, from simply outputting a message to trace the sequence of execution (each function might record that it was called for example) to providing additional calculations to verify and validate data, or calling functions providing debug output.
Of course, you can have as many blocks of debug code like this in a source file as you want. You also have the possibility of using your own preprocessor symbols to provide more selectivity as to what debug code is included. One reason for doing this is if some of your debug code produced voluminous output, so you would only want to generate this when it was really necessary. Another is to provide granularity in your debug output, so you can pick and choose which output is produced on each run. But even in these instances it is still a good idea to use the _DEBUG symbol to provide overall control because this automatically ensures that the release version of a program is completely free of the overhead of debugging code.
Consider a simple case. Suppose you used two symbols of your own to control debug code: MYDEBUG that managed “normal” debugging code and VOLUMEDEBUG that you use to control code that produced a lot more output, and that you only wanted some of the time. You can arrange that these symbols are defined only if _DEBUG is defined:
#ifdef _DEBUG
#define MYDEBUG
#define VOLUMEDEBUG
#endif
580

Debugging Techniques
To prevent volume debugging output you just need to comment out the definition of VOLUMEDEBUG, and neither symbol is defined if _DEBUG is not defined. Where your program has several source files, you will probably find it convenient to place your debug control symbols together in a header file and then #include the header into each file that contains debugging code.
Examine a simple example to see how adding debugging code to a program might work in practice.
Try It Out |
Adding Code for Debugging |
To explore these and some general debugging approaches, take an example of a program that, while simple, still contains quite a few bugs that you can find and eliminate. Thus you must regard all the code in the remainder of this chapter as suspect, particularly because it will not necessarily reflect good programming practice.
For experimenting with debugging operations, start by defining a class that represents a person’s name and then proceed to test it in action. There is a lot wrong with this code, so resist the temptation to fix the obviously erroneous code here; the idea is to exercise the debugging operations to find them. However, in practice a great many bugs are very evident as soon as you run a program. You don’t necessarily need the debugger or additional code to spot them.
Create an empty Win32 console application, Ex10_01. Next, add a header file, Name.h, to which you’ll add the definition of the Name class. The class represents a name by two data members that are pointers to strings storing a person’s first and second names. If you want to be able to declare arrays of Name objects you must provide a default constructor in addition to any other constructors. You want to be able to compare Name objects, so you should include overloaded operators in the class to do this. You also want to be able to retrieve the complete name as a single string for convenience. You can add a definition of the Name class to the Name.h file as follows:
//Name.h – Definition of the Name class #pragma once
//Class defining a person’s name
class Name
{
public:
Name(); // Default constructor Name(const char* pFirst, const char* pSecond); // Constructor
char* getName(char* pName) const; |
// |
Get |
the |
complete |
name |
size_t getNameLength() const; |
// |
Get |
the |
complete |
name length |
// Comparison operators for names
bool operator<(const Name& name) const; bool operator==(const Name& name) const; bool operator>(const Name& name) const;
private:
char* pFirstname; char* pSurname;
};
581

Chapter 10
You can now add a Name.cpp file to the project to hold the definitions for the member functions of Name. The constructor definitions are shown here:
// Name.cpp – Implementation of the Name class |
|
#include “Name.h” |
// Name class definitions |
#include “DebugStuff.h” |
// Debugging code control |
#include <cstring> |
// For C-style string functions |
#include <cassert> |
// For assertions |
#include <iostream> |
|
using namespace std; |
|
// Default constructor |
|
Name::Name() |
|
{ |
|
#ifdef CONSTRUCTOR_TRACE |
|
// Trace constructor calls |
|
cerr << “\nDefault Name constructor called.”; |
|
#endif |
|
pFirstname = pSurname = “\0”; |
|
} |
|
// Constructor
Name::Name(const char* pFirst, const char* pSecond):
pFirstname(pFirst), pSurname(pSecond)
{
// Verify that arguments are not null assert(pFirst != 0);
assert(pSecond != 0);
#ifdef CONSTRUCTOR_TRACE
// Trace constructor calls
cout << “\nName constructor called.”; #endif
}
Of course, you don’t particularly want to have Name objects that have null pointers as members, so the default constructor assigns empty strings for the names. You have used your own debug control symbol, CONSTRUCTOR_TRACE, to control output that traces constructor calls. Add the definition of this symbol to the DebugStuff.h header a little later. You could put anything at all as debug code here, such as displaying argument values, but it is usually best to keep it as simple as your debugging requirements allow; otherwise, your debug code may introduce further bugs. Here you just identify the constructor when it is called.
You have two assertions in the constructor to check for null pointers being passed as arguments. You could have combined these into one, but by using a separate assertion for each argument, you can identify which pointer is null (unless they both are, of course).
You might also want to check that the strings are not empty in an application by counting the characters prior to the terminating ‘\0’ for instance. However, you should not use an assertion to flag this. This sort of thing could arise as a result of user input, so ordinary program checking code should be added to deal with errors that may arise in the normal course of events. It is important to recognize the difference between bugs (errors in the code) and error conditions that can be expected to arise during normal operation of a program. The constructor should never be passed a null pointer, but a zero length name could
582

Debugging Techniques
easily arise under normal operating conditions (from keyboard input, for example). In this case it would probably be better if the code reading the names were to check for this before calling the Name class constructor. You want errors that arise during normal use of a program to be handled within the release version of the code.
The getName() function requires the caller to supply the address of an array that accommodate the name:
//Return a complete name as a string containing first name, space, surname
//The argument must be the address of a char array sufficient to hold the name char* Name::getName(char* pName) const
{
assert(pName != 0); |
// Verify non-null argument |
#ifdef FUNCTION_TRACE |
|
// Trace function calls |
|
cout << “\nName::getName() called.”; |
|
#endif |
|
strcpy(pName, pFirstname); |
// copy first name |
pName[strlen(pName)] = ‘ ‘; |
// Append a space |
// Append second name and return total |
|
return strcpy(pName+strlen(pName)+1, pSurname); |
|
} |
|
Here you have an assertion to check that the pointer argument passed is not null. Note that you have no way to check that the pointer is to an array with sufficient space to hold the entire name. You must rely on the calling function to do that. You also have debug code to trace when the function is called. Having a record of the complete sequence of calls up to the point where catastrophe strikes can sometimes provide valuable insights as to why and how the problem arose.
The getNameLength() member is a helper function that enables the user of a Name object to determine how much space must be allocated to accommodate a complete name:
// Returns the total length of a name size_t Name::getNameLength() const
{
#ifdef FUNCTION_TRACE
// Trace function calls
cout << “\nName::getNameLength() called.”; #endif
return strlen(pFirstname)+strlen(pSurname);
}
A function that intends to call getName() is able use the value returned by getNameLength() to determine how much space is needed to accommodate a complete name. You also have trace code in this member function.
In the interests of developing the class incrementally, you can omit the definitions for the overloaded comparison operators. Definitions are only required for member functions that you actually use in your program, and in your initial test program you keep it very simple.
583

Chapter 10
You can define the preprocessor symbols control whether or not the debug code is executed in the
DebugStuff.h header:
// DebugStuff.h - Debugging control #pragma once
#ifdef _DEBUG
#define CONSTRUCTOR_TRACE |
// Output constructor call trace |
#define FUNCTION_TRACE |
// Trace function calls |
#endif |
|
Your control symbols are defined only if _DEBUG is defined, so none of the debug code is included in a release version of the program.
You can now try out the Name class with the following main() function:
// Ex10_01.cpp : Including debug code in a program
#include <iostream> using namespace std; #include “Name.h”
int main(int argc, char* argv[]) |
|
{ |
|
Name myName(“Ivor”, “Horton”); |
// Try a single object |
//Retrieve and store the name in a local char array char theName[10];
cout << “\nThe name is “ << myName.getName(theName);
//Store the name in an array in the free store char* pName = new char[myName.getNameLength()+1]; cout << “\nThe name is “ << myName.getName(pName);
cout << endl; return 0;
}
Now that all the code has been entered, double-checked, and is completely correct, all you have to do is run it to make sure. Hardly seems necessary.
How It Works
Well it doesn’t-it doesn’t even compile, does it? The major problem is the Name constructor. The parameters are const, as they should be, but the data members are not. You could declare the data members as const, but anyway, you should be copying the name strings, not just copying the pointers. Amend the constructor definition to:
// Constructor
Name::Name(const char* pFirst, const char* pSecond)
584

Debugging Techniques
{
// Verify that arguments are not null assert(pFirst != 0);
assert(pSecond != 0);
#ifdef CONSTRUCTOR_TRACE
// Trace constructor calls
cout << “\nName constructor called.”; #endif
pFirstname = new char[strlen(pFirst)+1]; strcpy(pFirstname, pFirst);
pFirstname = new char[strlen(pSecond)+1]; strcpy(pSurname, pSecond);
}
Now you are copying the strings so you should be OK now, shouldn’t you?
When you recompile the program there are some warnings about the strcpy() function being deprecated because it’s much better to use strcpy_s() but strcpy() does work so ignore these in this exercise. However, when you rerun the program it fails almost immediately. You can see from the console window that you got a message from the constructor, so you know roughly how far the execution went. Restart the program under the control of the debugger and you can see what happened.
Debugging a Program
When the debugger starts, you get a message box indicating you have an unhandled exception. In the debugger, you have a comprehensive range of facilities for stepping through your code and tracing the sequence of events. Click Break in the dialog that indicates there is an unhandled exception to halt execution. The program is at the point where the exception occurred and the code currently executing is in the editor window. The exception is caused by referring to a memory location way outside the realm of the program, so a rogue pointer in our program is the immediate suspect.
The Call Stack
The call stack stores information about functions that have been called and are still executing because they have not returned yet. As you saw earlier, the Call Stack window shows the sequence of function calls outstanding at the current point in the program. Refer to Figure 10-11.
Figure 10-11
585

Chapter 10
The sequence of function calls outstanding runs from the most recent call at the top, the library function strcat(), down to the Kernel32 calls at the bottom of the window in Figure 10-11. Each function was called directly or indirectly by the one below it, and none of those displayed have yet executed a return. The Kernel32 lines are all system routines that start executing prior to our main() function. Your interest is the role of your code in this, and you can see from the second line down in the window that the Name class constructor was still in execution (had not returned) when the exception was thrown. If you double-click on that line, the Editor window displays the code for that function, and indicates the line in the source code being executed when the problem arose, which in this case is:
strcpy(pSurname, pSecond);
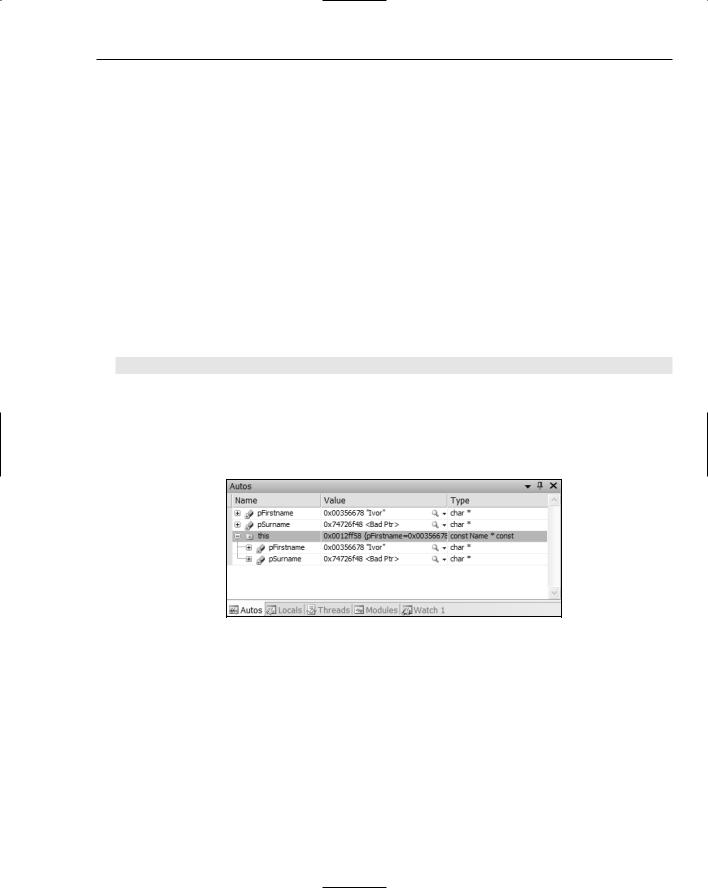
This call caused the unhandled exception to be thrown — but why? The original problem is not necessarily here; it just became apparent here. This is typical of errors involving pointers. Take a look at the window showing the values in the variables in the context of the Name constructor that is presently displayed in the Editor pane. Figure 10-12 shows how it looks.
Figure 10-12
Because the context is a function that is a member of the Name class, the Autos window displays the this pointer that contains the address of the current object. The pSurname pointer contains a weird address, 0xcccccccc, that corresponds to 3435973836 in decimal! Because I have rather less than 3 billion bytes of memory, it looks a bit unlikely, and the debugger recognizes that pSurname has got to be a rogue pointer and has marked it as such. If you look at pFirstname, this is also in a mess. At the point where you are in the code (copying the surname) the first name should already have been copied, but the contents are rubbish.
The culprit is in the preceding line. Hasty copying of code has resulted in allocating memory for pFirstname for a second time, instead of allocating space for pSurname. The copy is to a junk address, and this causes the exception to be thrown. Don’t you wish you had checked what you did, properly? The line should be:
pSurname = new char[strlen(pSecond)+1];
It is typically the case that the code causing a bad pointer address is not the code where the error makes itself felt. In general it may be very far away. Just examining the pointer or pointers involved in the statement causing the error can often lead you directly to the problem, but sometimes it can involve a lot of searching. You can always add more debug code if you get really stuck.
586
Debugging Techniques
Change the statement in the Editor window to what it should be and recompile the project with the change included. You can then restart the program inside the debugger after it has been recompiled by clicking the button on the Debug toolbar, but surprise, surprise-you get another unhandled exception. This undoubtedly means more pointer trouble, and you can see from the output in the console window that the last function call was to getNameLength():
Name constructor called.
Name::getName() called.
The name is Horton
Name::getNameLength() called.
The output for the name is definitely not right; however, you don’t know where exactly the problem is. Restarting and stepping through the program once more should provide some clues.
Step Over to the Error
The getNameLength() function is currently displayed in the Editor pane and the debugger has indicated that the following line is where the problem arose:
return strlen(pFirstname)+strlen(pSurname)+1;
In the Call Stack window, you can see that the program is in the getNameLength() function member, which merely calls the strlen() library function to get the overall length of the name. The strlen() function is unlikely to be at fault, so this must mean there is something wrong with part of the object. The Autos window showing the variables in the context of this function shows that the current object has been corrupted, as you can see in Figure 10-13.
Figure 10-13
The current object is pointed to by this, and by clicking the plus symbol alongside this you can see the data members. It’s the pSurname member that is the problem. The address it contains should refer to the string “Horton,” but it clearly doesn’t. Further, the debugger has flagged it as a bad pointer.
On the assumption that this kind of error does not originate at the point where you experience the effect, you can go back, restart the program, and single step through, looking for where the Name object gets messed up. You can select Step Over or press F10 to restart the application, and single step through the statements by repeatedly pressing F10. After executing the statement that defines the myName object, the Autos window for the main() function shows that it has been constructed successfully, as you can see in Figure 10-14.
587
Chapter 10
Figure 10-14
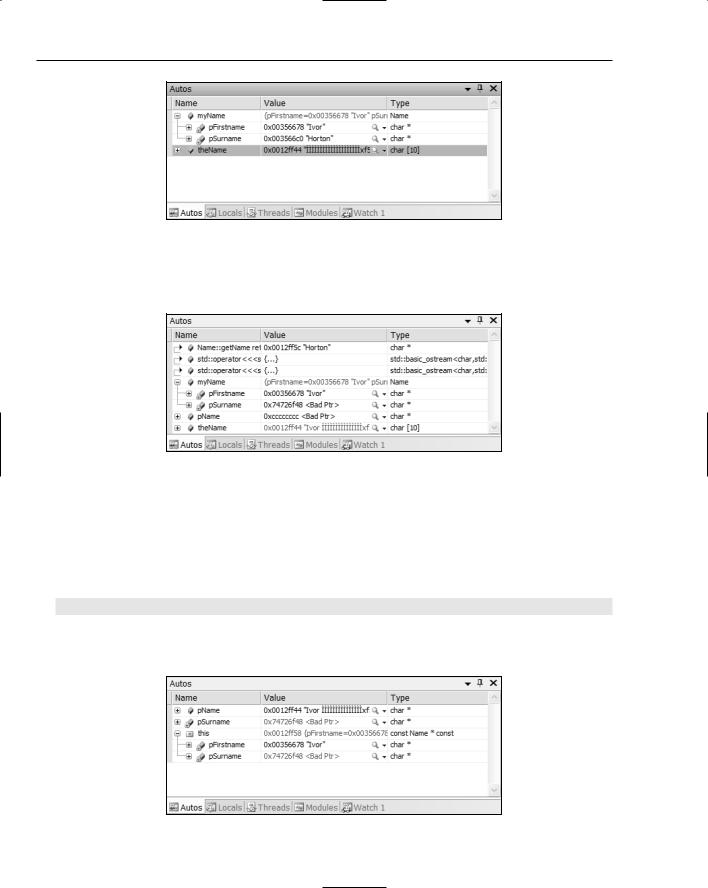
Executing the next statement that outputs the name corrupts the object, myName. You can clearly see that this is the case from the Autos window for main() in Figure 10-15.
Figure 10-15
On the reasonable assumption that the stream output operations work OK, it must be your getName() member doing something it shouldn’t. Restart the debugger once more, but this time use Step Into when execution reaches the output statement. When execution is at the first statement of the getName() function, you can step through the statements in the getName() function using Step Over. Watch the context window as you progress through the function. You will see that everything is fine until you execute the statement:
strcpy(pName+strlen(pName)+1, pSurname); |
// Append second name after the space |
This statement causes the corruption of pSurname for the current object, pointed to by this. You can see this in the Autos window in Figure 10-16.
Figure 10-16
588