

Professional VSTO 2005 - Visual Studio 2005 Tools For Office (2006) [eng]
.pdfChapter 7
Dim style As Excel.Style = DirectCast(rng.Style, Excel.Style) style.Font.Name = “Arial”
style.Font.Size = 10 style.Font.Color =
System.Drawing.ColorTranslator.ToOle(System.Drawing.Color.Black) style.Interior.Color = System.Drawing.ColorTranslator.ToOle(System.Drawing.Color.Beige)
style.Interior.Pattern = Excel.XlPattern.xlPatternSolid End If
End If
End Sub
C#
private void button1_Click(object sender, EventArgs e)
{
Excel.PivotTable table = Globals.Sheet1.PivotTables(“myPivotTable”) as Excel.PivotTable;
if (table != null)
{
if (table.RowRange != null)
{
Excel.Range rng = table.RowRange; Excel.Style style = rng.Style as Excel.Style;
style.Font.Name = “Arial”; style.Font.Size = 10; style.Font.Color =
System.Drawing.ColorTranslator.ToOle(System.Drawing.Color.Black); style.Interior.Color =
System.Drawing.ColorTranslator.ToOle(System.Drawing.Color.Beige); style.Interior.Pattern = Excel.XlPattern.xlPatternSolid;
}
}
}
Listing 7-6 Style object customization in pivot table reports
The code in Listing 7-6 shows that a button’s Click event contains the code that implements styles. To run this example correctly, you can simply place a button on the Excel spreadsheet. If you double-click that button, a Button1_Click event handler will be generated for you automatically. Then, you can place the code in Listing 7-6 in the body of the handler. A more sophisticated approach is to place the button in an Excel actions pane as described in Chapter 3.
Following from Listing 7-6, a style object is retrieved from the row Range object. The row Range object returns a reference for the entire row of the pivot table. Notice also that the table variable reference is retrieved for the PivotTable1 object. Consequently, formatting of the style object is applied to the rows of the pivot table. You should expect to see the customizations applied to the entire PivotTable object even though you are using a style for the row range.
288

Pivot Table Automation
Data Formatting with NumberFormats
The large majority of pivot reports deal with numeric data. When you display data, the accounting format is usually the most appropriate because it allows numerical data to be presented consistently and neatly. In addition to supporting the accounting format, the PivotTable object is also able to display numeric data based on a NumberFormat mask. Listing 7-7 provides a quick example of NumberFormat usage since this topic has been covered in several chapters.
Visual Basic
Dim table As Excel.PivotTable = DirectCast(Me.PivotTables(“MyPivotTable”),
Excel.PivotTable)
If table IsNot Nothing Then
Dim pField As Excel.PivotField =
DirectCast(table.PivotFields(“Customerid”), Excel.PivotField)
table.AddDataField(table.PivotFields(“Freight”), “Sum of Freight”,
Excel.XlConsolidationFunction.xlSum)
table.RowGrand = False
Dim rng As Excel.Range = table.RowRange
rng.NumberFormat = “General”
End If
End Sub
C#
private void Formatter()
{
Excel.PivotTable table = this.PivotTables(“MyPivotTable”) as Excel.PivotTable;
if (table != null)
{
Excel.PivotField pField = table.PivotFields(“Customerid”) as Excel.PivotField;
table.AddDataField(table.PivotFields(“Freight”), “Sum of Freight”, Excel.XlConsolidationFunction.xlSum);
table.RowGrand = false; Excel.Range rng = table.RowRange; rng.NumberFormat = “General”;
}
}
Listing 7-7 NumberFormat customization with pivot tables
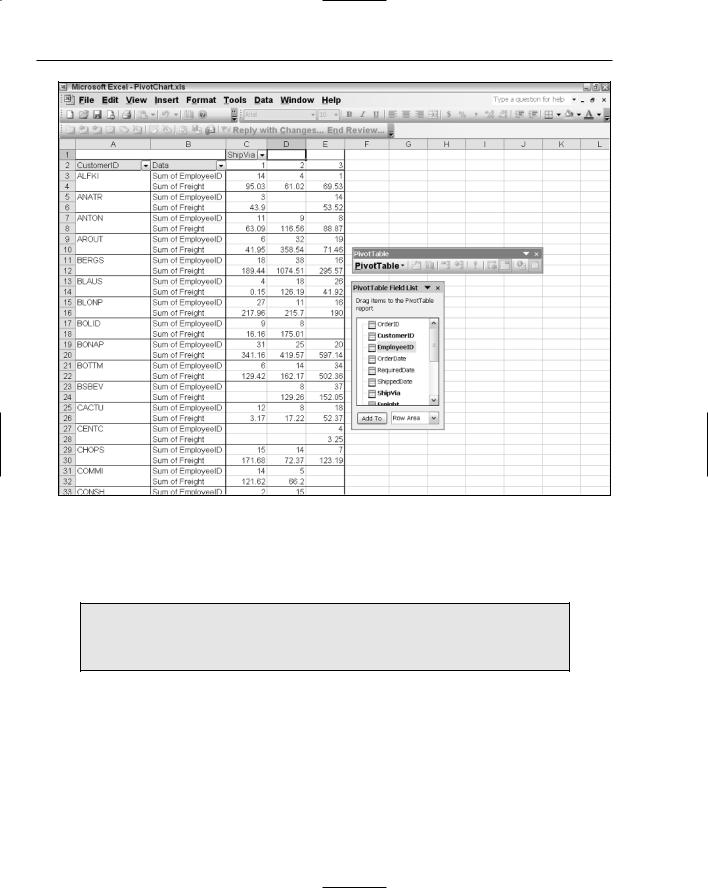
Listing 7-7 shows some code to add a pivot field to a pivot table report application. As usual, a reference to the active pivot table report is retrieved using the name identifier. Then, a reference to the pivot field titled CustomerID is retrieved. The value is case insensitive. At this point, the code adds a data field called freight to the report and titles it appropriately. The data field is expected to appear in the body of the pivot table object, since it is added using a DataField method call.
One way to execute the code in Listing 7-7 is to first generate a pivot table report and drop the required CustomerID field onto the row axis. Then drop the ShipVia field onto the column axis. You can simply choose to invoke the code in Listing 7-7 at this point, and the data field should automatically be populated with aggregates of freight information. However, if the pivot table report application already contains data values, the new freight columns are merged in neatly for each customer. Consider Figure 7-8.
289
Chapter 7
Figure 7-8
The observant reader should recognize the existing code. Notice that NumberFormat is set to General. As you may recall, the General type serves as a reset for the NumberFormat display. For a review on number formats, see Chapter 3.
The decision to reuse the Excel Range in a pivot table application is a good design choice because it serves to drastically reduce the volume of new information required to be proficient at pivot table applications.
Pivot Axis Iteration
As you know, the pivot table object consists of row and column axes. The axes are an integral part of the pivoting mechanism. A definition of pivot axis is presented at the start of the chapter. Building from this definition, you can enhance the functionality of the slicing mechanism significantly by customizing these axes. For instance, you may provide totals or formatting functionality on a specified axis. Listing 7-8 shows us some basic code to probe an axis.
290

Pivot Table Automation
Visual Basic
Private Sub IterateAxes()
Dim table As Excel.PivotTable = DirectCast(Me.PivotTables(“MyPivotTable”), Excel.PivotTable)
If ( table IsNot Nothing) Then
Dim rng As Excel.Range = table.RowRange Dim cell As Excel.Range = Nothing
Dim rowCount As Integer = rng.Rows.Count Dim row As Integer
For row = 1 To rowCount- 1 Step row + 1
cell = DirectCast(rng.Cells(row, 1), Excel.Range)
If ( cell IsNot Nothing) Then
cell.AddComment(“ This is some text added to the field “ +
cell.Text.ToString())
cell.Interior.Color = System.Drawing.ColorTranslator.ToOle(System.Drawing.Color.Wheat)
cell.Font.Underline = True End If
Next End If End Sub
C#
private void IterateAxes()
{
Excel.PivotTable table = this.PivotTables(“MyPivotTable”) as Excel.PivotTable;
if (table != null)
{
Excel.Range rng = table.RowRange; Excel.Range cell= null;
int rowCount = rng.Rows.Count;
for(int row = 1; row < rowCount; row++)
{
cell = rng.Cells[row, 1] as Excel.Range; if (cell != null)
{
cell.AddComment(“ This is some text added to the field “ +
cell.Text);
cell.Interior.Color = System.Drawing.ColorTranslator.ToOle(System.Drawing.Color.Wheat);
cell.Font.Underline = true;
}
}
}
}
Listing 7-8 Iterating pivot axes
In Listing 7-8, a reference to the axis is obtained using the table.RowRange object. If you needed to iterate the Column, Data, or DataLabel axes, you only need to use the appropriate reference here. The formatting and customization approaches learned in Chapter 3 are directly applicable here as well. Since we are iterating a particular column, we can hard code the column to a value of 1 and retrieve a refer-
291

Chapter 7
ence to it via the Cells property. Once you have a reference to the Cells property, you can add a comment, underline the text, and add the appropriate color as necessary.
It should come as no surprise that the code to iterate the axes in a pivot table list object is modeled on the Excel Range. However, if you’re already accustomed to pivot tables in VBA for instance, the specific axes objects that allow for pivot axis iteration are no longer available. These objects have been replaced. This is good news for new adopters of this technology, but it can be frustrating for VBA developers moving to this new platform. One issue for VBA developers is that the macro code generated in Excel is no longer directly portable. Some modifications must be made.
Pivot Filtering
One of the benefits of a pivot table is the ability to automatically filter data. The filter mechanism is already internally implemented so no work is required on your part. However, you may still require the ability to enhance that filter mechanism. The code in Listing 7-9 displays the top five items for a pivot table report.
Visual Basic
Private Sub Top5()
Dim table As Excel.PivotTable =
DirectCast(Me.PivotTables(“MyPivotTable”), Excel.PivotTable)
If ( table IsNot Nothing) Then
Dim pField As Excel.PivotField =
DirectCast(table.PivotFields(“Customerid”), Excel.PivotField)
pField.AutoShow(Excel.Constants.xlAutomatic, Excel.Constants.xlTop, 5,
“Sum of EmployeeID”)
End If
End Sub
C#
private void Top5()
{
Excel.PivotTable table = this.PivotTables(“MyPivotTable”) as Excel.PivotTable;
if (table != null)
{
Excel.PivotField pField = table.PivotFields(“Customerid”) as Excel.PivotField;
pField.AutoShow((int)Excel.Constants.xlAutomatic, (int)Excel.Constants.xlTop, 5, “Sum of EmployeeID”);
}
}
Listing 7-9 Pivot filtering
292

Pivot Table Automation
Listing 7-9 shows code that first retrieves a reference to the pivot table report using the named identifier. From there, the AutoShow method is called, indicating the number to be displayed and the column to be filtered. The filter functionality is not necessarily limited to the pivot axes; it may be used to filter on pages as well. One scenario where this is helpful is in restricting the number of items that appear on the pivot table axis by default. You should note that the user can easily reproduce this functionality by using the filter drop-down list.
The code is successfully executed if a column captioned “Sum of EmployeeID” is found; otherwise, an exception is thrown. The net effect of the code restricts the data shown in the EmployeeID axis to the top five values. Consequently, the Row Axis is adjusted to show five values. This is an effective way to filter away unwanted data. The filter mechanism is also powerful enough to allow a range of other functionality. Consult the help documentation frequently to improve on the filtering experience for the user.
Adding Miscellaneous Columns
One enhancement to a pivot table report is the ability to add additional columns. The additional column may represent any sort of functionality or feature that the user requires. One common request is an extra column that counts the number of items in a specific field. Listing 7-10 shows some code to achieve this.
Visual Basic
Private Sub OrderItems ()
Dim table As Excel.PivotTable =
DirectCast(Me.PivotTables(“MyPivotTable”) , Excel.PivotTable)
If table IsNot Nothing Then
Dim pField As Excel.PivotField =
DirectCast(table.PivotFields(“Customerid”), Excel.PivotField) table.AddDataField(table.PivotFields(“OrderDate”), “ Ship by XMas
“, Excel.XlConsolidationFunction.xlCount) End If
End Sub
C#
private void OrderItems()
{
Excel.PivotTable table = this.PivotTables(“MyPivotTable”) as Excel.PivotTable;
if (table != null)
{
Excel.PivotField pField = table.PivotFields(“Customerid”) as Excel.PivotField;
table.AddDataField(table.PivotFields(“OrderDate”), “Ship by XMas”, Excel.XlConsolidationFunction.xlCount);
}
}
Listing 7-10 Addition of custom columns
A reference to the active pivot table report is retrieved by using the name identifier that was used initially to create the report. If the object is not null, we simply add a new column called OrderDate with an appropriate caption “Ship by Xmas” and a predefined function that tells the pivot table how to handle the
293

Chapter 7
data in this new field. In this case, the instruction is to count the number of items. If you care to run the code, you will notice that the pivot table report automatically totals each row with a grand total in the body of the pivot table report. To turn this functionality off, simply set the table.RowGrand to false.
Be aware though, that new data fields are based on columns that exist in the underlying data source, otherwise an exception is thrown. While the effect of Listing 7-10 is to add a data field to the pivot table report, you may use the AddField method of the pivot table object instead of the AddDataField method to add new columns to the row, column, or page field axes. The implementation is trivial and is left as an exercise to the reader.
The Excel.XlConsolidationFunction shown in Listing 7-10 contains 12 possible values. These values are applied to the fields that compose the column. In the case of Listing 7-10, each field is summed as it is rendered. You should note that the fields in a pivot table report must necessarily be unique, since these fields and their labels serve as internal identifiers. Addition of duplicate fields results in a runtime exception. Such an exception can be replicated easily by running the code in Listing 7-10 a second time.
Pivot Table Events
At the risk of sounding repetitive, you should notice that events are handled consistently across the VSTO object model. The basic approach remains the same. Find an event of interest, subscribe to it, and place code in the event handler. The event handler will be called, and the code will be executed whenever the event fires. As always, the variables that refer to events need to be declared global in scope in order for the event handler to work consistently throughout the application’s lifetime.
Listing 7-11 shows one approach to pivot table events.
Visual Basic
Sub Worksheet1_PivotTableUpdate(ByVal Target As Excel.PivotTable) _
Handles Me.PivotTableUpdate
MsgBox(“The PivotTable connection update event has fired.”)
End Sub
C#
private void WorksheetPivotTableUpdate()
{
this.PivotTableUpdate +=
new Excel.DocEvents_PivotTableUpdateEventHandler( Worksheet1_PivotTableUpdate);
}
void Worksheet1_PivotTableUpdate(Excel.PivotTable Target)
{
MessageBox.Show(“The PivotTable connection update event has fired “);
}
Listing 7-11 Pivot table list object event
294

Pivot Table Automation
The PivotTableUpdate event fires after the pivot table report is updated on the Excel worksheet. The VB portion of the code does not need to explicitly add an event handler in code. The event can be hooked up using the event property in the spreadsheet designer. Unfortunately, the pivot table does not expose a rich event model. In fact there are only a handful of events that are exposed and most of them are tied to the worksheet as in the case of Listing 7-11.
Having said this, it’s important to note that the Range object that forms the underpinnings of a large number of pivot table objects expose a lot of events that may be customized. You can take advantage of these events of the Excel Range objects to customize the pivot table further.
Creating Pivot Char ts
Pivot charts first appeared with the release of Excel 2000. As the name implies, the pivot chart object represents a chart bound to a pivot table application. The data is automatically sourced from the pivot data. Chapter 6 presented the VSTO chart and several approaches to loading, customizing, and displaying the data in the user interface. You should not be surprised to learn that the VSTO chart component is simply reused to create the pivot chart. With that knowledge, it should be fairly easy to construct a chart based on a pivot table and customize the data for display. You only need to learn how to connect a chart to a pivot table.
Listing 7-12 shows how to connect a chart to a pivot table.
Visual Basic
Dim table As Excel.PivotTable = DirectCast(Me.PivotTables(“MyPivotTable”), Excel.PivotTable)
Dim xlChart As Excel.Chart = CType(Globals.ThisWorkbook.Charts.Add(),
Excel.Chart)
xlChart.SetSourceData(table.TableRange1, Excel.Constants.xlColumn)
C#
Excel.PivotTable table = this.PivotTables(“MyPivotTable”) as Excel.PivotTable; Excel.Chart xlChart =
(Excel.Chart)Globals.ThisWorkbook.Charts.Add(missing, missing, missing, missing); xlChart.SetSourceData(table.TableRange1, Excel.Constants.xlColumn);
Listing 7-12 Creating Pivot charts
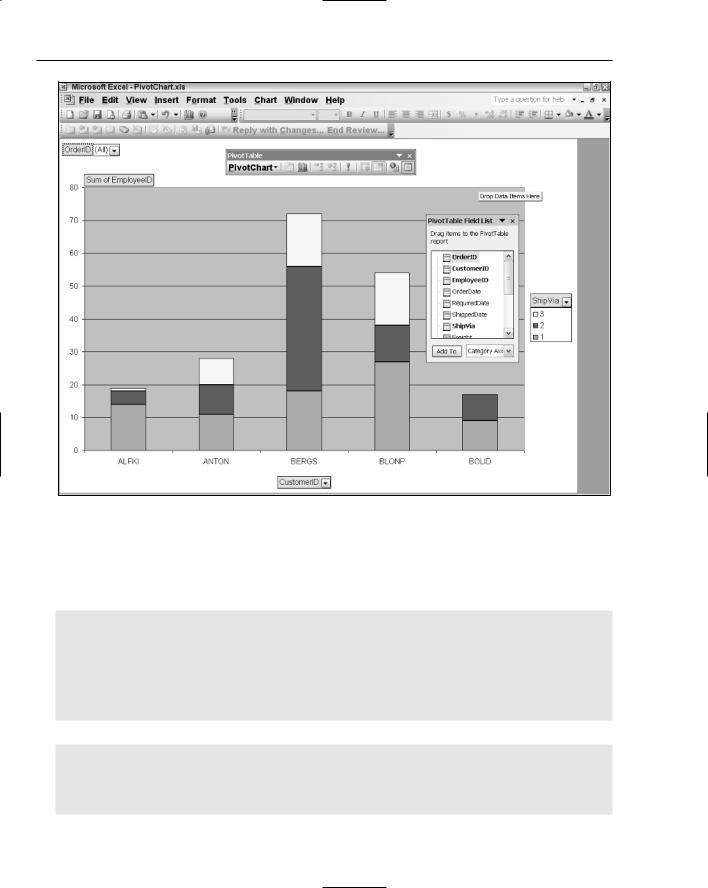
As usual, the code to create a chart based on a pivot table simply creates a stand-alone chart and then sets the source data as a pivot table range. The results are shown in Figure 7-9.
There isn’t much point in repeating the concepts and strategies presented in Chapter 6. However, let’s make a few additional notes before leaving. Notice that this approach does not allow us to relocate the pivot chart on the Excel spreadsheet surface. The pivot chart is created on the active sheet by default. In spite of this, you can use the location property of the chart object to move the chart to another worksheet after it has been rendered to the Excel spreadsheet.
295
Chapter 7
Figure 7-9
If this still does not suit your requirements, you should use the Chart Wizard to create the pivot chart. Set the source property as shown above and use the numerical parameters left, top, width, and height to position the chart appropriately on the Excel spreadsheet. Listing 7-13 contains a brief example.
Visual Basic
Dim table As Excel.PivotTable = DirectCast(Me.PivotTables(“MyPivotTable”), Excel.PivotTable)
Dim ChartObjects As Excel.ChartObjects = CType(Me.ChartObjects(),
Excel.ChartObjects)
Dim chartObject As Excel.ChartObject = ChartObjects.Add(1,20,250,250)
chartObject.Chart.ChartWizard(table.TableRange2,
Excel.XlChartType.xl3DColumn, ExtraTitle:=”Chart”))
C#
Excel.PivotTable table = this.PivotTables(“MyPivotTable”) as Excel.PivotTable;
Excel.ChartObjects ChartObjects = (Excel.ChartObjects)this.ChartObjects(missing);
296

Pivot Table Automation
Excel.ChartObject chartObject = ChartObjects.Add(1, 20, 250, 250);
chartObject.Chart.ChartWizard(table.TableRange2,Excel.XlChartType.xl3DColumn, missing, missing, missing,
missing, missing, “ Chart”, missing, missing, missing);
Listing 7-13 Pivot chart application based on PivotChart Wizard
As you can see, this approach allows the chart position to be precisely controlled. Additional functionality through the use of properties and methods can be applied by using the chartObject variable.
You may notice that Listing 7-13 uses table.TableRange2, whereas Listing 7-12 uses table.TableRange1 as the first parameter call to link the chart with the pivot table. Since both calls implicitly return ranges, what possible difference could there be? As it turns out, the TableRange1 retrieves a pivot table range that does not include the page field object of the pivot table report. The TableRange2 object returns the entire pivot table report object, including the page field.
From the user’s perspective, there is no perceived difference between these two approaches to load data into the pivot table report application. Internally, one simply provides location benefits over the other.
Pivot Table Limitations
Pivot tables do have certain limitations imposed on them. However, it is interesting to note that most of these limitations are imposed by the housing Excel object. For instance, Microsoft Excel does impose a limit on the number of cells that may be rendered to its surface. Additionally, this limit also applies to the number of characters that a cell may contain. These limits necessarily constrain the pivot table object, since it runs embedded inside the Excel spreadsheet.
As pointed out in this chapter, the pivot table is implicitly tied to the Excel spreadsheet. The benefit of this implicit relationship means that the underpinnings of many of the objects that form part of the pivot table can be built on the Excel Range object. Several examples of row axis manipulation show that the code is greatly simplified and requires less learning. On the other hand, this relationship necessarily implies that VBA code containing pivot tables cannot be directly ported to VSTO.
Pivot tables are built on the MDX language. Although you can accomplish a lot without acknowledging MDX’s importance, advanced customization of a pivot table application will require an in-depth knowledge of MDX. Your application can gain a significant performance boost by manipulating the details of a pivot table through MDX. You can also increase the complexity and display functionality of the data in the pivot table object through the MDX. However, learning to use MDX effectively is not a trivial process.
Pivot table applications can typically crunch through a large number of data items. These large datasets can sometimes strain system resources on the machine. There are also other instances when the pivot table can run out of memory or throw a runtime exception. Let’s briefly examine some of these hard limits.
The number of unique items per field cannot exceed 32,500.
The number of page fields in a pivot table report cannot exceed 256.
The number of data fields in a pivot table report cannot exceed 256.
The number of reports in a pivot table report is limited only by system resources.
297